正在加载图片...

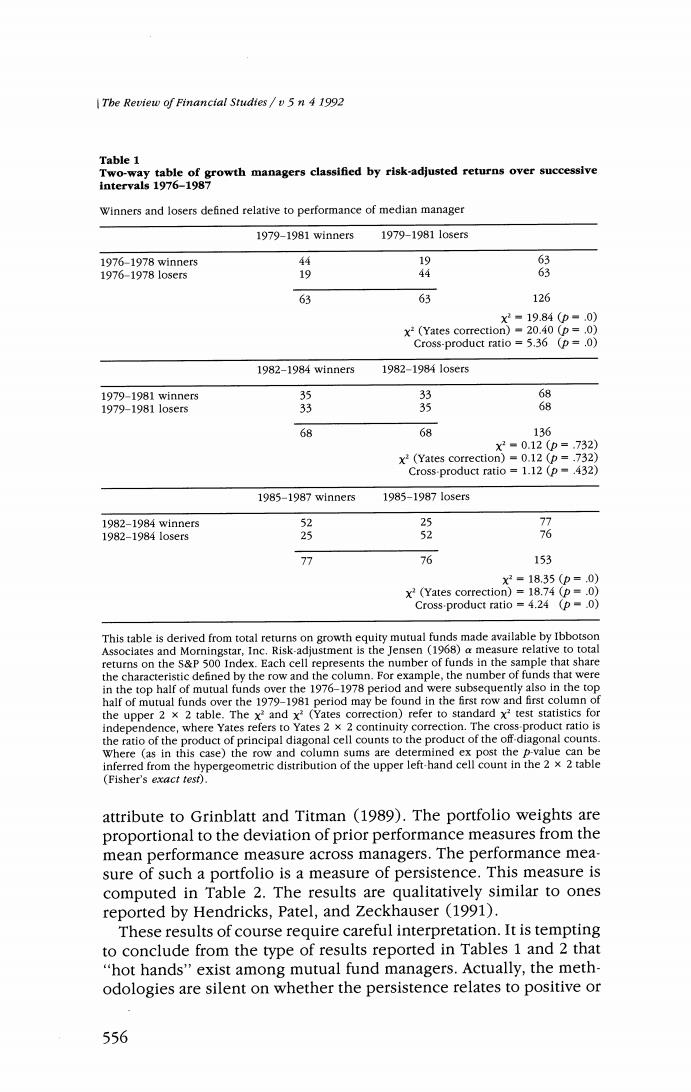
The Review of Financial Studtes/v 5n 4 1992 Table 1 Two-way table of growth managers classified by risk-adjusted returns over successive intervals 1976-1987 Winners and losers defined relative to performance of median manager 1979-1981 winners 1979-19811 osers 1976-1978 winner5 44 19 63 1976-1978105er5 19 63 63 126 X2=19.84(p=.0) x2(Yates correction)=20.40 (p=.0) Cross-product ratio 5.36 (p=.0) 1982-1984 winners 1982-19841o5er5 1979-1981 winners5 35 33 68 1979-19811o5er5 33 35 68 68 68 136 X2■0.12(p=.732) x2(Yates correction)=0.12 (p=.732) Cross-product ratio =1.12(p-.432) 1985-1987 winners 1985-19871 osers 1982-1984 winners 52 5 77 1982-19841 osers 25 52 76 77 76 153 x2=18.35(p=.0) x2(Yates correction)=18.74 (p=.0) Cross-product ratio =4.24 (p=.0) This table is derived from total returns on growth equity mutual funds made available by Ibbotson Associates and Morningstar,Inc.Risk-adjustment is the Jensen (1968)a measure relative to total returns on the s&P 500 Index.Each cell represents the number of funds in the sample that share the characteristic defined by the row and the column.For example,the number of funds that were in the top half of mutual funds over the 1976-1978 period and were subsequently also in the top half of mutual funds over the 1979-1981 period may be found in the first row and first column of the upper 2 x 2 table.The x2 and x?(Yates correction)refer to standard x?test statistics for independence,where Yates refers to Yates 2 x 2 continuity correction.The cross-product ratio is the ratio of the product of principal diagonal cell counts to the product of the off-diagonal counts. Where (as in this case)the row and column sums are determined ex post the p-value can be inferred from the hypergeometric distribution of the upper left-hand cell count in the 2 x 2 table (Fisher's exact test). attribute to Grinblatt and Titman (1989).The portfolio weights are proportional to the deviation of prior performance measures from the mean performance measure across managers.The performance mea- sure of such a portfolio is a measure of persistence.This measure is computed in Table 2.The results are qualitatively similar to ones reported by Hendricks,Patel,and Zeckhauser (1991). These results of course require careful interpretation.It is tempting to conclude from the type of results reported in Tables 1 and 2 that "hot hands"exist among mutual fund managers.Actually,the meth- odologies are silent on whether the persistence relates to positive or 556