正在加载图片...

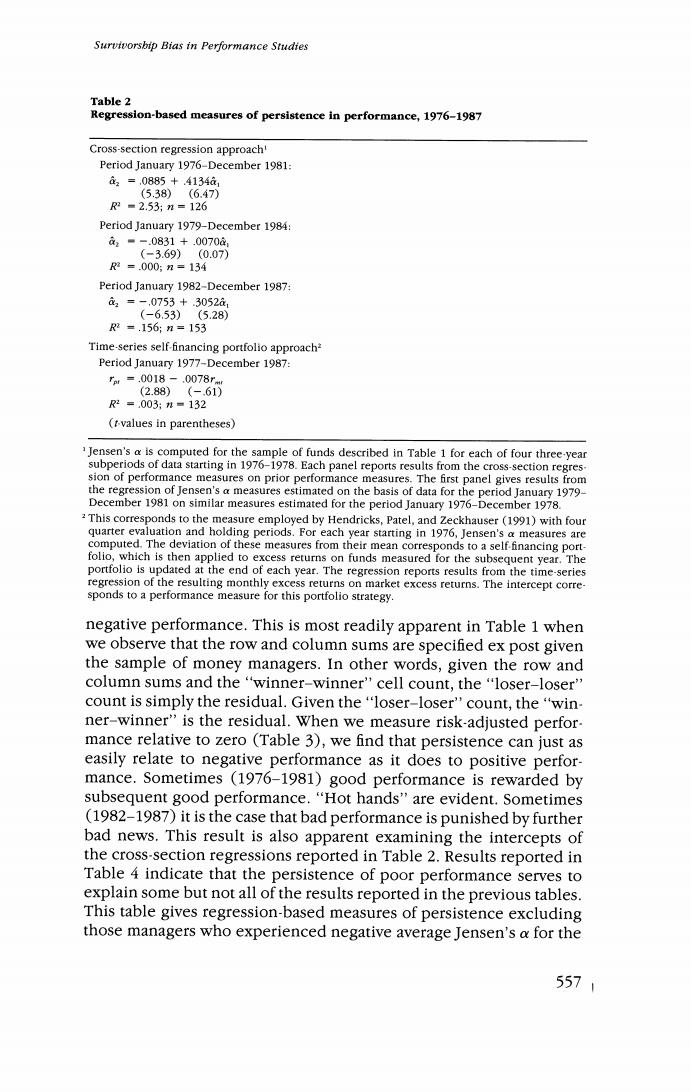
Survivorsbip Bias in Performance Studies Table 2 Regression-based measures of persistence in performance,1976-1987 Cross-section regression approach' Period January 1976-December 1981: a2=,0885+.4134a1 (5.38)(6.47) R2=2.53;n=126 Period January 1979-December 1984: c1■-.0831+.0070a, (-3.69)(0.07) R2=.000:n=134 Period January 1982-December 1987: a=-.0753+.3052a, (-6.53)(5.28) R2=.156:n=153 Time-series self-financing portfolio approach? Period January 1977-December 1987: m=0018-.0078r (2.88)(-.61) 2=.003;n=132 (t-values in parentheses) Jensen's a is computed for the sample of funds described in Table 1 for each of four three-year subperiods of data starting in 1976-1978.Each panel reports results from the cross-section regres sion of performance measures on prior performance measures.The first panel gives results from the regression of Jensen's a measures estimated on the basis of data for the period January 1979- December 1981 on similar measures estimated for the period January 1976-December 1978. This corresponds to the measure employed by Hendricks,Patel,and Zeckhauser (1991)with four quarter evaluation and holding periods.For each year starting in 1976,Jensen's a measures are computed.The deviation of these measures from their mean corresponds to a self financing port- folio,which is then applied to excess returns on funds measured for the subsequent year.The portfolio is updated at the end of each year.The regression reports results from the time-series regression of the resulting monthly excess returns on market excess returns.The intercept corre- sponds to a performance measure for this portfolio strategy. negative performance.This is most readily apparent in Table 1 when we observe that the row and column sums are specified ex post given the sample of money managers.In other words,given the row and column sums and the"winner-winner"cell count,the"loser-loser" count is simply the residual.Given the "loser-loser'count,the "win- ner-winner"is the residual.When we measure risk-adjusted perfor- mance relative to zero (Table 3),we find that persistence can just as easily relate to negative performance as it does to positive perfor- mance.Sometimes (1976-1981)good performance is rewarded by subsequent good performance."Hot hands"are evident.Sometimes (1982-1987)it is the case that bad performance is punished by further bad news.This result is also apparent examining the intercepts of the cross-section regressions reported in Table 2.Results reported in Table 4 indicate that the persistence of poor performance serves to explain some but not all of the results reported in the previous tables. This table gives regression-based measures of persistence excluding those managers who experienced negative average Jensen's a for the 5571