正在加载图片...
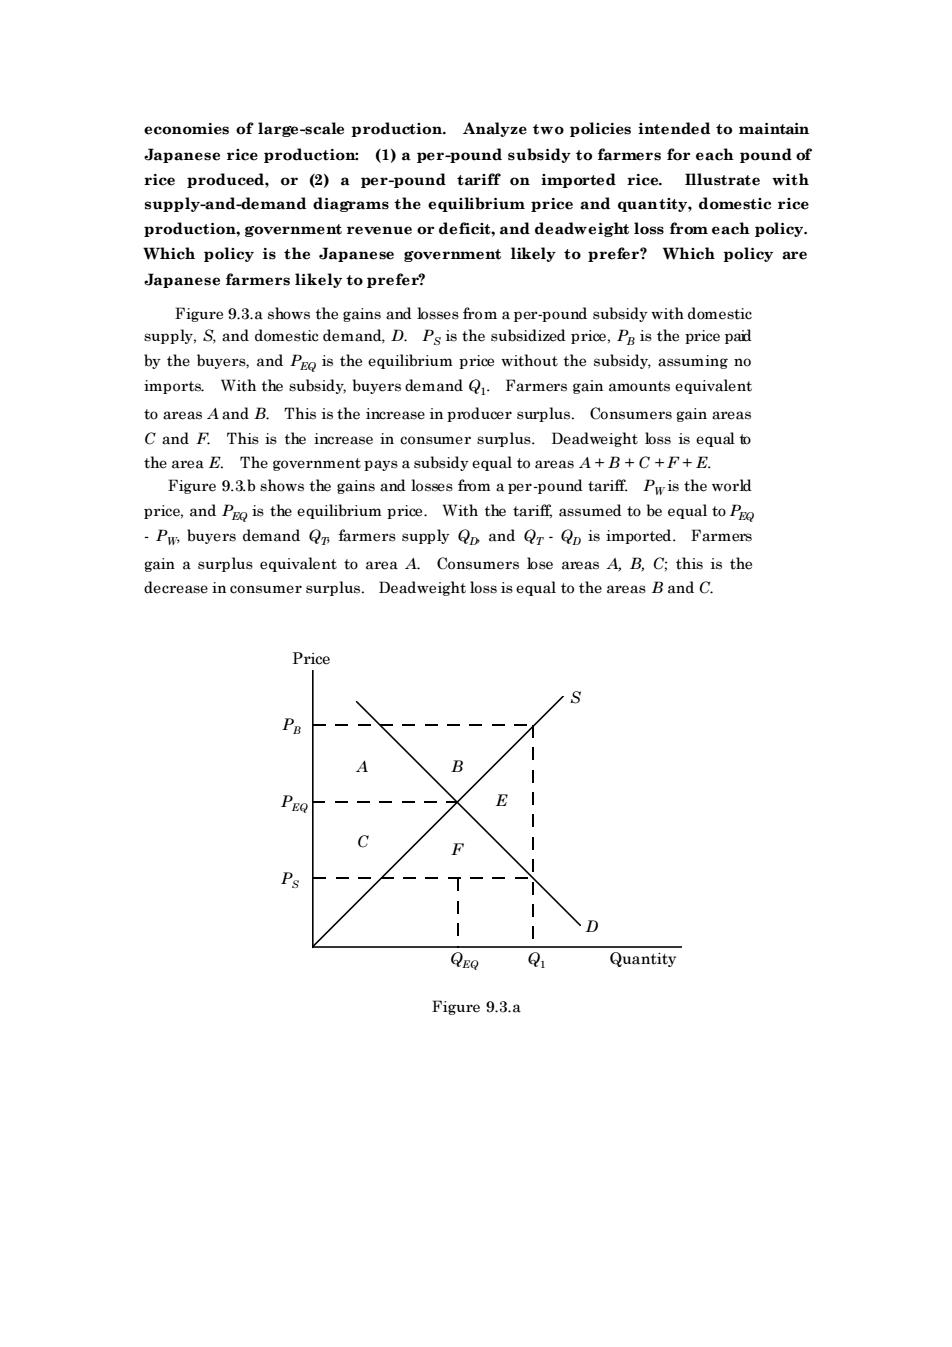
economies of large-scale production.Analyze two policies intended to maintain Japanese rice produetion (1)aper-pound subsidy tofarmers for ench pound of rice produced,or (2)a per-pound tariff on imported rice. supply-and-demand diagrams the equilibrium price and quantity,domestic rice production,government revenue or deficit,and deadweight loss from each policy. Which policy is the Japanese government likely to prefer?Which policy are Japanese farmers likely to prefer? nd domestie der by the buyers.a nd Pis the equilibrium prie without the subsidy,assumingno imports.With the subsidy,buyers demand Q.Farmers gain amounts equivalent to areas Aand B.This is the increase in producer surplus.Consumers gain areas Cand F This is the increase in consumer suplus. area +C+F+E equa Figure 9.3b sho ment pays ws the gainsand price,and Po is the equilibrium price.With the tariff,assumed to be equal toP Pu buyers demand Qn farmers supply Qp and Qr-Qp is imported.Farmers requivalont to area A.Consupers b areB C:thig is the er surplus. adw is equal to Band C Pri B D Quantity Figure 9.3.aeconomies of large-scale production. Analyze two policies intended to maintain Japanese rice production: (1) a per-pound subsidy to farmers for each pound of rice produced, or (2) a per-pound tariff on imported rice. Illustrate with supply-and-demand diagrams the equilibrium price and quantity, domestic rice production, government revenue or deficit, and deadweight loss from each policy. Which policy is the Japanese government likely to prefer? Which policy are Japanese farmers likely to prefer? Figure 9.3.a shows the gains and losses from a per-pound subsidy with domestic supply, S, and domestic demand, D. PS is the subsidized price, PB is the price paid by the buyers, and PEQ is the equilibrium price without the subsidy, assuming no imports. With the subsidy, buyers demand Q1 . Farmers gain amounts equivalent to areas A and B. This is the increase in producer surplus. Consumers gain areas C and F. This is the increase in consumer surplus. Deadweight loss is equal to the area E. The government pays a subsidy equal to areas A + B + C + F + E. Figure 9.3.b shows the gains and losses from a per-pound tariff. PW is the world price, and PEQ is the equilibrium price. With the tariff, assumed to be equal to PEQ - PW, buyers demand QT, farmers supply QD, and QT - QD is imported. Farmers gain a surplus equivalent to area A. Consumers lose areas A, B, C; this is the decrease in consumer surplus. Deadweight loss is equal to the areas B and C. Price Quantity S D PB PEQ PS A C B E F QEQ Q1 Figure 9.3.a