正在加载图片...

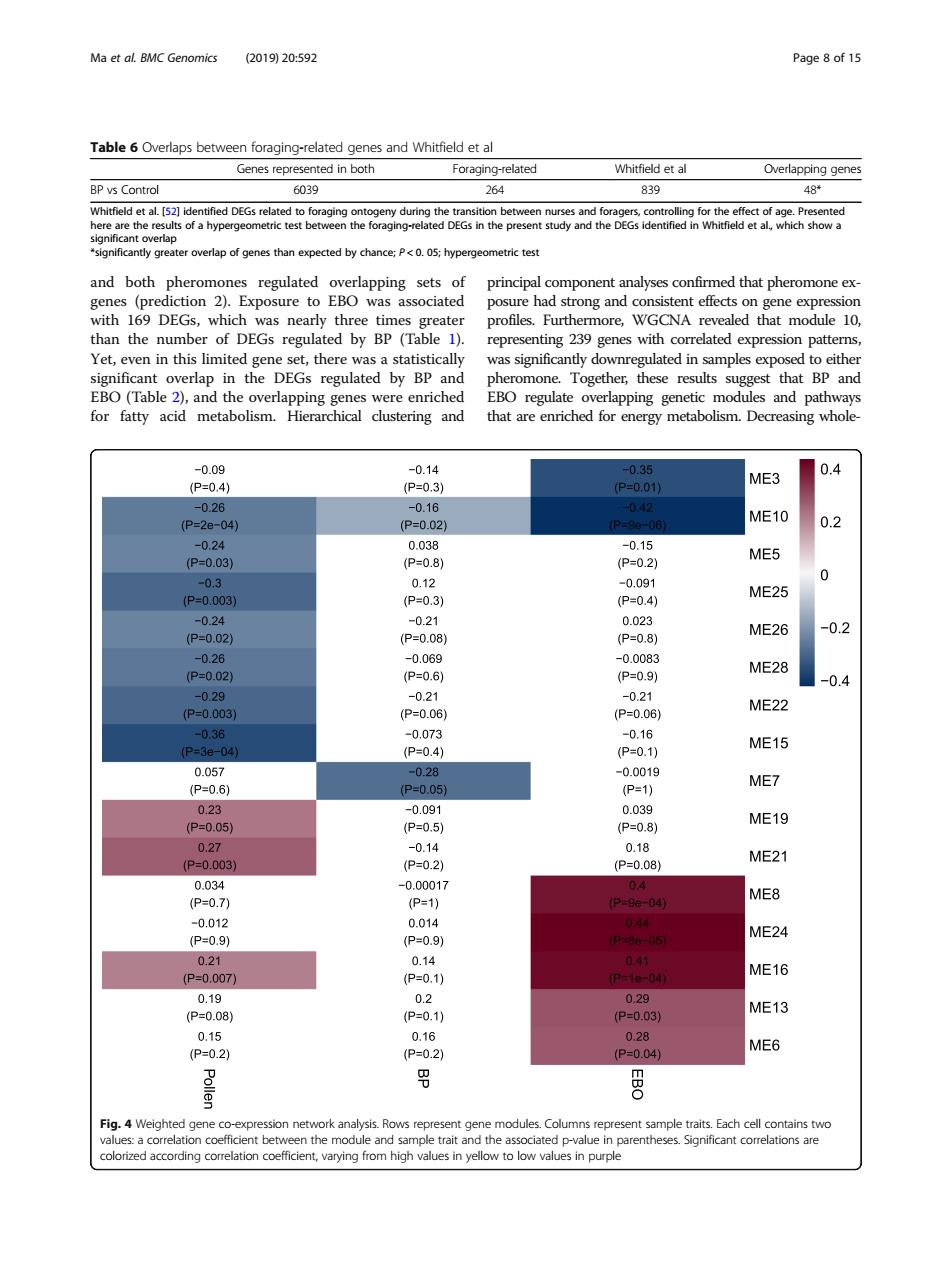
Ma et al BMC Genomics (201920:592 Table6Overlaps between foraging-related genes and Whitfield et al Genes represented in both Foraging-related BP vs Control 603g 839 tly gre than expected by and both phero sure had stron ene with 169 DEGs, which profiles.Furthe rmore,WGCNA revealed that module 10, than the numbe of DEGs epres 9 genes with cor expression patte rulated by BP an that RP a EBO(Table 2),and the overlapping genes were enriched EBO regulate overlapping genetic modules and pathways for fatty acid metabolism. Hierarchical clustering and that are enriched for energy metabolism.Decreasing whole 09 ME3 0.4 ME10 0.2 ME5 0 ME25 -0.2 ME28 ME22 P=04到 ME15 ME7 P-0.05 ME19 ME21 ME8 ME24 ME16 0.29 ME13 Fig.4 Weighted gene co t he colorized according correlation coefficient,varying from high values in yellow to low values in purpleand both pheromones regulated overlapping sets of genes (prediction 2). Exposure to EBO was associated with 169 DEGs, which was nearly three times greater than the number of DEGs regulated by BP (Table 1). Yet, even in this limited gene set, there was a statistically significant overlap in the DEGs regulated by BP and EBO (Table 2), and the overlapping genes were enriched for fatty acid metabolism. Hierarchical clustering and principal component analyses confirmed that pheromone exposure had strong and consistent effects on gene expression profiles. Furthermore, WGCNA revealed that module 10, representing 239 genes with correlated expression patterns, was significantly downregulated in samples exposed to either pheromone. Together, these results suggest that BP and EBO regulate overlapping genetic modules and pathways that are enriched for energy metabolism. Decreasing wholeTable 6 Overlaps between foraging-related genes and Whitfield et al Genes represented in both Foraging-related Whitfield et al Overlapping genes BP vs Control 6039 264 839 48* Whitfield et al. [52] identified DEGs related to foraging ontogeny during the transition between nurses and foragers, controlling for the effect of age. Presented here are the results of a hypergeometric test between the foraging-related DEGs in the present study and the DEGs identified in Whitfield et al., which show a significant overlap *significantly greater overlap of genes than expected by chance; P < 0. 05; hypergeometric test Fig. 4 Weighted gene co-expression network analysis. Rows represent gene modules. Columns represent sample traits. Each cell contains two values: a correlation coefficient between the module and sample trait and the associated p-value in parentheses. Significant correlations are colorized according correlation coefficient, varying from high values in yellow to low values in purple Ma et al. BMC Genomics (2019) 20:592 Page 8 of 15