正在加载图片...
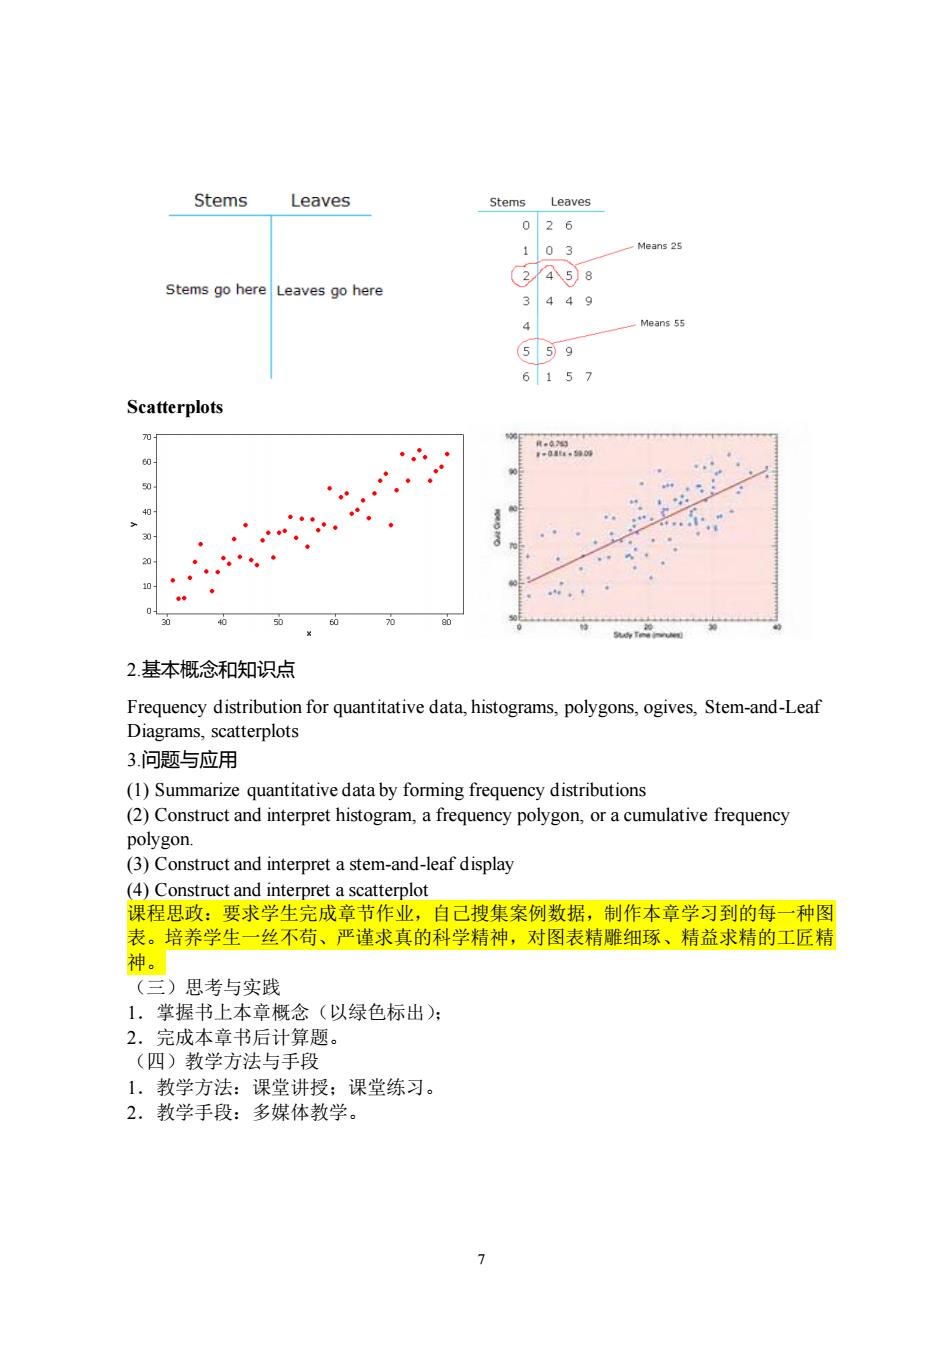
Stems Leaves Stems Leaves 026 103 Stems go hereLeaves go here 2258 3449 4 6157 Scatterplots 2.基本概念和知识点 Frequency distribution for quantitative data,histograms,polygons,ogives,Stem-and-Leaf Diagrams,scatterplots 3.问题与应用 (1)Summarize quantitative data by forming frequency distributions (2)Construct and interpret histogram,a frequency polygon,or a cumulative frequency tnditet (4)Construct and interpret a scatterplot 课程思政:要求学生完成章节作业,自己搜集案例数据,制作本章学习到的每一种图 表。培养学生一丝不苟、严谨求真的科学精神,对图表精雕细琢、精益求精的工匠精 神。 (三)思考与实践 1,掌握书上本章概念(以绿色标出): 2.完成本章书后计算题。 (四)教学方法与手段 1.教学方法:课堂讲授:课堂练习。 2.教学手段:多媒体教学。7 Scatterplots 2.基本概念和知识点 Frequency distribution for quantitative data, histograms, polygons, ogives, Stem-and-Leaf Diagrams, scatterplots 3.问题与应用 (1) Summarize quantitative data by forming frequency distributions (2) Construct and interpret histogram, a frequency polygon, or a cumulative frequency polygon. (3) Construct and interpret a stem-and-leaf display (4) Construct and interpret a scatterplot 课程思政:要求学生完成章节作业,自己搜集案例数据,制作本章学习到的每一种图 表。培养学生一丝不苟、严谨求真的科学精神,对图表精雕细琢、精益求精的工匠精 神。 (三)思考与实践 1.掌握书上本章概念(以绿色标出); 2.完成本章书后计算题。 (四)教学方法与手段 1.教学方法:课堂讲授;课堂练习。 2.教学手段:多媒体教学