《统计学(全英)》课程教学大纲 一、课程基本信息 课程代码:16166403 课程名称:统计学(全英) 英文名称:Statistics 课程类别:专业必修课 时:48 学分:3 适用对象:金融学中外联合培养项目 考核方式:考试 先修课程:高等数学 二、课程简介 今天的商科学生面临竞争激烈的全球化就业市场,这需要学生有很强的分析能 力。现在有大量的数据可供大家使用,但是,有数据和根据这些数据做出好的决策有 着很大的区别。这一代学生在未来将成为业务经理,因而将需要处理相关数据,识别 和实施正确的统计方法,最重要的是解释结果并将其纳入更大的决策问题。 统计学是数学的一个分支,用于检查处理和分析数据的方法。统计学恰好给商业 决策者提供了收集和转换数据的过程和方法。 本课程是一门理论和实用并重的课程,在讲解统计学的基本理论的同时,结合实 际的商业案例进行分析,并强调Excl软件在分析数据中的实用。 Today's business students face a highly competitive and global job market that will demand the most of their analytical abilities.Vast amounts of data are available to everyone.But there is a big difference between having data and making good decisions based on that data. This generation of future business managers will need to process relevant data,recognize and implement correct statistical methods,and most important,interpret the results and incorporate them into the larger decision problem. Statistics is a branch of mathematics that examines ways to process and analyze data. Statistics provides procedures to collect and transform data in ways that are useful to business decision-makers. This course is a theoretical and practical course,in the interpretation of the basic theory of statistics at the same time,combined with the actual business case analysis,and stressed the Excel software in the analysis of data in practical
1 《统计学(全英)》课程教学大纲 一、课程基本信息 课程代码:16166403 课程名称:统计学(全英) 英文名称:Statistics 课程类别:专业必修课 学 时:48 学 分:3 适用对象:金融学中外联合培养项目 考核方式:考试 先修课程:高等数学 二、课程简介 今天的商科学生面临竞争激烈的全球化就业市场,这需要学生有很强的分析能 力。现在有大量的数据可供大家使用,但是,有数据和根据这些数据做出好的决策有 着很大的区别。这一代学生在未来将成为业务经理,因而将需要处理相关数据,识别 和实施正确的统计方法,最重要的是解释结果并将其纳入更大的决策问题。 统计学是数学的一个分支,用于检查处理和分析数据的方法。统计学恰好给商业 决策者提供了收集和转换数据的过程和方法。 本课程是一门理论和实用并重的课程,在讲解统计学的基本理论的同时,结合实 际的商业案例进行分析,并强调 Excel 软件在分析数据中的实用。 Today’s business students face a highly competitive and global job market that will demand the most of their analytical abilities. Vast amounts of data are available to everyone. But there is a big difference between having data and making good decisions based on that data. This generation of future business managers will need to process relevant data, recognize and implement correct statistical methods, and most important, interpret the results and incorporate them into the larger decision problem. Statistics is a branch of mathematics that examines ways to process and analyze data. Statistics provides procedures to collect and transform data in ways that are useful to business decision-makers. This course is a theoretical and practical course, in the interpretation of the basic theory of statistics at the same time, combined with the actual business case analysis, and stressed the Excel software in the analysis of data in practical
三、课程性质与教学目的 本课程是一门全英课程,是专门针对金融实验班的本科学生开设的一门专业必修 课。 通过本课程的学习,首先,使学生对统计学的学科体系有一个全面的认识,为学 生进一步学习其它专业知识奠定学科基础,并使之具有较完备、合理的知识结构和实 践能力。其次,使学生能明确理解统计这个认识工具的特点、作用:弄懂各种概念 范畴等基本知识:掌握运用各种基本方法。再次,培养学生理论联系实际的能力,在 今后的实际工作和生活中,能将统计学的知识贯穿其中。最后,还要教会学生理论分 析,使他们能够分析社会经济现象的具体事例并能以报告的形式给出分析结果和合理 化建议。 四、教学内容及要求 Chapter 1 Statistics and Data (一)目的与要求 1.Describe the importance of statistics. 2.Differentiate between descriptive statistics and inferential statistics. 3.Explain the need for sampling and discuss various datatypes. 4.Descril 救学内容 ables and various types of measurement scales Opening Case:Covid-19 课程思政: 1.结合时事热点例如新冠病毒的防控讲解数据的搜集、整理、分析、描述的过程。开 展思改教育,让价值传受与价值领同共提,通过上术安例得知统计学能铭摆助 生准确判断新冠病毒疫情下的最有效的隔离时间,很大程度上阻止了病毒传播,守扮 了人民的健康 使学生 个人的专业发展与社会发展人民生活息息相关,每个人 都肩负着促进社会更好发展的使命。 2.许多的医学公众号每天为我们试试推送全国新增确诊疑似曲线图,疫情饼图等,直 观的展示疫情的发展态势,通过对新冠病毒的搜集、分析、判断、预测能够帮助我们 厘性对待疫情发展,避免过度恐慌,以平和的心态度过疫情。 .总结统计学的作用和学 统计学的意义,提升学生对课程的认同感,在心里层面上 激发学生对学习的热情和兴趣。 Section1.What is Statistics? 1.主要内容 Statistics is defined as the science of collecting.organizing.presenting.analyzing.and interpreting numerical data for the purpose of ass sting in making a more effective de Types of Statistics We generally divide the study of statistics into two branches:descriptive statistics and inferential statistics.Descriptive statistics refers to the summary of important aspects of a data set.This includes collecting data, senting the data in the forms of charts and tables.In addition,we often calculate numerical measures that 2
2 三、课程性质与教学目的 本课程是一门全英课程,是专门针对金融实验班的本科学生开设的一门专业必修 课。 通过本课程的学习,首先,使学生对统计学的学科体系有一个全面的认识,为学 生进一步学习其它专业知识奠定学科基础,并使之具有较完备、合理的知识结构和实 践能力。其次,使学生能明确理解统计这个认识工具的特点、作用;弄懂各种概念、 范畴等基本知识;掌握运用各种基本方法。再次,培养学生理论联系实际的能力,在 今后的实际工作和生活中,能将统计学的知识贯穿其中。最后,还要教会学生理论分 析,使他们能够分析社会经济现象的具体事例并能以报告的形式给出分析结果和合理 化建议。 四、教学内容及要求 Chapter 1 Statistics and Data (一)目的与要求 1. Describe the importance of statistics. 2. Differentiate between descriptive statistics and inferential statistics. 3. Explain the need for sampling and discuss various data types. 4. Describe variables and various types of measurement scales. (二)教学内容 Opening Case: Covid-19 课程思政: 1.结合时事热点例如新冠病毒的防控讲解数据的搜集、整理、分析、描述的过程。开 展思政教育,让价值传授与价值引领同频共振,通过上述案例得知统计学能够帮助医 生准确判断新冠病毒疫情下的最有效的隔离时间,很大程度上阻止了病毒传播,守护 了人民的健康,使学生体会到个人的专业发展与社会发展人民生活息息相关,每个人 都肩负着促进社会更好发展的使命。 2.许多的医学公众号每天为我们试试推送全国新增确诊/疑似曲线图,疫情饼图等,直 观的展示疫情的发展态势,通过对新冠病毒的搜集、分析、判断、预测能够帮助我们 理性对待疫情发展,避免过度恐慌,以平和的心态度过疫情。 3.总结统计学的作用和学习统计学的意义,提升学生对课程的认同感,在心里层面上 激发学生对学习的热情和兴趣。 Section1. What is Statistics? 1.主要内容 Statistics is defined as the science of collecting, organizing, presenting, analyzing, and interpreting numerical data for the purpose of assisting in making a more effective decision. Types of Statistics We generally divide the study of statistics into two branches: descriptive statistics and inferential statistics. Descriptive statistics refers to the summary of important aspects of a data set. This includes collecting data, organizing the data, and then presenting the data in the forms of charts and tables. In addition, we often calculate numerical measures that
summarize,for instance,the data's typical value and the data's variability.Today,the techniques encountered in descriptive statistics account for the most visible application of statistics the abundance of quantitative information that is collected and published in our ery day.The unemployment rate. the Pre Industrial Average,batting averages,the crime rate,and the divorce rate are but a few of the many "statistics"that can be found in a reputable newspaper on a frequent,if not daily, basis.Yet,despite the familiarity of descriptive statistics,these methods represent only a minor portion of the body of statistical applications The Need for Sampling Types of Variables A variable is the general characteristic being observed on a set of people, vents where each observation varies in kind or degree.Values corresponding to a qualitative variable are typically expressed in words but may be coded into numbers later on for purposes of data processing.A quantitative variable assumes meaningful numerical take son individually distinct values,wher e a an take on any value within an interval 2.基本概念和知识点 atistic ,infe uive variable. screte variable,continuous variabl 3问题与应用 (1)Describe the importance of statistics (2)Differentiate between descriptive statistics and inferential statistics. (3)Explain the need for sampling and discuss various data types. Section2.Variables and Scales of Measurement 1.主要内容 The Nominal Scale:represents the least sophisticated level of measurement,we can categorize or group the data The Ordinal Scale:categorize and rank the data with respect to some characteristic or trait The interva ale:assure that the differences between scale values are equal The Ratio Scale:a true zero point as the origin 2基本概念和知识点 The Nominal Scale,The Ordinal Scale,The interval Scale,The Ratio Scale 3.问题与应用 (1)Describe variables and various types of measurement scales Section3.Types of Sampling Methods 1.主要内容
3 summarize, for instance, the data’s typical value and the data’s variability. Today, the techniques encountered in descriptive statistics account for the most visible application of statistics—the abundance of quantitative information that is collected and published in our society every day. The unemployment rate, the President’s approval rating, the Dow Jones Industrial Average, batting averages, the crime rate, and the divorce rate are but a few of the many “statistics” that can be found in a reputable newspaper on a frequent, if not daily, basis. Yet, despite the familiarity of descriptive statistics, these methods represent only a minor portion of the body of statistical applications. The Need for Sampling Types of Variables A variable is the general characteristic being observed on a set of people, objects, or events, where each observation varies in kind or degree. Values corresponding to a qualitative variable are typically expressed in words but may be coded into numbers later on for purposes of data processing. A quantitative variable assumes meaningful numerical values, and can be further categorized as either discrete or continuous. A discrete variable takes on individually distinct values, whereas a continuous variable can take on any value within an interval. 2.基本概念和知识点 Statistics, descriptive statistics, inferential statistics, sample, population, qualitative variable, quantitative variable, discrete variable, continuous variable 3.问题与应用 (1) Describe the importance of statistics. (2) Differentiate between descriptive statistics and inferential statistics. (3) Explain the need for sampling and discuss various data types. Section2. Variables and Scales of Measurement 1.主要内容 The Nominal Scale: represents the least sophisticated level of measurement, we can categorize or group the data The Ordinal Scale: categorize and rank the data with respect to some characteristic or trait The interval Scale: assure that the differences between scale values are equal The Ratio Scale: a true zero point as the origin 2.基本概念和知识点 The Nominal Scale, The Ordinal Scale, The interval Scale, The Ratio Scale 3.问题与应用 (1) Describe variables and various types of measurement scales. Section3. Types of Sampling Methods 1.主要内容
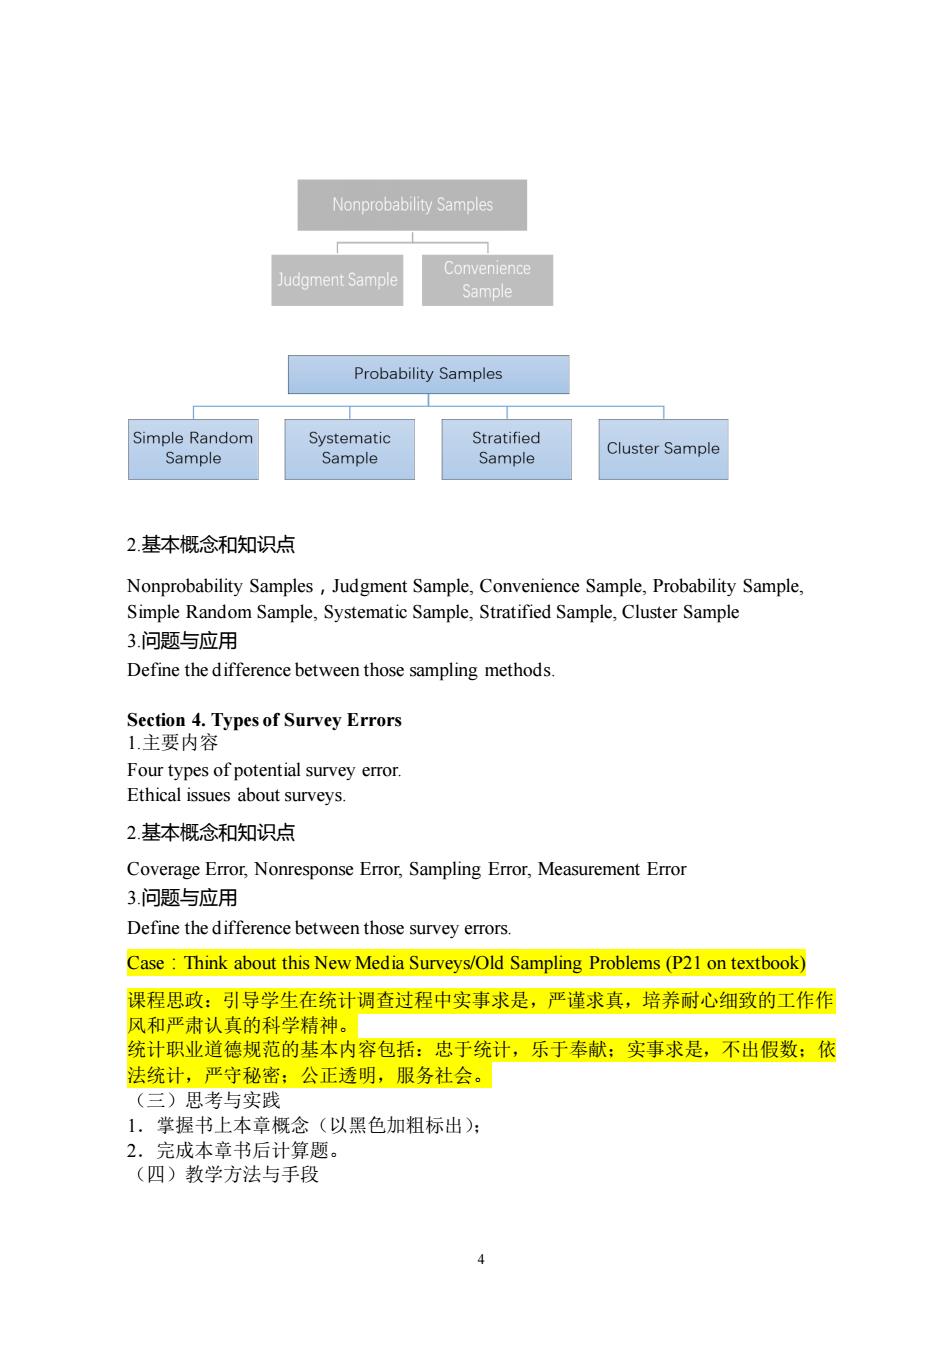
Nonprobability Samples dgment Sample Convenience ample Probability Samples Simple Random Systematic Stratified Sample Sample Sample Cluster Sample 2基本概念和知识点 Nonprobability Samples,Judgment Sample,Convenience Sample,Probability Sample. Simple Random Sample,Systematic Sample,Stratified Sample,Cluster Sample 3.问题与应用 Define the difference between those sampling methods Section 4.Types of Survey Errors 1.主要内容 Four types of potential survey error Ethical issues about surveys. 2.基本概念和知识点 Coverage Error,Nonresponse Error,Sampling Error,Measurement Error 3.问题与应用 Define the difference between those survey errors. Case:Think about this New Media Surveys/Old Sampling Problems (P21 on textbook) 课程思政:引导学生在统计调查过程中实事求是,严谨求真,培养耐心细致的工作作 风和严肃认真的 字精神。 统计职业道德规范的基本内容包括:忠于统计,乐于奉献:实事求是,不出假数:依 法统计,严守秘密:公正透明,服务社会。 (三)思考与实践 四 (四)教学方法与手段
4 2.基本概念和知识点 Nonprobability Samples,Judgment Sample, Convenience Sample, Probability Sample, Simple Random Sample, Systematic Sample, Stratified Sample, Cluster Sample 3.问题与应用 Define the difference between those sampling methods. Section 4. Types of Survey Errors 1.主要内容 Four types of potential survey error. Ethical issues about surveys. 2.基本概念和知识点 Coverage Error, Nonresponse Error, Sampling Error, Measurement Error 3.问题与应用 Define the difference between those survey errors. Case:Think about this New Media Surveys/Old Sampling Problems (P21 on textbook) 课程思政:引导学生在统计调查过程中实事求是,严谨求真,培养耐心细致的工作作 风和严肃认真的科学精神。 统计职业道德规范的基本内容包括:忠于统计,乐于奉献;实事求是,不出假数;依 法统计,严守秘密;公正透明,服务社会。 (三)思考与实践 1.掌握书上本章概念(以黑色加粗标出); 2.完成本章书后计算题。 (四)教学方法与手段
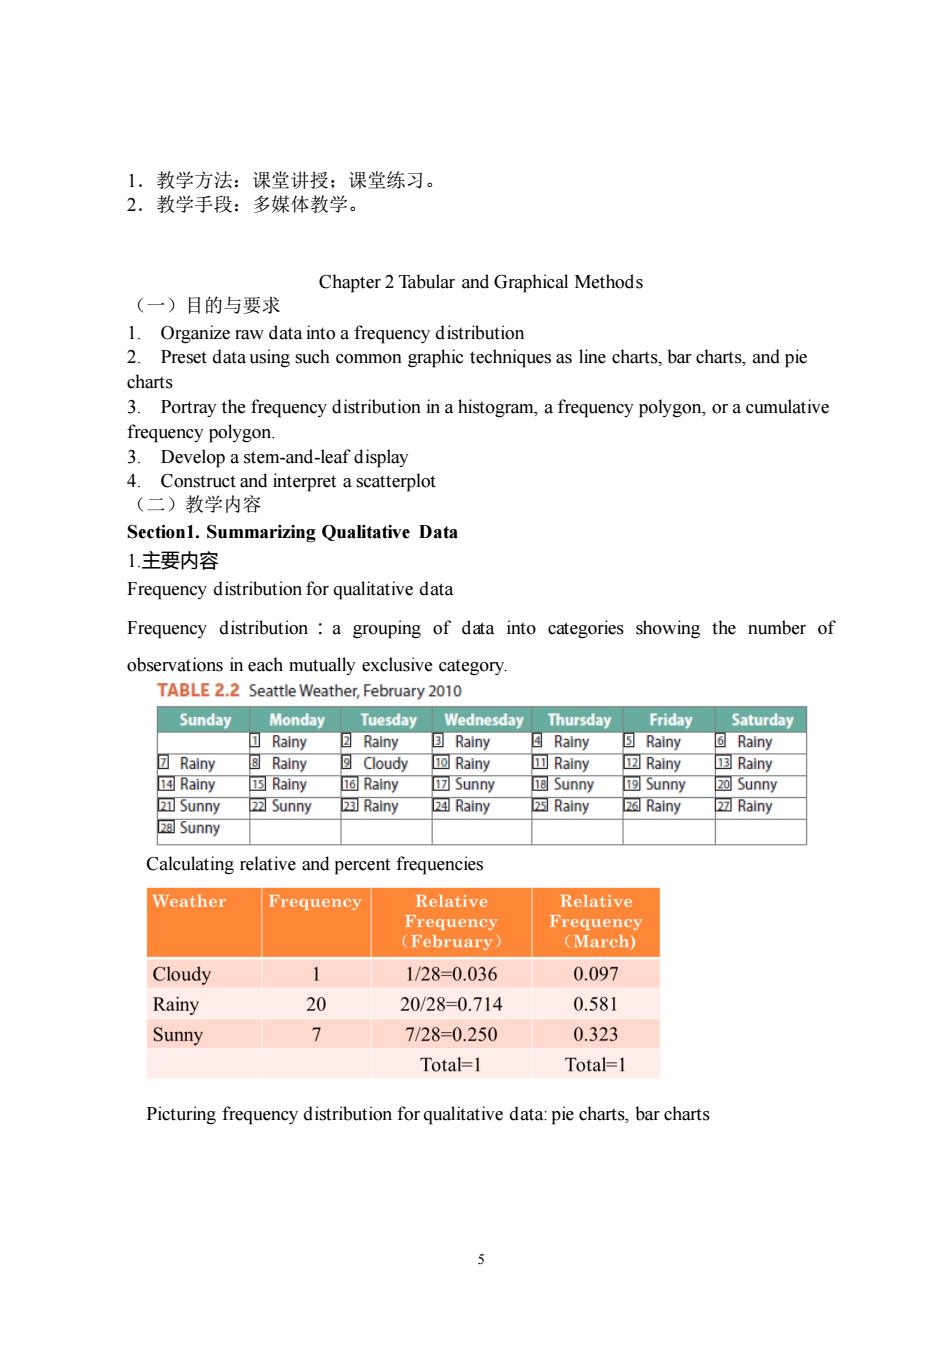
1,教学方法:课堂讲授:课堂练习。 2.教学手段:多媒体教学。 Chapter 2 Tabular and Graphical Methods (一)目的与要求 1.Organize raw data into a frequency distribution 2.Preset data using such common graphic techniques as line charts,bar charts,and pie charts 3. Portray the frequency distribution in a histogram,a frequency polygon,ora cumulative frequency polygon. 3.Develop a stem-and-leaf display 4.Construct and interpret a scatterplot (二)教学内容 Section1.Summarizing Qualitative Data 1.主要内容 Frequency distribution for qualitative data Frequency distribution a grouping of data into categories showing the number of observations in each mutually exclusive category TABLE 2.2 Seattle Weathe ay2010 Sunday Monday hursday Friday Saturday Rainy Rainy Rainy Rainy Rainy Rainy Cloudy回Rainy Rainy Rainy Rainy 2 Sunny Rainy Rainy Rainy Rainy Sunn Calculating relative and percent frequencies Weather Frequeney Relative Relative Cloudy 1/28-0.036 0.097 Rainy 20 20/28-0.714 0.581 Sunny 7/28-0.250 0.323 Total=1 Total=1 Picturing frequency distribution for qualitative data:pie charts,bar charts
5 1.教学方法:课堂讲授;课堂练习。 2.教学手段:多媒体教学。 Chapter 2 Tabular and Graphical Methods (一)目的与要求 1. Organize raw data into a frequency distribution 2. Preset data using such common graphic techniques as line charts, bar charts, and pie charts 3. Portray the frequency distribution in a histogram, a frequency polygon, or a cumulative frequency polygon. 3. Develop a stem-and-leaf display 4. Construct and interpret a scatterplot (二)教学内容 Section1. Summarizing Qualitative Data 1.主要内容 Frequency distribution for qualitative data Frequency distribution:a grouping of data into categories showing the number of observations in each mutually exclusive category. Calculating relative and percent frequencies Picturing frequency distribution for qualitative data: pie charts, bar charts
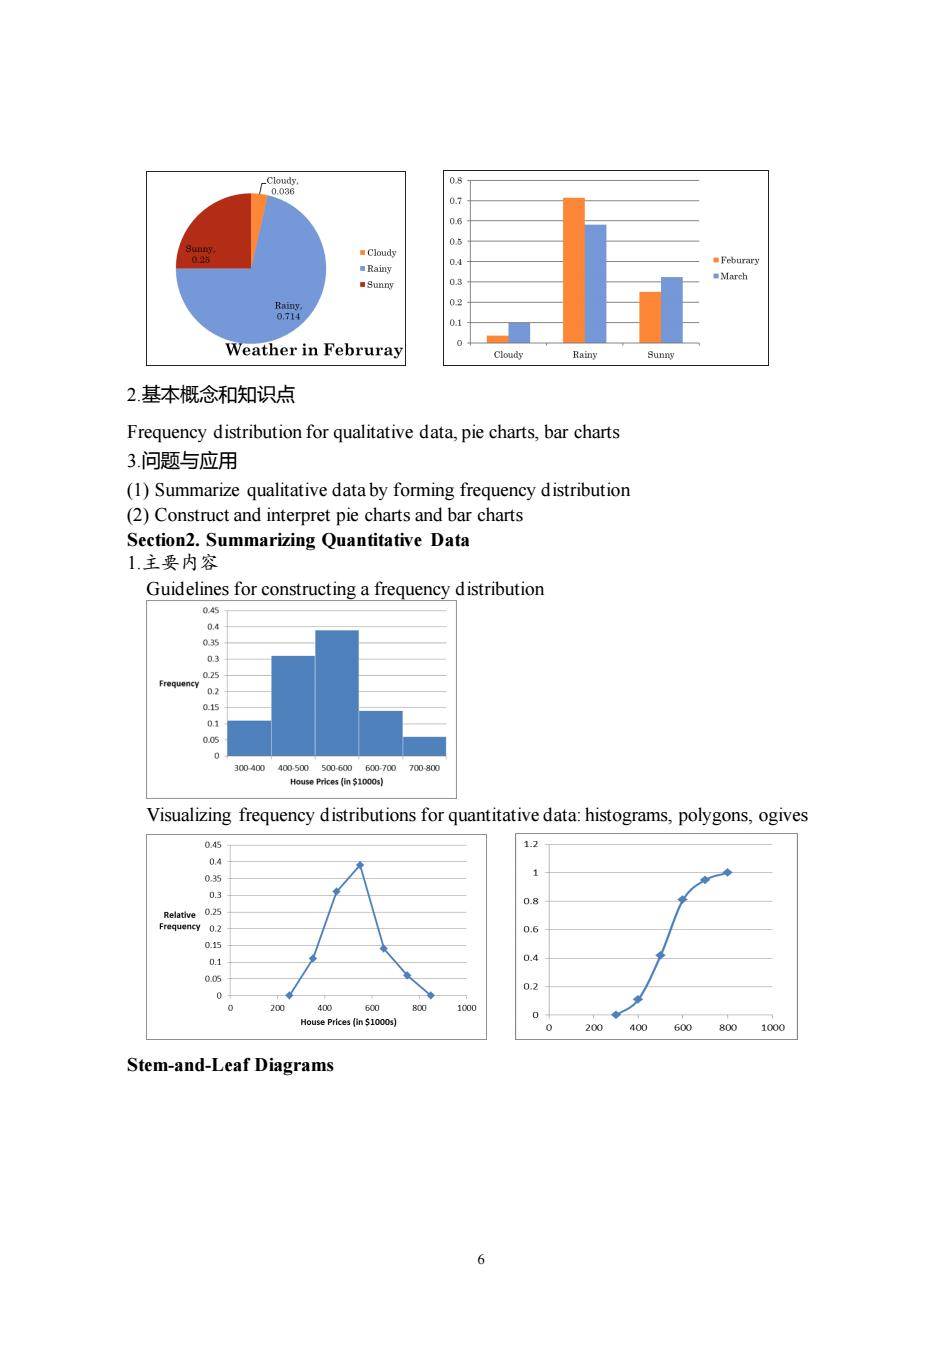
Weather in Februray 2.基本概念和知识点 Frequency distribution for qualitative data,pie charts,bar charts 3.问题与应用 (1)Summarize qualitative data by forming frequency distribution (2)Construct and interpret pie charts and bar charts Section2.Summarizing Quantitative Data 1.主要内容 Guidelines for constructing a frequency distribution Visualizing frequency distributions for quantitative data:histograms,polygons,ogives 1.2 1 01 200 40 600 800 Stem-and-Leaf Diagrams 6
6 2.基本概念和知识点 Frequency distribution for qualitative data, pie charts, bar charts 3.问题与应用 (1) Summarize qualitative data by forming frequency distribution (2) Construct and interpret pie charts and bar charts Section2. Summarizing Quantitative Data 1.主要内容 Guidelines for constructing a frequency distribution Visualizing frequency distributions for quantitative data: histograms, polygons, ogives Stem-and-Leaf Diagrams
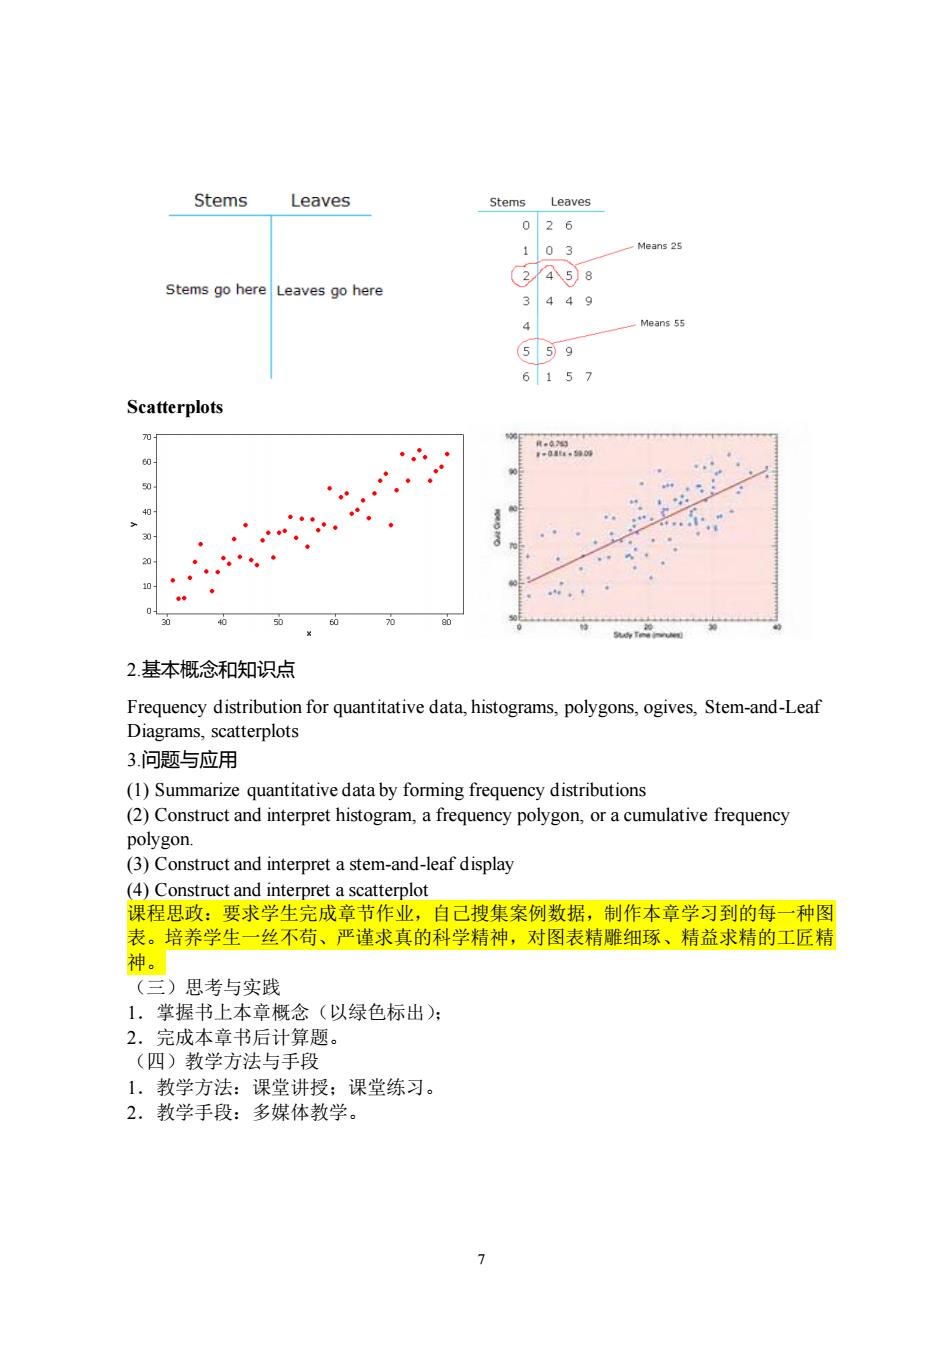
Stems Leaves Stems Leaves 026 103 Stems go hereLeaves go here 2258 3449 4 6157 Scatterplots 2.基本概念和知识点 Frequency distribution for quantitative data,histograms,polygons,ogives,Stem-and-Leaf Diagrams,scatterplots 3.问题与应用 (1)Summarize quantitative data by forming frequency distributions (2)Construct and interpret histogram,a frequency polygon,or a cumulative frequency tnditet (4)Construct and interpret a scatterplot 课程思政:要求学生完成章节作业,自己搜集案例数据,制作本章学习到的每一种图 表。培养学生一丝不苟、严谨求真的科学精神,对图表精雕细琢、精益求精的工匠精 神。 (三)思考与实践 1,掌握书上本章概念(以绿色标出): 2.完成本章书后计算题。 (四)教学方法与手段 1.教学方法:课堂讲授:课堂练习。 2.教学手段:多媒体教学
7 Scatterplots 2.基本概念和知识点 Frequency distribution for quantitative data, histograms, polygons, ogives, Stem-and-Leaf Diagrams, scatterplots 3.问题与应用 (1) Summarize quantitative data by forming frequency distributions (2) Construct and interpret histogram, a frequency polygon, or a cumulative frequency polygon. (3) Construct and interpret a stem-and-leaf display (4) Construct and interpret a scatterplot 课程思政:要求学生完成章节作业,自己搜集案例数据,制作本章学习到的每一种图 表。培养学生一丝不苟、严谨求真的科学精神,对图表精雕细琢、精益求精的工匠精 神。 (三)思考与实践 1.掌握书上本章概念(以绿色标出); 2.完成本章书后计算题。 (四)教学方法与手段 1.教学方法:课堂讲授;课堂练习。 2.教学手段:多媒体教学
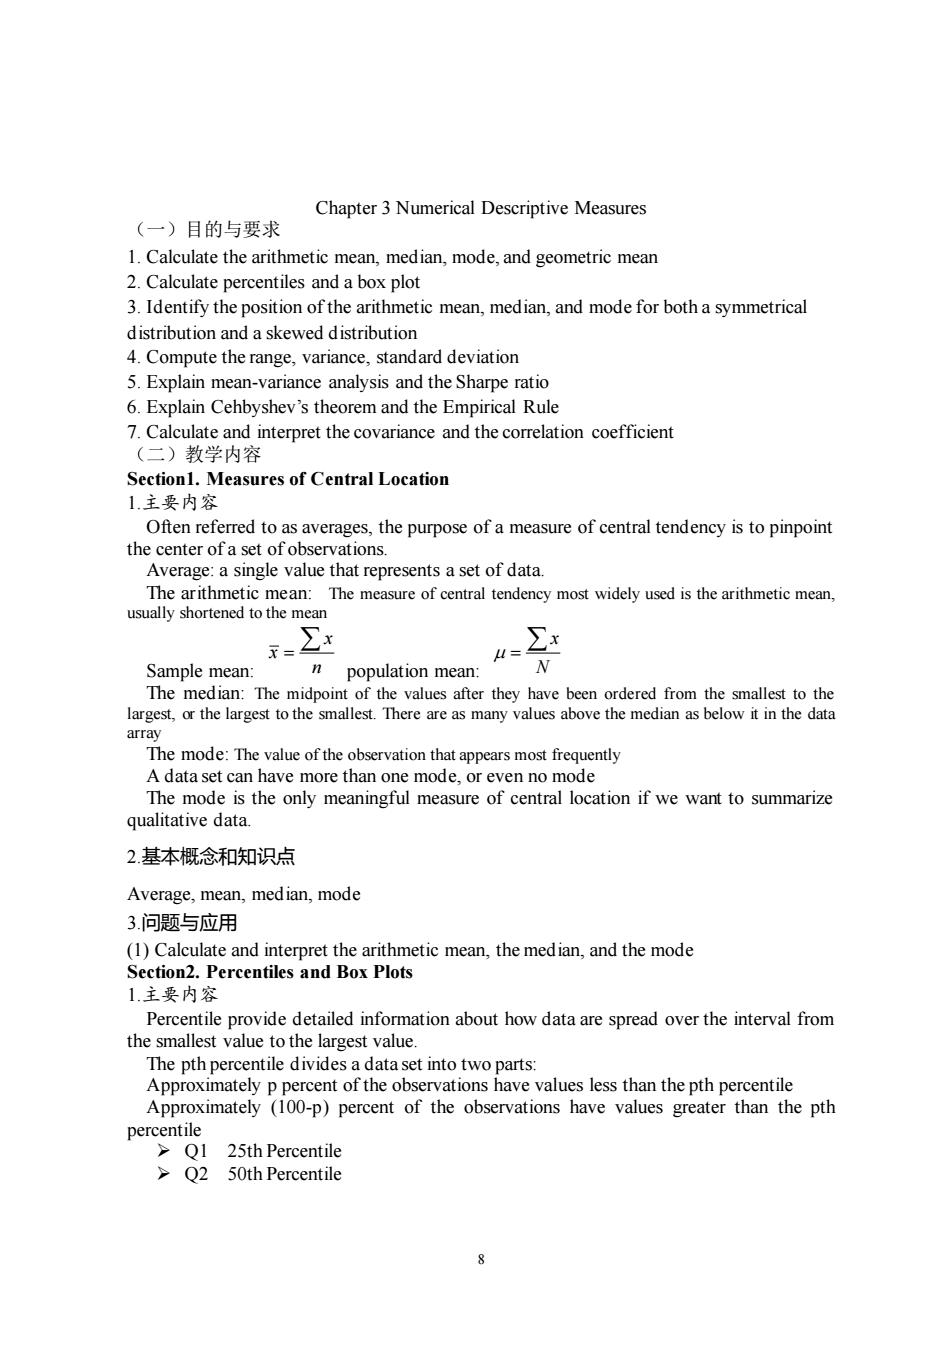
Chapter 3 Numerical Descriptive Measures (一)目的与要求 1.Calculate the arithmetic mean,median,mode,and geometric mean 2.Calculate percentils and a bx plo 3.Identify the position of the arithmetic mean,median,and mode for both a symmetrical distribution and a skewed distribution 4.Compute the range.variance.standard deviation 5.Explain mean-variance analysis and the Sharpe ratio 6.Explain Cehbyshev's the orem and the Empirical Rule Calculate and interpret the covariance and the correlation coefficient (二)教学内容 Section1.Measures of Central Location 1.主要内容 Often referred to as averages,the purpose of a measure of central tendency is to pinpoint the center of a set of observations. Average:a single value that represents a set of data. The measure of central tendency most widely used is the arithmetic mean. 1 population mean The midpoir lar The mode:The value of the observation that appears most frequently A data set can have more than one mode,or even no mode uthe ony mfl of cifwe 2.基本概念和知识点 Average,mean,median,mode 3.问题与应用 (1)Calculate and interpret the arithmetic mean,the median,and the mode Section2.Percentiles and Box Plots 1主要内容 Percentile provide detailed information about how data are spread over the interval from the smallest value to the largest value. The pth percentile divides a data set into two parts: Approximately p percent of the observations have values less than the pth percentile Approximately (100-p)percent of the observations have values greater than the pth Q2 50th Percentile
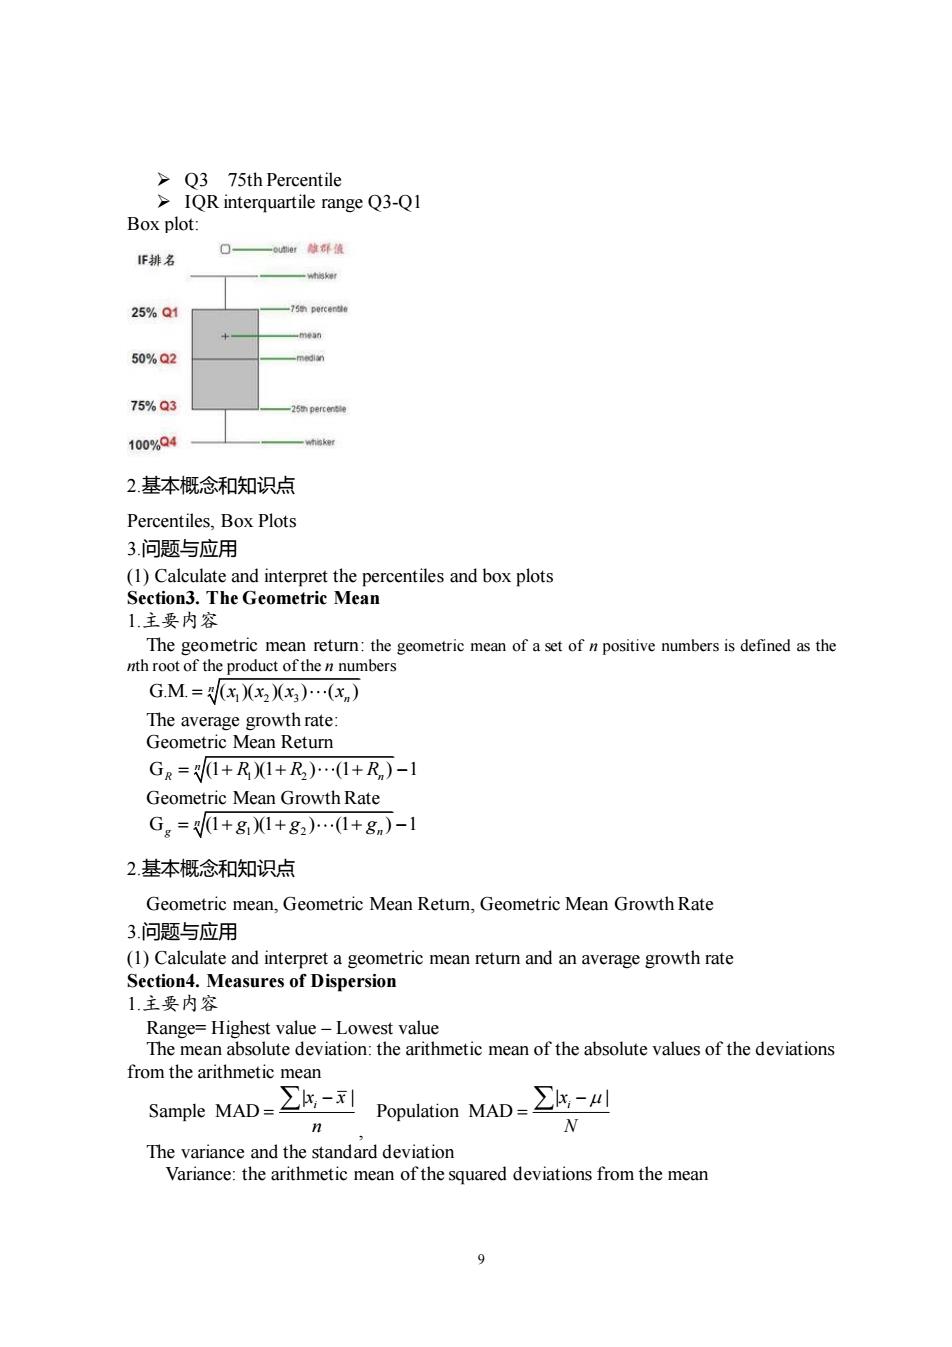
8 Chapter 3 Numerical Descriptive Measures (一)目的与要求 1. Calculate the arithmetic mean, median, mode, and geometric mean 2. Calculate percentiles and a box plot 3. Identify the position of the arithmetic mean, median, and mode for both a symmetrical distribution and a skewed distribution 4. Compute the range, variance, standard deviation 5. Explain mean-variance analysis and the Sharpe ratio 6. Explain Cehbyshev’s theorem and the Empirical Rule 7. Calculate and interpret the covariance and the correlation coefficient (二)教学内容 Section1. Measures of Central Location 1.主要内容 Often referred to as averages, the purpose of a measure of central tendency is to pinpoint the center of a set of observations. Average: a single value that represents a set of data. The arithmetic mean: The measure of central tendency most widely used is the arithmetic mean, usually shortened to the mean Sample mean: x x n = population mean: x N = The median: The midpoint of the values after they have been ordered from the smallest to the largest, or the largest to the smallest. There are as many values above the median as below it in the data array The mode: The value of the observation that appears most frequently A data set can have more than one mode, or even no mode The mode is the only meaningful measure of central location if we want to summarize qualitative data. 2.基本概念和知识点 Average, mean, median, mode 3.问题与应用 (1) Calculate and interpret the arithmetic mean, the median, and the mode Section2. Percentiles and Box Plots 1.主要内容 Percentile provide detailed information about how data are spread over the interval from the smallest value to the largest value. The pth percentile divides a data set into two parts: Approximately p percent of the observations have values less than the pth percentile Approximately (100-p) percent of the observations have values greater than the pth percentile ➢ Q1 25th Percentile ➢ Q2 50th Percentile
75th Percentile IQR interquartile range Q3-Q1 Box plot F排名 25%Q1 50%Q2 75%Q3 100%Q4 2.基本概念和知识点 Percentiles,Box Plots 3.问题与应用 (1)Calculate 1主要内容 The G.M.=)) The average growth rate. Geometric Mean Return Ge=1+R1+R)(1+R,)-1 Geometric Mean Growth Rate G=1+g1+g,).(1+g)-1 2基本概念和知识点 Geometric mean,Geometric Mean Retum,Geometric Mean Growth Rate 3.问题与应用 (1)Calculate and interpret a geometric mean return and an average growth rate Section4.Measures of Dispersion 1.主要内容 Range=Highest value-Lowest value The mean absolute deviation:the arithmetic mean of the absolute values of the deviations from the arithmetic mean Sample MAD=∑E-Population MAD=∑K-L The variance and the standard deviation Variance:the arithmetic mean ofthe squared deviations from the mean
9 ➢ Q3 75th Percentile ➢ IQR interquartile range Q3-Q1 Box plot: 2.基本概念和知识点 Percentiles, Box Plots 3.问题与应用 (1) Calculate and interpret the percentiles and box plots Section3. The Geometric Mean 1.主要内容 The geometric mean return: the geometric mean of a set of n positive numbers is defined as the nth root of the product of the n numbers G.M. ( )( )( ) ( ) 1 2 3 n n = x x x x The average growth rate: Geometric Mean Return G (1 )(1 ) (1 ) 1 1 2 n R n = + + + − R R R Geometric Mean Growth Rate G (1 )(1 ) (1 ) 1 1 2 n g n = + + + − g g g 2.基本概念和知识点 Geometric mean, Geometric Mean Return, Geometric Mean Growth Rate 3.问题与应用 (1) Calculate and interpret a geometric mean return and an average growth rate Section4. Measures of Dispersion 1.主要内容 Range= Highest value – Lowest value The mean absolute deviation: the arithmetic mean of the absolute values of the deviations from the arithmetic mean | | Sample MAD i x x n − = , | | Population MAD i x N − = The variance and the standard deviation Variance: the arithmetic mean of the squared deviations from the mean

Sample CV=5 Population CV= 2.基本概念和知识点 Range,MAD,variance,standard deviation,the coefficient of variance 3.问题与应用 (1)Calculate and interpret the ean-Variance Analy 1.主要内容 Mean-Variance analysis:In some instances,analysis entails comparing two or more data sets that have different means or units of measurement.The coefficient of variation(CV) serves as arelative measure of dispersion and adjusts for differences in the magnitudes of the mean Calculated by dividing a data set's standard deviation by its mean,CV is a unitless measure that allows fordirect comparisons of mean-adjusted dispersion across different data sets. Sample CV Population CV= Sharpe ratio:the extra reward per unit of risk X-R 2.基本概念和知识点 Mean-Variance analysis,Sharpe ratio 3问题与应用 (1)Explain Mean-Varian alysis and the sha Sectio.ChebysheTheorem and the Empirical Rule 1主要内容 Chebyshev'sTheorem As we will see in more detail in later chapters,it is important to be able to use the standard deviation to make statements about the proportion of observations that fall within certain intervals.Fortunately,a Russian mathematician Pavroty Chebyshev(1821-1894)found bounds for the proportion of the data that lie within a specified number of standard deviations from the mean (apply to all data sets) For any set of observations (sample or population),the minimum proportion of the values that lie within k standard deviations of the mean is at least 1-1/k2,where k is any constant 10
10 Standard deviation: the square root of the variance The coefficient of variance Sample CV s x = , Population CV = 2.基本概念和知识点 Range, MAD, variance, standard deviation, the coefficient of variance 3.问题与应用 (1) Calculate and interpret the range, MAD, variance, standard deviation Section5. Mean-Variance Analysis and the Sharpe Ratio 1.主要内容 Mean-Variance analysis: In some instances, analysis entails comparing two or more data sets that have different means or units of measurement. The coefficient of variation ( CV) serves as a relative measure of dispersion and adjusts for differences in the magnitudes of the means. Calculated by dividing a data set’s standard deviation by its mean, CV is a unitless measure that allows for direct comparisons of mean-adjusted dispersion across different data sets. Sample CV s x = Population CV = Sharpe ratio: the extra reward per unit of risk I f I x R s − 2.基本概念和知识点 Mean-Variance analysis, Sharpe ratio 3.问题与应用 (1) Explain Mean-Variance analysis and the Sharpe ratio Section6. Chebyshev’s Theorem and the Empirical Rule 1.主要内容 Chebyshev’s Theorem As we will see in more detail in later chapters, it is important to be able to use the standard deviation to make statements about the proportion of observations that fall within certain intervals. Fortunately, a Russian mathematician Pavroty Chebyshev (1821–1894) found bounds for the proportion of the data that lie within a specified number of standard deviations from the mean. (apply to all data sets) For any set of observations (sample or population), the minimum proportion of the values that lie within k standard deviations of the mean is at least 1-1/k2 , where k is any constant