正在加载图片...

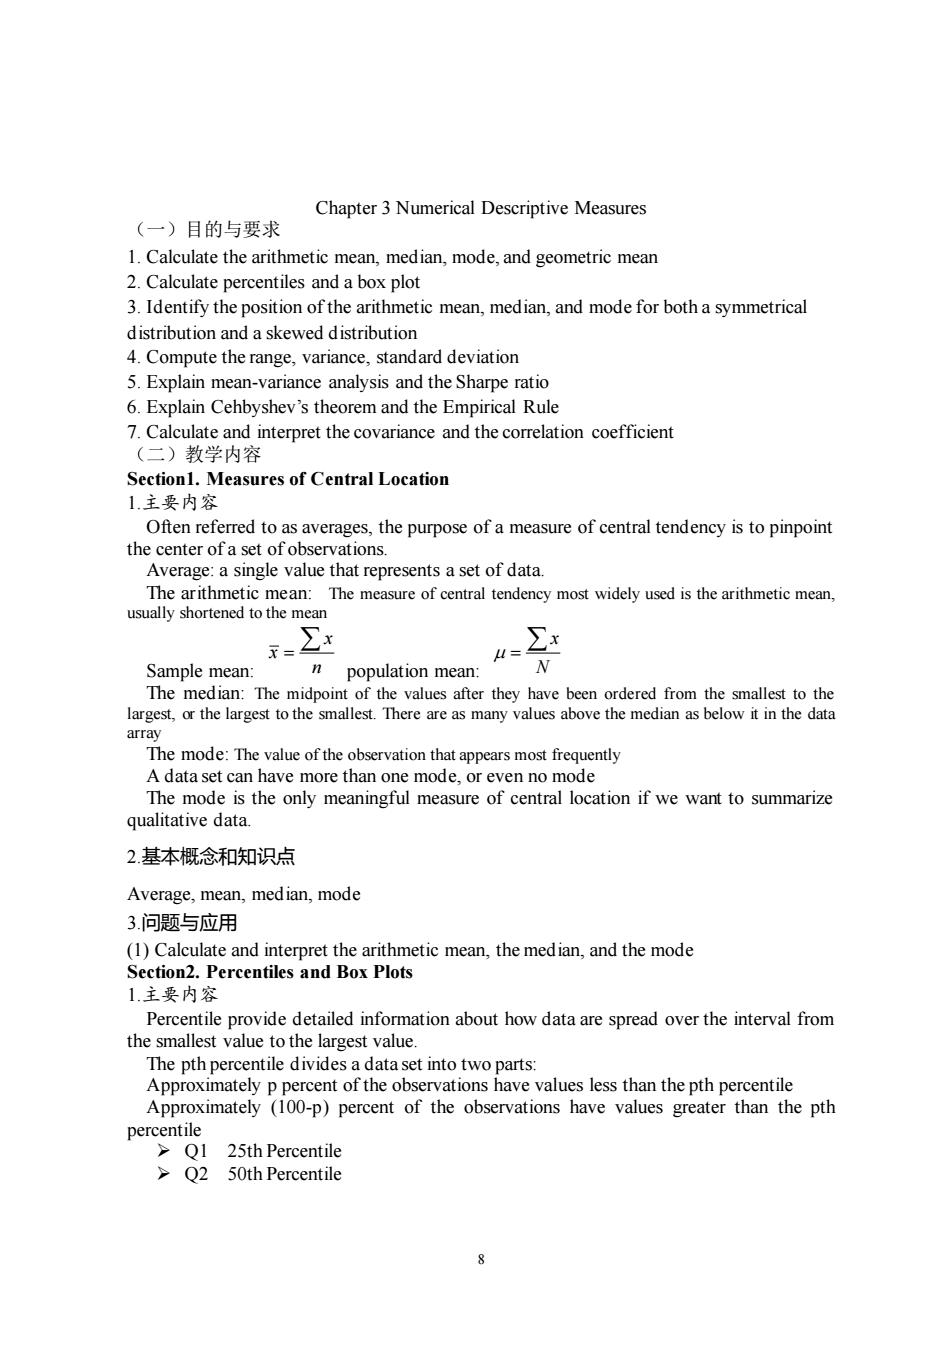
Chapter 3 Numerical Descriptive Measures (一)目的与要求 1.Calculate the arithmetic mean,median,mode,and geometric mean 2.Calculate percentils and a bx plo 3.Identify the position of the arithmetic mean,median,and mode for both a symmetrical distribution and a skewed distribution 4.Compute the range.variance.standard deviation 5.Explain mean-variance analysis and the Sharpe ratio 6.Explain Cehbyshev's the orem and the Empirical Rule Calculate and interpret the covariance and the correlation coefficient (二)教学内容 Section1.Measures of Central Location 1.主要内容 Often referred to as averages,the purpose of a measure of central tendency is to pinpoint the center of a set of observations. Average:a single value that represents a set of data. The measure of central tendency most widely used is the arithmetic mean. 1 population mean The midpoir lar The mode:The value of the observation that appears most frequently A data set can have more than one mode,or even no mode uthe ony mfl of cifwe 2.基本概念和知识点 Average,mean,median,mode 3.问题与应用 (1)Calculate and interpret the arithmetic mean,the median,and the mode Section2.Percentiles and Box Plots 1主要内容 Percentile provide detailed information about how data are spread over the interval from the smallest value to the largest value. The pth percentile divides a data set into two parts: Approximately p percent of the observations have values less than the pth percentile Approximately (100-p)percent of the observations have values greater than the pth Q2 50th Percentile 8 Chapter 3 Numerical Descriptive Measures (一)目的与要求 1. Calculate the arithmetic mean, median, mode, and geometric mean 2. Calculate percentiles and a box plot 3. Identify the position of the arithmetic mean, median, and mode for both a symmetrical distribution and a skewed distribution 4. Compute the range, variance, standard deviation 5. Explain mean-variance analysis and the Sharpe ratio 6. Explain Cehbyshev’s theorem and the Empirical Rule 7. Calculate and interpret the covariance and the correlation coefficient (二)教学内容 Section1. Measures of Central Location 1.主要内容 Often referred to as averages, the purpose of a measure of central tendency is to pinpoint the center of a set of observations. Average: a single value that represents a set of data. The arithmetic mean: The measure of central tendency most widely used is the arithmetic mean, usually shortened to the mean Sample mean: x x n = population mean: x N = The median: The midpoint of the values after they have been ordered from the smallest to the largest, or the largest to the smallest. There are as many values above the median as below it in the data array The mode: The value of the observation that appears most frequently A data set can have more than one mode, or even no mode The mode is the only meaningful measure of central location if we want to summarize qualitative data. 2.基本概念和知识点 Average, mean, median, mode 3.问题与应用 (1) Calculate and interpret the arithmetic mean, the median, and the mode Section2. Percentiles and Box Plots 1.主要内容 Percentile provide detailed information about how data are spread over the interval from the smallest value to the largest value. The pth percentile divides a data set into two parts: Approximately p percent of the observations have values less than the pth percentile Approximately (100-p) percent of the observations have values greater than the pth percentile ➢ Q1 25th Percentile ➢ Q2 50th Percentile