正在加载图片...
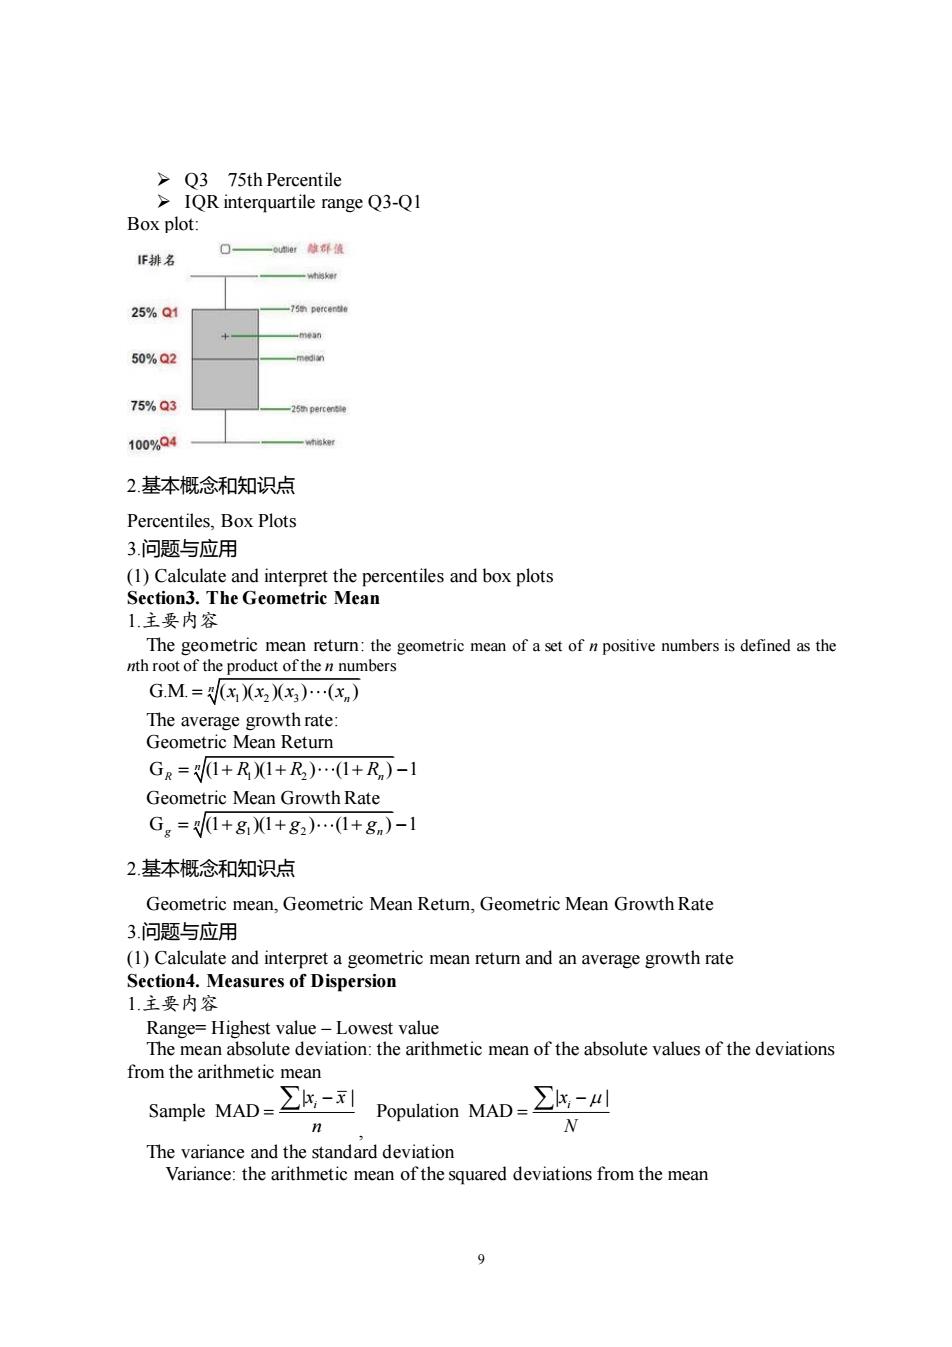
75th Percentile IQR interquartile range Q3-Q1 Box plot F排名 25%Q1 50%Q2 75%Q3 100%Q4 2.基本概念和知识点 Percentiles,Box Plots 3.问题与应用 (1)Calculate 1主要内容 The G.M.=)) The average growth rate. Geometric Mean Return Ge=1+R1+R)(1+R,)-1 Geometric Mean Growth Rate G=1+g1+g,).(1+g)-1 2基本概念和知识点 Geometric mean,Geometric Mean Retum,Geometric Mean Growth Rate 3.问题与应用 (1)Calculate and interpret a geometric mean return and an average growth rate Section4.Measures of Dispersion 1.主要内容 Range=Highest value-Lowest value The mean absolute deviation:the arithmetic mean of the absolute values of the deviations from the arithmetic mean Sample MAD=∑E-Population MAD=∑K-L The variance and the standard deviation Variance:the arithmetic mean ofthe squared deviations from the mean9 ➢ Q3 75th Percentile ➢ IQR interquartile range Q3-Q1 Box plot: 2.基本概念和知识点 Percentiles, Box Plots 3.问题与应用 (1) Calculate and interpret the percentiles and box plots Section3. The Geometric Mean 1.主要内容 The geometric mean return: the geometric mean of a set of n positive numbers is defined as the nth root of the product of the n numbers G.M. ( )( )( ) ( ) 1 2 3 n n = x x x x The average growth rate: Geometric Mean Return G (1 )(1 ) (1 ) 1 1 2 n R n = + + + − R R R Geometric Mean Growth Rate G (1 )(1 ) (1 ) 1 1 2 n g n = + + + − g g g 2.基本概念和知识点 Geometric mean, Geometric Mean Return, Geometric Mean Growth Rate 3.问题与应用 (1) Calculate and interpret a geometric mean return and an average growth rate Section4. Measures of Dispersion 1.主要内容 Range= Highest value – Lowest value The mean absolute deviation: the arithmetic mean of the absolute values of the deviations from the arithmetic mean | | Sample MAD i x x n − = , | | Population MAD i x N − = The variance and the standard deviation Variance: the arithmetic mean of the squared deviations from the mean