正在加载图片...
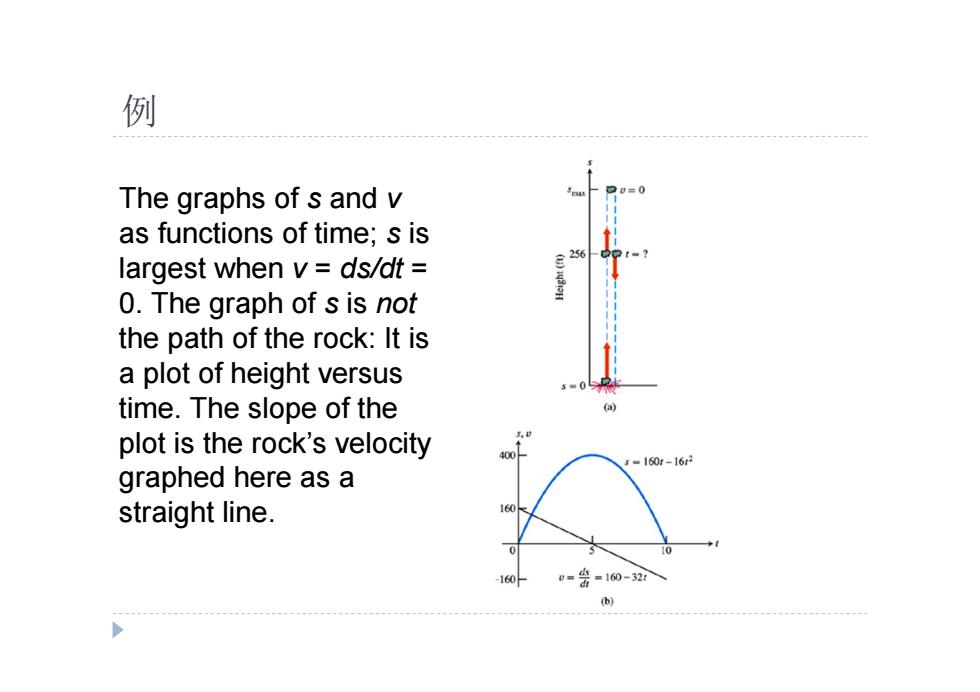
例 The graphs of s and v as functions of time;s is 256 largest when v=ds/dt 0.The graph of s is not the path of the rock:It is a plot of height versus time.The slope of the plot is the rock's velocity =160r-162 graphed here as a straight line. 160 p==160-32例 The graphs of s and v as functions of time; s is largest when v = ds/dt = 0. The graph of s is not the path of the rock: It is a plot of height versus time. The slope of the plot is the rock’s velocity graphed here as a straight line