正在加载图片...

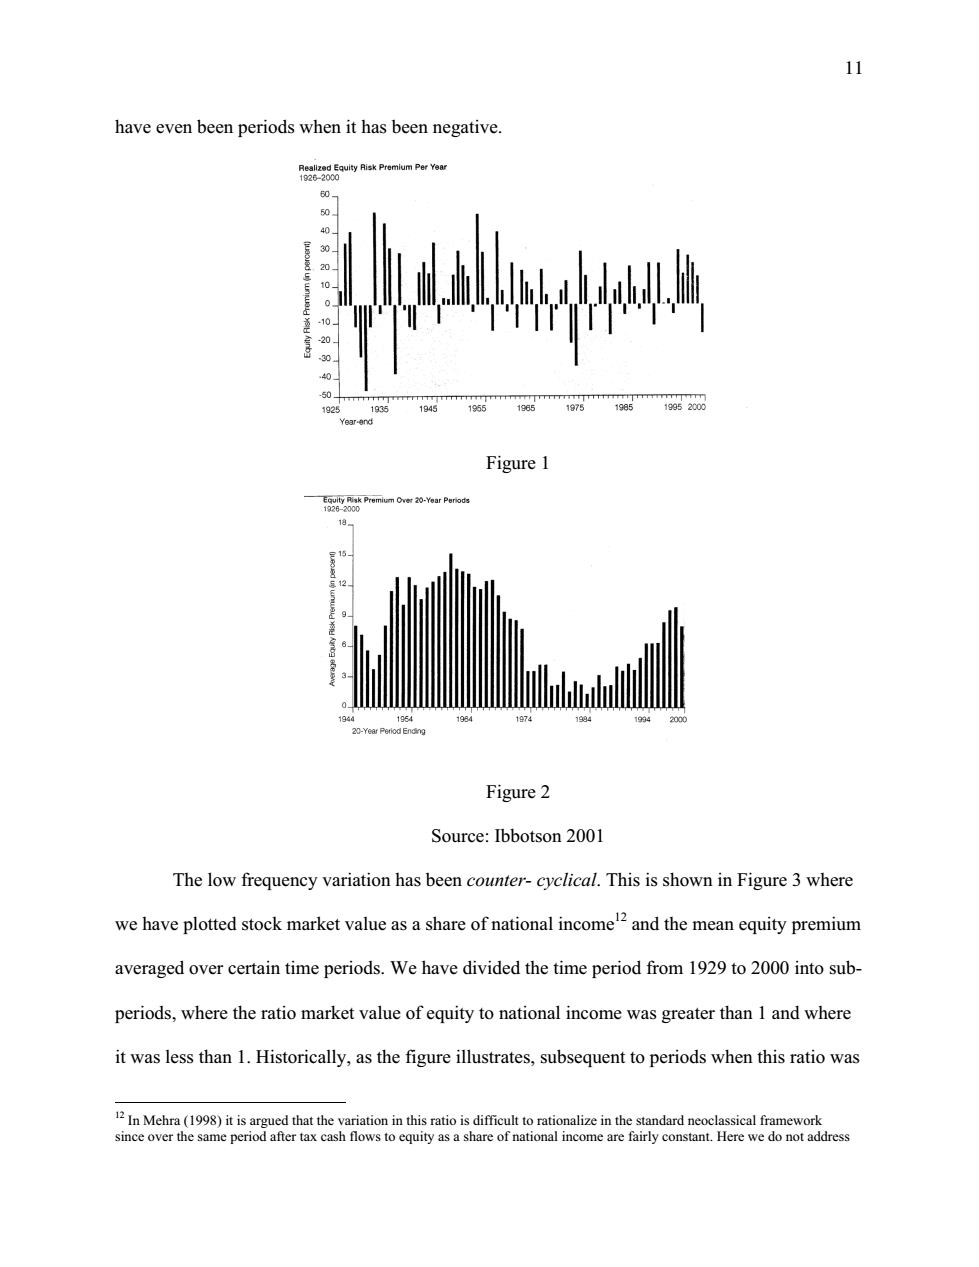
11 have even been periods when it has been negative. duwu 60 0 TTTTTTTTTTTT 1925 194 1955 1965 1975 1985 19952000 Year.end Figure 1 196d 1g54 1984 1974 1934 a 20-Year Period Ending Figure 2 Source:Ibbotson 2001 The low frequency variation has been counter-cyclical.This is shown in Figure 3 where we have plotted stock market value as a share of national incomeand the mean equity premium averaged over certain time periods.We have divided the time period from 1929 to 2000 into sub- periods,where the ratio market value of equity to national income was greater than 1 and where it was less than 1.Historically,as the figure illustrates,subsequent to periods when this ratio was In Mehra(199)it is argued that the variation in this ratio is difficult to rationalize in the standard neoclassical framework since over the same period after tax cash flows to equity as a share of national income are fairly constant.Here we do not address11 have even been periods when it has been negative. Figure 1 Figure 2 Source: Ibbotson 2001 The low frequency variation has been counter- cyclical. This is shown in Figure 3 where we have plotted stock market value as a share of national income12 and the mean equity premium averaged over certain time periods. We have divided the time period from 1929 to 2000 into subperiods, where the ratio market value of equity to national income was greater than 1 and where it was less than 1. Historically, as the figure illustrates, subsequent to periods when this ratio was 12 In Mehra (1998) it is argued that the variation in this ratio is difficult to rationalize in the standard neoclassical framework since over the same period after tax cash flows to equity as a share of national income are fairly constant. Here we do not address