正在加载图片...
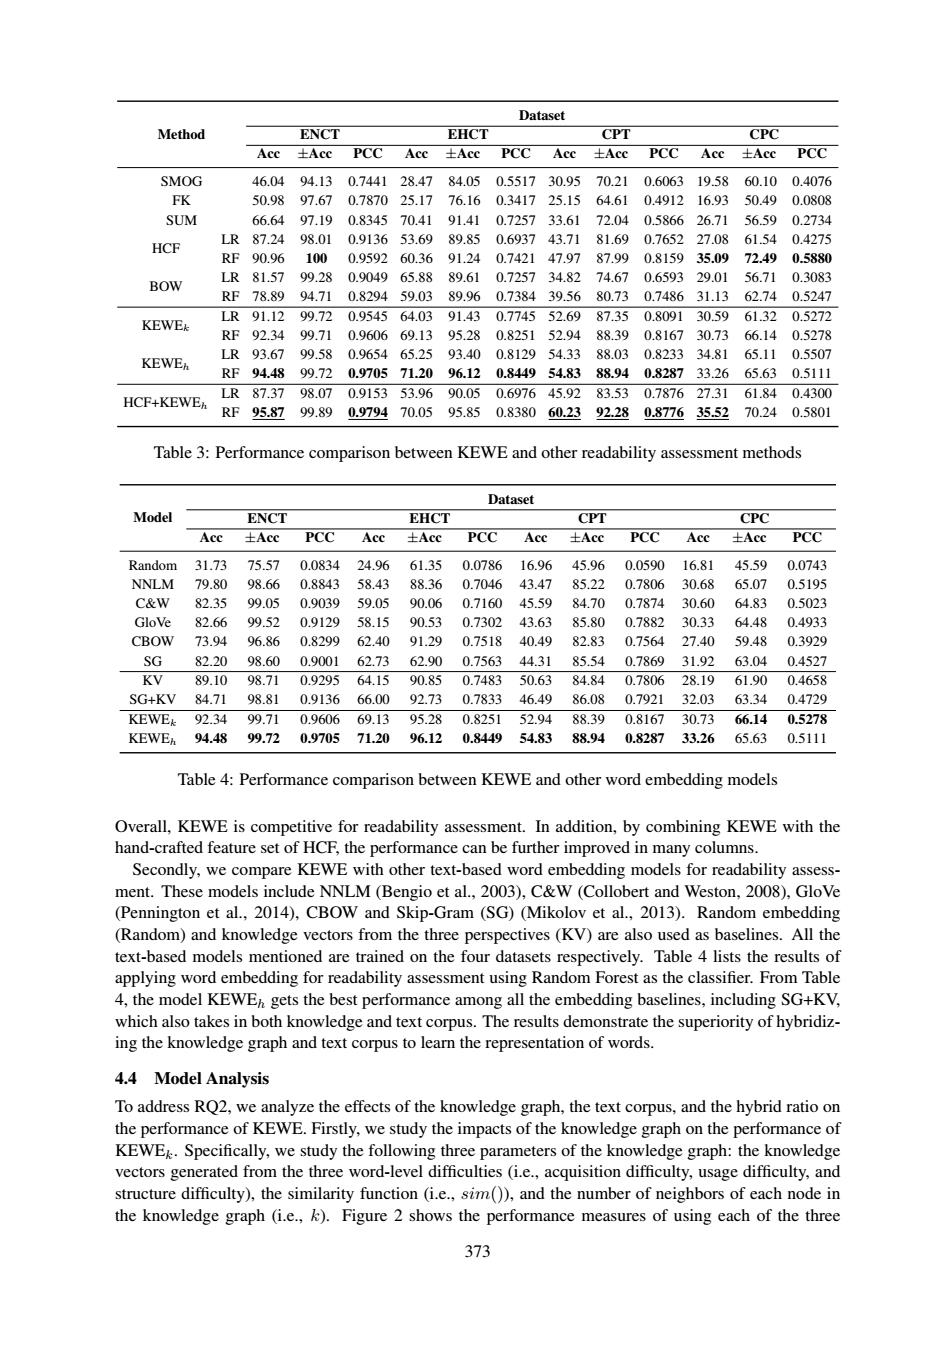
Dataset Method ENCT EHCT CPT CPC Acc 土Acc PCC Acc 士AcC PCC Acc 土AcC PCC Acc 士Acc PCC SMOG 46.0494.130.744128.4784.05 0.551730.9570.210.606319.58 60.100.4076 FK 50.98 97.67 0.787025.17 76.16 0.341725.15 64.61 0.4912 16.93 50.49 0.0808 SUM 66.6497.190.834570.4191.410.725733.6172.04 0.586626.71 56.590.2734 LR87.2498.01 0.913653.6989.850.693743.7181.69 0.765227.08 61.54 0.4275 HCF RF90.961000.959260.3691.240.742147.9787.990.815935.09 72.490.5880 BOW LR81.5799.280.904965.8889.610.725734.8274.67 0.659329.01 56.710.3083 RF78.8994.710.829459.0389.960.738439.5680.730.748631.1362.740.5247 LR91.1299.720.954564.0391.430.774552.6987.350.809130.5961.320.5272 KEWEk RF92.3499.71 0.960669.1395.28 0.825152.9488.390.816730.73 66.140.5278 KEWE LR93.6799.580.965465.2593.400.812954.3388.030.823334.8165.110.5507 RF94.4899.720.970571.2096.120.844954.8388.940.828733.26 65.630.5111 LR87.3798.070.915353.9690.050.697645.9283.530.787627.3161.840.4300 HCF+KEWE RF95.8799.890.979470.0595.85 0.838060.2392.280.877635.5270.240.5801 Table 3:Performance comparison between KEWE and other readability assessment methods Dataset Model ENCT EHCT CPT CPC Acc 士AcC PCC Acc 土Acc PCC Acc 土Acc PCC Acc 土Acc PCC Random 31.73 75.57 0.0834 24.96 61.35 0.0786 16.96 45.96 0.0590 16.81 45.59 0.0743 NNLM 79.80 98.66 0.8843 58.43 88.36 0.704643.47 85.22 0.7806 30.68 65.07 0.5195 C&W 82.35 99.05 0.9039 59.05 90.06 0.716045.59 84.70 0.7874 30.60 64.83 0.5023 GloVe 82.66 99.52 0.9129 58.15 90.53 0.7302 43.63 85.80 0.7882 30.33 64.48 0.4933 CBOW 73.94 96.86 0.829962.40 91.29 0.751840.49 82.83 0.756427.40 59.48 0.3929 SG 82.2098.60 0.900162.7362.900.756344.3185.540.7869 31.9263.04 0.4527 KV 89.1098.710.929564.1590.850.748350.6384.840.780628.1961.90 0.4658 SG+KV 84.71 98.81 0.913666.00 92.73 0.7833 46.49 86.08 0.7921 32.03 63.34 0.4729 KEWEL92.3499.710.960669.1395.280.825152.9488.390.816730.7366.14 0.5278 KEWEh 94.48 99.72 0.970571.2096.12 0.844954.83 88.94 0.8287 33.26 65.63 0.5111 Table 4:Performance comparison between KEWE and other word embedding models Overall,KEWE is competitive for readability assessment.In addition,by combining KEWE with the hand-crafted feature set of HCF,the performance can be further improved in many columns. Secondly,we compare KEWE with other text-based word embedding models for readability assess- ment.These models include NNLM(Bengio et al.,2003),C&W(Collobert and Weston,2008),GloVe (Pennington et al.,2014),CBOW and Skip-Gram (SG)(Mikolov et al.,2013).Random embedding (Random)and knowledge vectors from the three perspectives(KV)are also used as baselines.All the text-based models mentioned are trained on the four datasets respectively.Table 4 lists the results of applying word embedding for readability assessment using Random Forest as the classifier.From Table 4,the model KEWE gets the best performance among all the embedding baselines,including SG+KV, which also takes in both knowledge and text corpus.The results demonstrate the superiority of hybridiz- ing the knowledge graph and text corpus to learn the representation of words. 4.4 Model Analysis To address RQ2,we analyze the effects of the knowledge graph,the text corpus,and the hybrid ratio on the performance of KEWE.Firstly,we study the impacts of the knowledge graph on the performance of KEWE.Specifically,we study the following three parameters of the knowledge graph:the knowledge vectors generated from the three word-level difficulties (i.e.,acquisition difficulty,usage difficulty,and structure difficulty),the similarity function (i.e.,sim()),and the number of neighbors of each node in the knowledge graph (i.e.,k).Figure 2 shows the performance measures of using each of the three 373373 Method Dataset ENCT EHCT CPT CPC Acc ±Acc PCC Acc ±Acc PCC Acc ±Acc PCC Acc ±Acc PCC SMOG 46.04 94.13 0.7441 28.47 84.05 0.5517 30.95 70.21 0.6063 19.58 60.10 0.4076 FK 50.98 97.67 0.7870 25.17 76.16 0.3417 25.15 64.61 0.4912 16.93 50.49 0.0808 SUM 66.64 97.19 0.8345 70.41 91.41 0.7257 33.61 72.04 0.5866 26.71 56.59 0.2734 HCF LR 87.24 98.01 0.9136 53.69 89.85 0.6937 43.71 81.69 0.7652 27.08 61.54 0.4275 RF 90.96 100 0.9592 60.36 91.24 0.7421 47.97 87.99 0.8159 35.09 72.49 0.5880 BOW LR 81.57 99.28 0.9049 65.88 89.61 0.7257 34.82 74.67 0.6593 29.01 56.71 0.3083 RF 78.89 94.71 0.8294 59.03 89.96 0.7384 39.56 80.73 0.7486 31.13 62.74 0.5247 KEWEk LR 91.12 99.72 0.9545 64.03 91.43 0.7745 52.69 87.35 0.8091 30.59 61.32 0.5272 RF 92.34 99.71 0.9606 69.13 95.28 0.8251 52.94 88.39 0.8167 30.73 66.14 0.5278 KEWEh LR 93.67 99.58 0.9654 65.25 93.40 0.8129 54.33 88.03 0.8233 34.81 65.11 0.5507 RF 94.48 99.72 0.9705 71.20 96.12 0.8449 54.83 88.94 0.8287 33.26 65.63 0.5111 HCF+KEWEh LR 87.37 98.07 0.9153 53.96 90.05 0.6976 45.92 83.53 0.7876 27.31 61.84 0.4300 RF 95.87 99.89 0.9794 70.05 95.85 0.8380 60.23 92.28 0.8776 35.52 70.24 0.5801 Table 3: Performance comparison between KEWE and other readability assessment methods Model Dataset ENCT EHCT CPT CPC Acc ±Acc PCC Acc ±Acc PCC Acc ±Acc PCC Acc ±Acc PCC Random 31.73 75.57 0.0834 24.96 61.35 0.0786 16.96 45.96 0.0590 16.81 45.59 0.0743 NNLM 79.80 98.66 0.8843 58.43 88.36 0.7046 43.47 85.22 0.7806 30.68 65.07 0.5195 C&W 82.35 99.05 0.9039 59.05 90.06 0.7160 45.59 84.70 0.7874 30.60 64.83 0.5023 GloVe 82.66 99.52 0.9129 58.15 90.53 0.7302 43.63 85.80 0.7882 30.33 64.48 0.4933 CBOW 73.94 96.86 0.8299 62.40 91.29 0.7518 40.49 82.83 0.7564 27.40 59.48 0.3929 SG 82.20 98.60 0.9001 62.73 62.90 0.7563 44.31 85.54 0.7869 31.92 63.04 0.4527 KV 89.10 98.71 0.9295 64.15 90.85 0.7483 50.63 84.84 0.7806 28.19 61.90 0.4658 SG+KV 84.71 98.81 0.9136 66.00 92.73 0.7833 46.49 86.08 0.7921 32.03 63.34 0.4729 KEWEk 92.34 99.71 0.9606 69.13 95.28 0.8251 52.94 88.39 0.8167 30.73 66.14 0.5278 KEWEh 94.48 99.72 0.9705 71.20 96.12 0.8449 54.83 88.94 0.8287 33.26 65.63 0.5111 Table 4: Performance comparison between KEWE and other word embedding models Overall, KEWE is competitive for readability assessment. In addition, by combining KEWE with the hand-crafted feature set of HCF, the performance can be further improved in many columns. Secondly, we compare KEWE with other text-based word embedding models for readability assessment. These models include NNLM (Bengio et al., 2003), C&W (Collobert and Weston, 2008), GloVe (Pennington et al., 2014), CBOW and Skip-Gram (SG) (Mikolov et al., 2013). Random embedding (Random) and knowledge vectors from the three perspectives (KV) are also used as baselines. All the text-based models mentioned are trained on the four datasets respectively. Table 4 lists the results of applying word embedding for readability assessment using Random Forest as the classifier. From Table 4, the model KEWEh gets the best performance among all the embedding baselines, including SG+KV, which also takes in both knowledge and text corpus. The results demonstrate the superiority of hybridizing the knowledge graph and text corpus to learn the representation of words. 4.4 Model Analysis To address RQ2, we analyze the effects of the knowledge graph, the text corpus, and the hybrid ratio on the performance of KEWE. Firstly, we study the impacts of the knowledge graph on the performance of KEWEk. Specifically, we study the following three parameters of the knowledge graph: the knowledge vectors generated from the three word-level difficulties (i.e., acquisition difficulty, usage difficulty, and structure difficulty), the similarity function (i.e., sim()), and the number of neighbors of each node in the knowledge graph (i.e., k). Figure 2 shows the performance measures of using each of the three