正在加载图片...
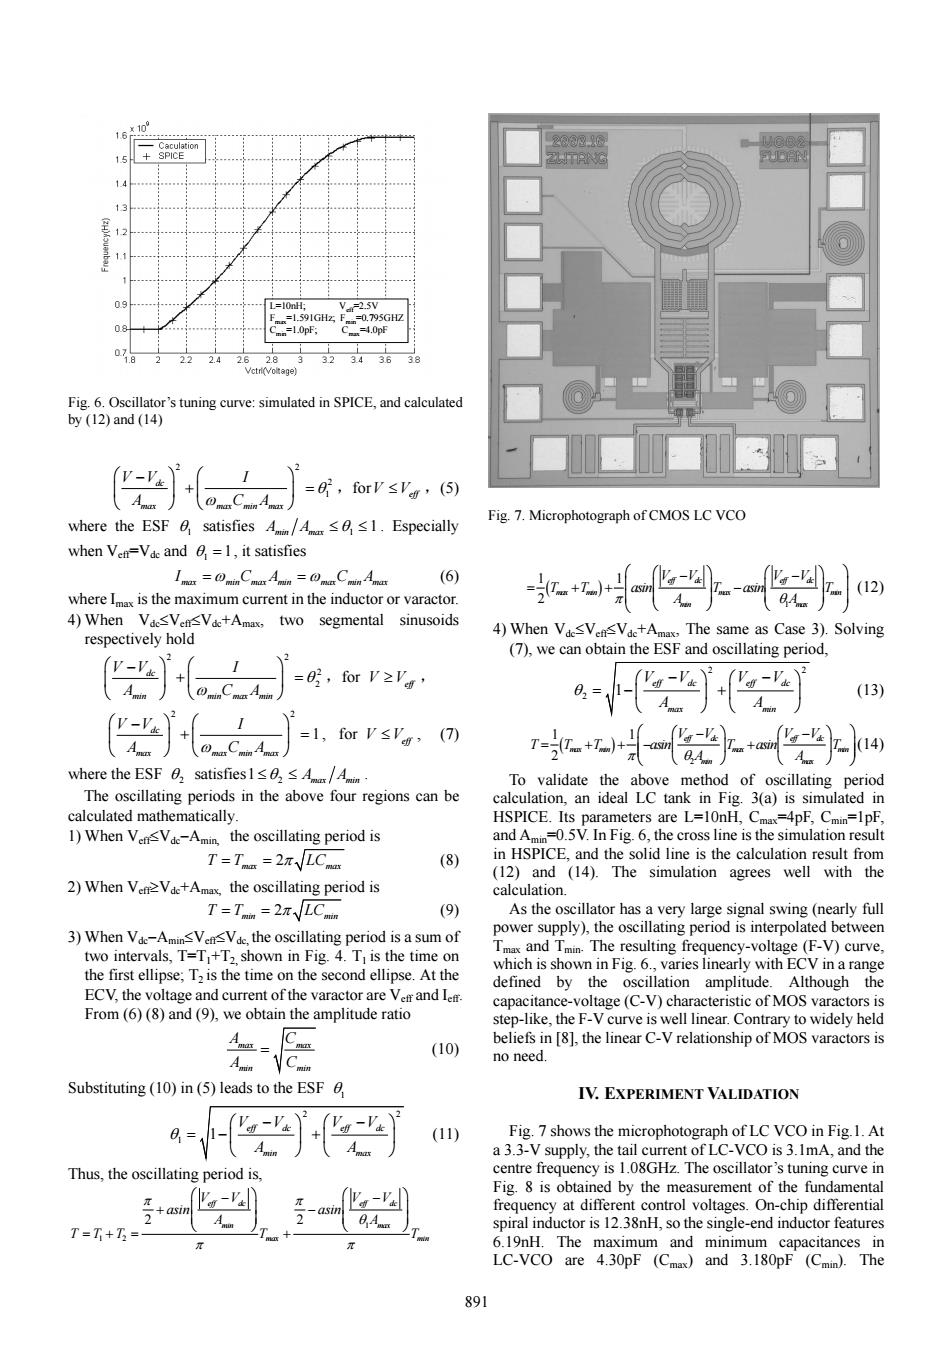
13 09 V SV =1.591GHz 0.795GHZ =10p, C=4.0pF 22 2.6 28 32343638 Vctri(Voltage) Fig.6.Oscillator's tuning curve:simulated in SPICE,and calculated by(12)and(14) =,forV≤V,(5) Fig.7.Microphotograph of CMOS LC VCO where the ESF satisfies As1.Especially when Ve=Vde and =1,it satisfies Ima=OminCmr Ain=Cn Amat (6) where I is the maximum current in the inductor or varactor. 4)When VacsVen<Vac+Amax,two segmental sinusoids respectively hold 4)When VdesVensVde+Amax,The same as Case 3).Solving (7),we can obtain the ESF and oscillating period, '-' ,forV≥'' 4阿 (13) =1,forV≤', (7) where the ESF,satisfies1≤O2≤Ans/Awin To validate the above method of oscillating period The oscillating periods in the above four regions can be calculation,an ideal LC tank in Fig.3(a)is simulated in calculated mathematically. HSPICE.Its parameters are L=10nH,Cmax=4pF,Cmin=1pF, 1)When VensVd-Amin,the oscillating period is and Amin=0.5V.In Fig.6,the cross line is the simulation result T=Tna=2πLC (8) in HSPICE.and the solid line is the calculation result from (12)and (14).The simulation agrees well with the 2)When VenVde+Amax,the oscillating period is calculation. T=Tm=2πVLCn (9) As the oscillator has a very large signal swing(nearly full 3)When Vde-AminVenVde,the oscillating period is a sum of power supply),the oscillating period is interpolated between two intervals,T=T +T,shown in Fig.4.T is the time on Tmax and Tmin The resulting frequency-voltage(F-V)curve, the first ellipse;T2 is the time on the second ellipse.At the which is shown in Fig.6.,varies linearly with ECV in a range defined by the oscillation amplitude.Although the ECV,the voltage and current of the varactor are Vet and Iem. capacitance-voltage(C-V)characteristic of MOS varactors is From(6)(8)and(9),we obtain the amplitude ratio step-like,the F-V curve is well linear.Contrary to widely held beliefs in [8],the linear C-V relationship of MOS varactors is (10) no need. Substituting(10)in(5)leads to the ESF TV.EXPERIMENT VALIDATION -V (11) Fig.7 shows the microphotograph of LC VCO in Fig.1.At a 3.3-V supply,the tail current of LC-VCO is 3.1mA,and the Thus,the oscillating period is, centre frequency is 1.08GHz.The oscillator's tuning curve in Fig.8 is obtained by the measurement of the fundamental frequency at different control voltages.On-chip differential spiral inductor is 12.38nH,so the single-end inductor features T=T+3= 6.19nH.The maximum and minimum capacitances in LC-VCO are 4.30pF (Cmax)and 3.180pF (Cmin).The 8912 2 2 θ1 ω ⎛ ⎞⎛ ⎞ − ⎜ ⎟⎜ ⎟ + = ⎝ ⎠⎝ ⎠ dc max max min max V V I A CA ,forV V≤ eff ,(5) where the ESF θ1 satisfies 1 ≤ ≤ θ 1 A A min max . Especially when Veff=Vdc and 1 θ = 1, it satisfies max min max min max min max I = = ω CA CA ω (6) where Imax is the maximum current in the inductor or varactor. 4) When Vdc≤Veff≤Vdc+Amax, two segmental sinusoids respectively hold 2 2 2 θ 2 ω ⎛ ⎞⎛ ⎞ − ⎜ ⎟⎜ ⎟ + = ⎝ ⎠⎝ ⎠ dc min min max min V V I A CA ,for V V≥ eff , 2 2 1 ω ⎛ ⎞⎛ ⎞ − ⎜ ⎟⎜ ⎟ + = ⎝ ⎠⎝ ⎠ dc max max min max V V I A CA , for V V≤ eff , (7) where the ESF θ 2 satisfies 2 1 ≤ ≤ θ Amax min A . The oscillating periods in the above four regions can be calculated mathematically. 1) When Veff≤Vdc−Amin, the oscillating period is 2 T T LC = = max max π (8) 2) When Veff≥Vdc+Amax, the oscillating period is 2 T T LC = = min min π (9) 3) When Vdc−Amin≤Veff≤Vdc, the oscillating period is a sum of two intervals, T=T1+T2, shown in Fig. 4. T1 is the time on the first ellipse; T2 is the time on the second ellipse. At the ECV, the voltage and current of the varactor are Veff and Ieff. From (6) (8) and (9), we obtain the amplitude ratio max max min min A C A C = (10) Substituting (10) in (5) leads to the ESF θ1 2 2 1 θ 1 ⎛ ⎞⎛ ⎞ − − =− + ⎜ ⎟⎜ ⎟ ⎝ ⎠⎝ ⎠ eff dc eff dc min max VV VV A A (11) Thus, the oscillating period is, 1 1 2 2 2 π π θ π π ⎛⎞ ⎛⎞ − − + − ⎜⎟ ⎜⎟ ⎝⎠ ⎝⎠ =+ = + eff dc eff dc min max max min VV VV asin asin A A TTT T T ( ) 1 1 1 2 π θ ⎛ ⎞ ⎛⎞ ⎛⎞ − − = ++ − ⎜ ⎟ ⎜⎟ ⎜⎟ ⎝ ⎠ ⎝⎠ ⎝⎠ eff dc eff dc max min max min min max VV VV T T asin T asin T A A (12) 4) When Vdc≤Veff≤Vdc+Amax, The same as Case 3). Solving (7), we can obtain the ESF and oscillating period, 2 2 2 θ 1 ⎛ ⎞⎛ ⎞ − − =− + ⎜ ⎟⎜ ⎟ ⎝ ⎠⎝ ⎠ eff dc eff dc max min VV VV A A (13) ( ) 2 1 1 2 π θ ⎛ ⎞ ⎛⎞ ⎛⎞ − − = + +− + ⎜ ⎟ ⎜⎟ ⎜⎟ ⎝ ⎠ ⎝⎠ ⎝⎠ eff dc eff dc max min max min min max VV VV T T T asin T asin T A A (14) To validate the above method of oscillating period calculation, an ideal LC tank in Fig. 3(a) is simulated in HSPICE. Its parameters are L=10nH, Cmax=4pF, Cmin=1pF, and Amin=0.5V. In Fig. 6, the cross line is the simulation result in HSPICE, and the solid line is the calculation result from (12) and (14). The simulation agrees well with the calculation. As the oscillator has a very large signal swing (nearly full power supply), the oscillating period is interpolated between Tmax and Tmin. The resulting frequency-voltage (F-V) curve, which is shown in Fig. 6., varies linearly with ECV in a range defined by the oscillation amplitude. Although the capacitance-voltage (C-V) characteristic of MOS varactors is step-like, the F-V curve is well linear. Contrary to widely held beliefs in [8], the linear C-V relationship of MOS varactors is no need. IV. EXPERIMENT VALIDATION Fig. 7 shows the microphotograph of LC VCO in Fig.1. At a 3.3-V supply, the tail current of LC-VCO is 3.1mA, and the centre frequency is 1.08GHz. The oscillator’s tuning curve in Fig. 8 is obtained by the measurement of the fundamental frequency at different control voltages. On-chip differential spiral inductor is 12.38nH, so the single-end inductor features 6.19nH. The maximum and minimum capacitances in LC-VCO are 4.30pF (Cmax) and 3.180pF (Cmin). The L=10nH; Veff=2.5V Fmax=1.591GHz; Fmin=0.795GHZ Cmin=1.0pF; Cmax=4.0pF Fig. 6. Oscillator’s tuning curve: simulated in SPICE, and calculated by (12) and (14) Fig. 7. Microphotograph of CMOS LC VCO 891