正在加载图片...
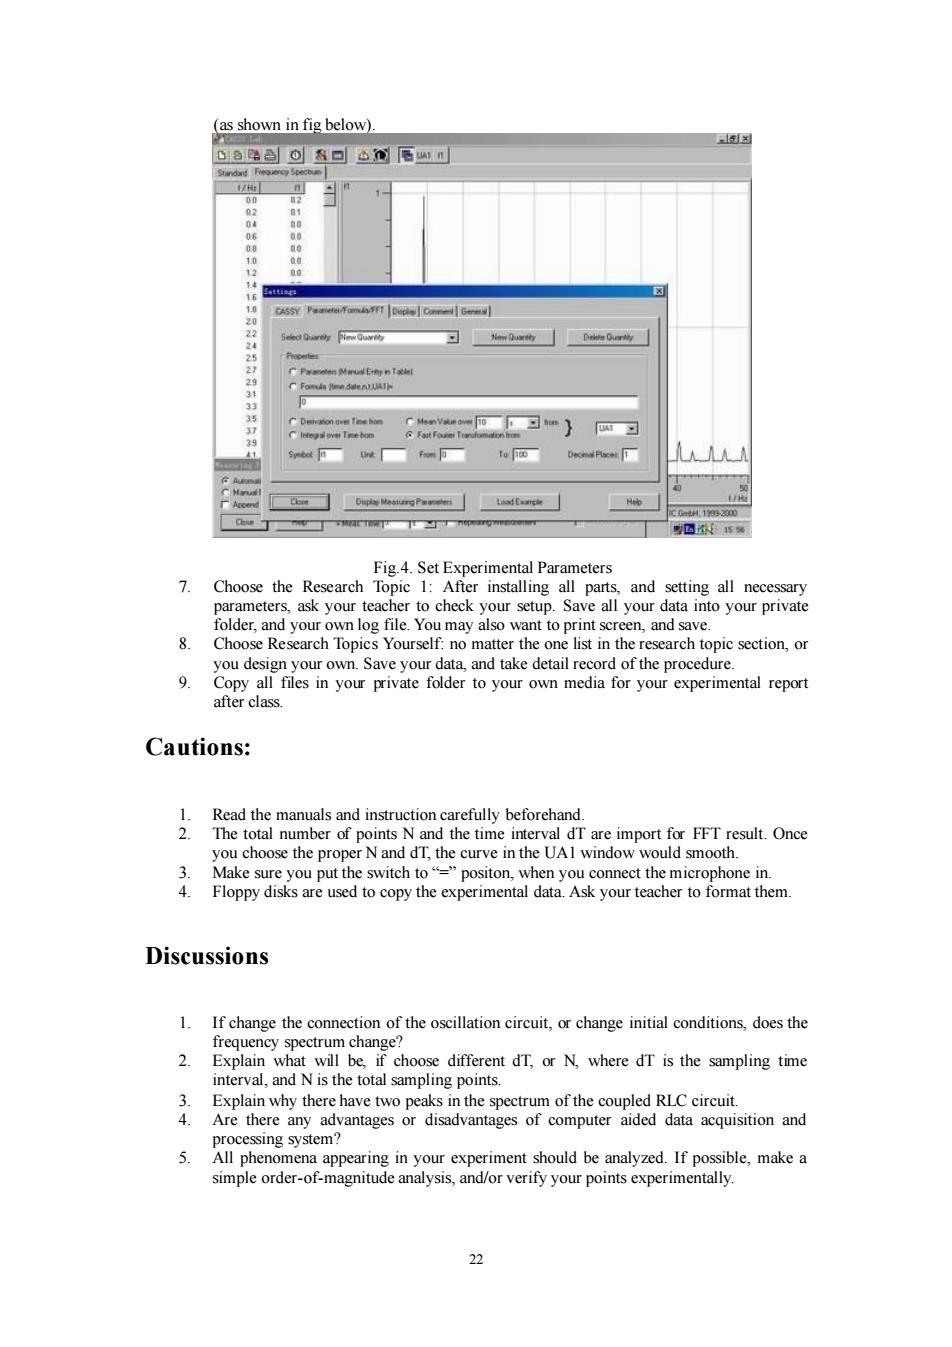
(as shown in fig below) D路色⊙&口公N届w1n 02 04 06 00 08 。 Sttisg ☒ 1 CASSY Paaere/Fa FFT Deple Con Gere 22 Seled Qharty Biew Quariy 25 CPraneteis Marud E向nIxh 2 CFoms Pme deerUAT 33 CDetedion ove Tne hom CMenVao-of习e} 习 29 41 Syebd■tfo=p■ te© Decmai Plscet 1 C0a12300 回西15% Fig.4.Set Experimental Parameters 7.Choose the Research Topic 1:After installing all parts,and setting all necessary parameters,ask your teacher to check your setup.Save all your data into your private folder,and your own log file.You may also want to print screen,and save. 8. Choose Research Topics Yourself:no matter the one list in the research topic section,or you design your own.Save your data,and take detail record of the procedure. 9 Copy all files in your private folder to your own media for your experimental report after class. Cautions: 1.Read the manuals and instruction carefully beforehand 2.The total number of points N and the time interval dT are import for FFT result.Once you choose the proper N and dT,the curve in the UAl window would smooth. 3 Make sure you put the switch to="positon,when you connect the microphone in. 4. Floppy disks are used to copy the experimental data.Ask your teacher to format them. Discussions 1.If change the connection of the oscillation circuit,or change initial conditions,does the frequency spectrum change? 2.Explain what will be,if choose different d'T,or N,where dT is the sampling time interval,and N is the total sampling points. 3.Explain why there have two peaks in the spectrum of the coupled RLC circuit. 4.Are there any advantages or disadvantages of computer aided data acquisition and processing system? 5. All phenomena appearing in your experiment should be analyzed.If possible,make a simple order-of-magnitude analysis,and/or verify your points experimentally. 2222 (as shown in fig below). Fig.4. Set Experimental Parameters 7. Choose the Research Topic 1: After installing all parts, and setting all necessary parameters, ask your teacher to check your setup. Save all your data into your private folder, and your own log file. You may also want to print screen, and save. 8. Choose Research Topics Yourself: no matter the one list in the research topic section, or you design your own. Save your data, and take detail record of the procedure. 9. Copy all files in your private folder to your own media for your experimental report after class. Cautions: 1. Read the manuals and instruction carefully beforehand. 2. The total number of points N and the time interval dT are import for FFT result. Once you choose the proper N and dT, the curve in the UA1 window would smooth. 3. Make sure you put the switch to “=” positon, when you connect the microphone in. 4. Floppy disks are used to copy the experimental data. Ask your teacher to format them. Discussions 1. If change the connection of the oscillation circuit, or change initial conditions, does the frequency spectrum change? 2. Explain what will be, if choose different dT, or N, where dT is the sampling time interval, and N is the total sampling points. 3. Explain why there have two peaks in the spectrum of the coupled RLC circuit. 4. Are there any advantages or disadvantages of computer aided data acquisition and processing system? 5. All phenomena appearing in your experiment should be analyzed. If possible, make a simple order-of-magnitude analysis, and/or verify your points experimentally