Exp7:Fourier Analysis of Signals Purposes 1.Learn the Fourier analysis methods. Learn how to measure frequency spectra of several common used signals. 3 Learn how to use the Cassy Leb,a computer aided data acquisition and signal processing system. Principle of the Experiment In various fields of science and technology,one may meet complex signals.No matter how complex the signals are,they can be decomposed into summation of sine waves with different frequency.Fourier analysis is just the mathematical tool to do the job,decomposing the original signal to different frequency parts.The Fourier transfer result,which is called the frequency spectrum,represents the basic characteristics of the signal,the frequency and amplitude. Spectrum of a periodic function A signal f(t),with period T,can be expanded into a Fourier series: )-a+acos(2xnv.t)+b,Sin(2xv.t)] -CO)+Clcos(2)+] (1) where, Co-va+b好, 0=g d Where,C(n)and o(n)are the amplitude and the phase of the n-th harmonic wave.C(n),as function of n,is called the amplitude spectrum.0(n),as function of n,called a phase spectrum. In normal circumstances,one only cares about the amplitude spectrum.Therefore,if someone says spectrum,he is talking the amplitude spectrum. The spectrum of the non-periodic function Non-periodic function can be treated as a periodic function with period of oo.Therefore, replacing the Fourier series shown above for the period function case with the Fourier integral, one can have Fourier transfer for non-period function. The Spectrum of RLC circuit Fig.1 RLC Circuit The RLC transient response can be described as
19 Exp7: Fourier Analysis of Signals Purposes 1. Learn the Fourier analysis methods. 2. Learn how to measure frequency spectra of several common used signals. 3. Learn how to use the Cassy Leb, a computer aided data acquisition and signal processing system. Principle of the Experiment In various fields of science and technology, one may meet complex signals. No matter how complex the signals are, they can be decomposed into summation of sine waves with different frequency. Fourier analysis is just the mathematical tool to do the job, decomposing the original signal to different frequency parts. The Fourier transfer result, which is called the frequency spectrum, represents the basic characteristics of the signal, the frequency and amplitude. ⚫ Spectrum of a periodic function A signal ƒ (t), with period T, can be expanded into a Fourier series: ƒ(t)= = + + n 1 0 n 0 n 0 a a cos(2 nv t) b Sin (2 v t) = = + + 1 ( ) 0 (0) cos(2 ) ( ) n C C n nv t n (1) where, C(n)= 2 n 2 a n + b , d n tg = −1 ( ) Where, C(n) and φ(n) are the amplitude and the phase of the n-th harmonic wave. C(n), as function of n, is called the amplitude spectrum. θ(n), as function of n, called a phase spectrum. In normal circumstances, one only cares about the amplitude spectrum. Therefore, if someone says spectrum, he is talking the amplitude spectrum. ⚫ The spectrum of the non-periodic function Non-periodic function can be treated as a periodic function with period of ∞. Therefore, replacing the Fourier series shown above for the period function case with the Fourier integral, one can have Fourier transfer for non-period function. ⚫ The Spectrum of RLC circuit Fig.1 RLC Circuit The RLC transient response can be described as

Lcd+血+M.=0 dt2 dt (2) The initial condition is:uc()=0, 0)=1。= R Its characteristic equation is, p2+ RP* 1 =0 L LC (3) L when R<2c the solutions of the characteristic equation are a pair of conjugate complex. ue(t)is damping: u()=Ae-2a cos(2n1-) R 1 where,a= 2L Vo= =,=v-a2,and A and are determined by the 2πVL initial conditions. L When R<<21 ,v≈vo。The frequency spectrum of RLC can be written as, L(V)=L0- (4) 2+(v-vo)2 i.e.it is a Lorentz function The Spectrum of Coupled RLC Circuit Fig.2 coupled RLC circuit diagram A Coupled RLC circuit can be described by two 2nd-order differential equations.Once eliminating variables,one can have an 4th-order ordinary differential equations.If RI and R2 are very small,the characteristic equation has two pairs of conjugate complex solutions,and the imaginary part of the vl and v2 approximate meet V1-Vo≈V0-V2<<Vo Therefore,we can have, L(V)=L(V)+=L2(V) Where, Li=Lio- (i=1,2) +(yo-y,)2 Li is located symmetrically at both sides of vo. 20
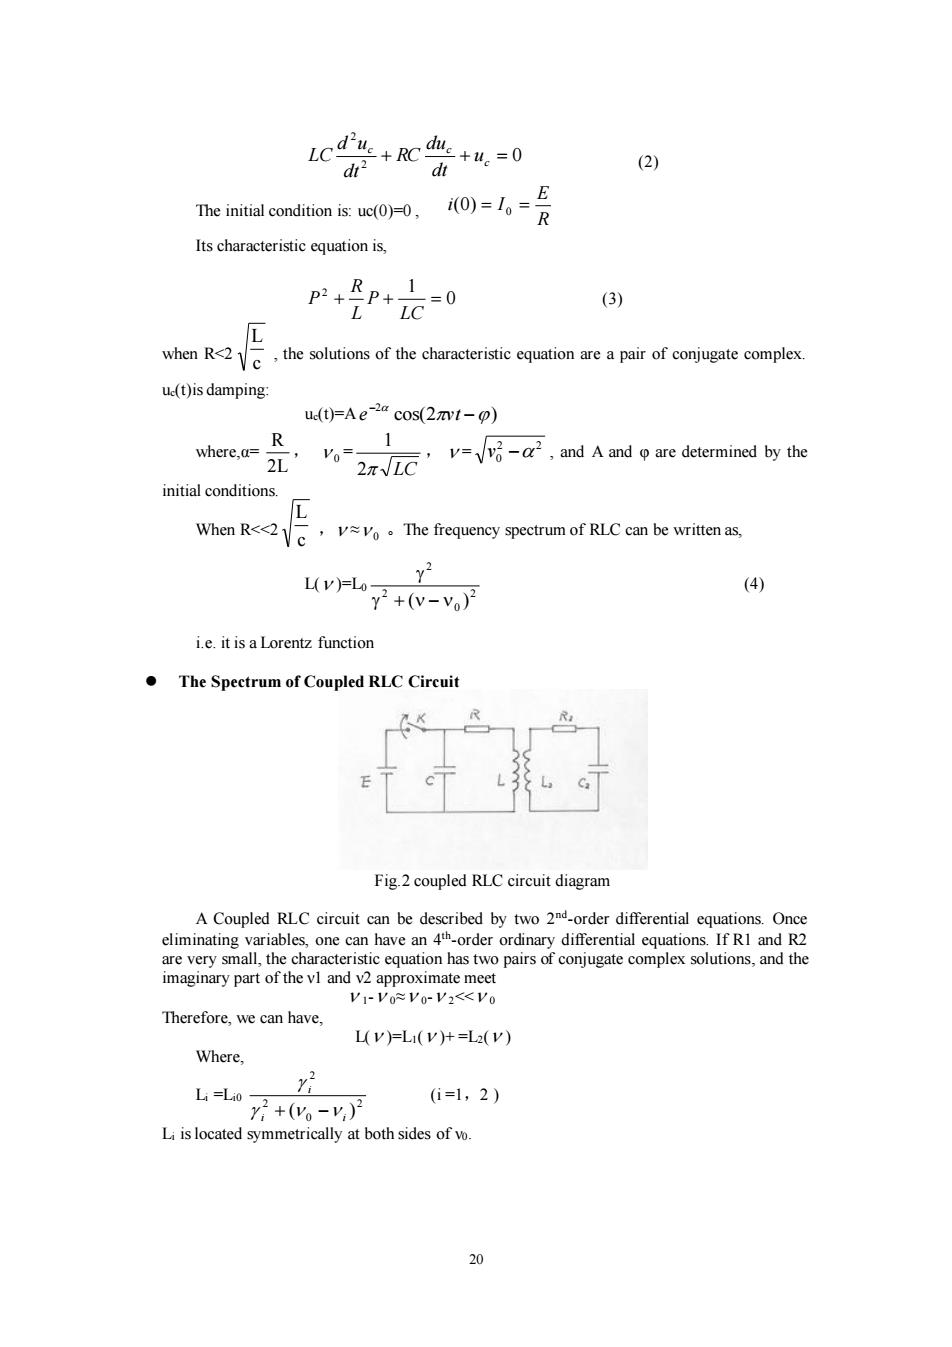
20 0 2 2 + + c = c c u dt du RC dt d u LC (2) The initial condition is: uc(0)=0 , R E i(0) = I 0 = Its characteristic equation is, 0 2 1 + + = LC P L R P (3) when R<2 c L , the solutions of the characteristic equation are a pair of conjugate complex. uc(t)is damping: uc(t)=A cos(2 ) 2 − − e vt where,α= 2L R , 0 = 2 LC 1 , = 2 2 v0 − , and A and φ are determined by the initial conditions. When R<<2 c L , ≈ 0 。The frequency spectrum of RLC can be written as, L( )=L0 2 0 2 2 + ( − ) (4) i.e. it is a Lorentz function ⚫ The Spectrum of Coupled RLC Circuit Fig.2 coupled RLC circuit diagram A Coupled RLC circuit can be described by two 2nd -order differential equations. Once eliminating variables, one can have an 4 th -order ordinary differential equations. If R1 and R2 are very small, the characteristic equation has two pairs of conjugate complex solutions, and the imaginary part of the ν1 and ν2 approximate meet 1- 0≈ 0- 2<< 0 Therefore, we can have, L( )=L1( )+ =L2( ) Where, Li =Li0 2 0 2 2 ( ) i i i + − (i =1,2 ) Li is located symmetrically at both sides of ν0

Fig.3 Experimental Setup of Fourier Analysis. Research Topics 1. Fourier analysis of the periodic signal generated by the function generator. 2. Fourier synthesis of the analog signal. 3. Fourier analysis of RLC transient process 4 Fourier analysis of coupled RLC transient process. 5.Fourier analysis of Music and language. Instruments Circuit Board A4,(#57624);Coil (500 turns,#56214);Microphone(#58626):DC power supply(#52145);Function Generator (#52156);Base (#30011);Wires;Resistors(1,102,5.1, 20,100,2W):2 Capacitors(lu F,100v);Switch;Computer aided Data Acquisition System Hints 1.Read experimental instructions carefully.Learn the requirements and procedure of the experiment. 2. Read the manuals of the instruments carefully. . Read Cassy Leb's manual.You can find more details in online documentation. 4. Open the computer.In folder C:\Data,open existing files,to learn the basic experimental parameters setting. 5.In folder C:\StuData,there have old folders(named by student ID)left by previous students.Create your own folder,and you will save all your experimental data here, including a TEXT file which you will use as your experimental log. 6. Open program Cassy Leb;click setting icon,and enter into setting dialog box;chose Tab Cassy,and then imput A;set parameter of the sensors.Click measurement parameter button,and set the measurement parameters like time etc.Open Tab Parameter/Formula/FFT,and click new quantity button,select FFT,and choose UAI >
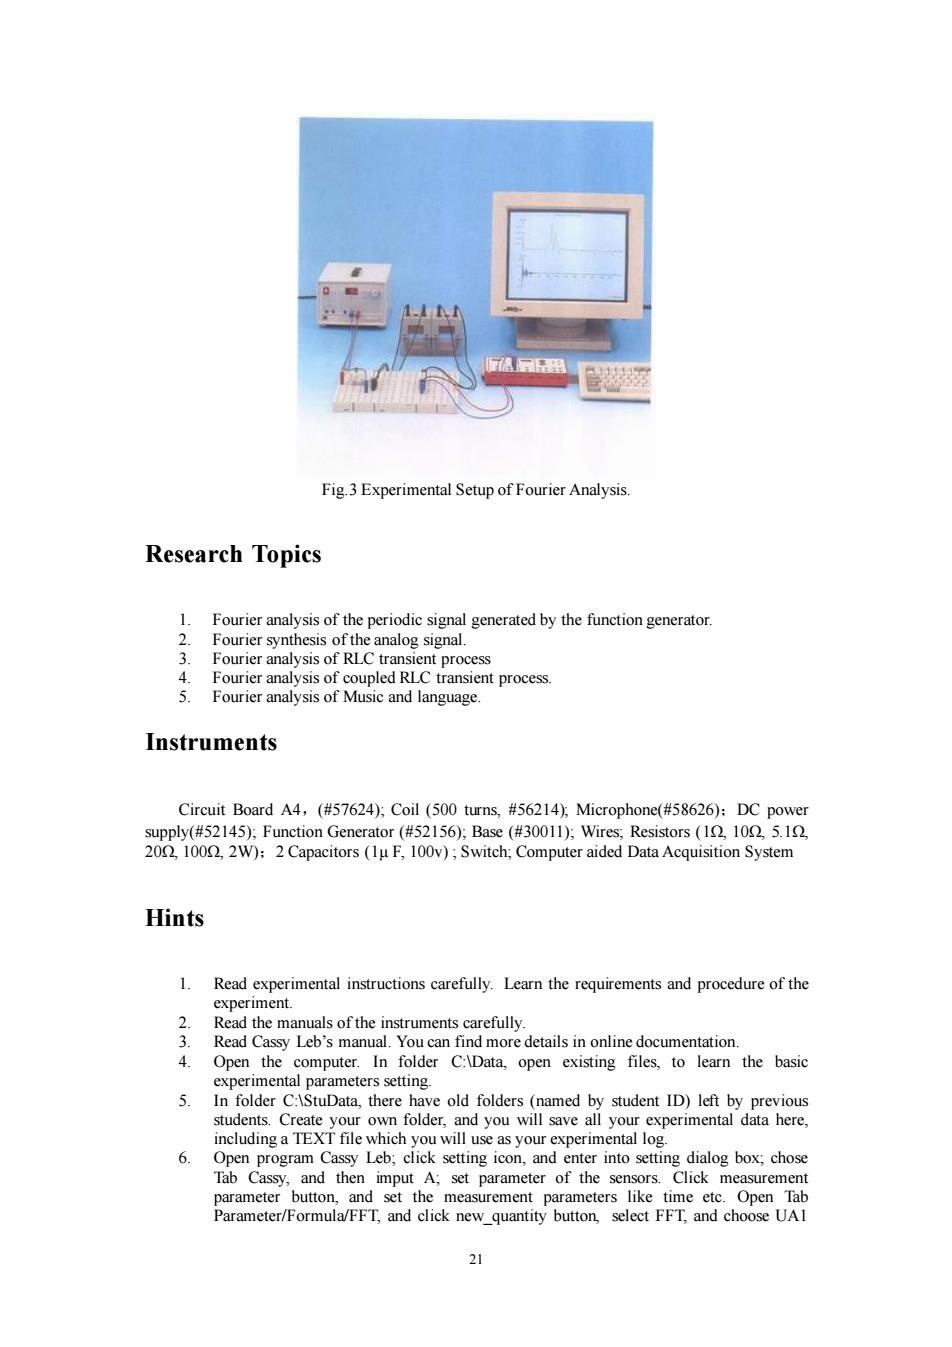
21 Fig.3 Experimental Setup of Fourier Analysis. Research Topics 1. Fourier analysis of the periodic signal generated by the function generator. 2. Fourier synthesis of the analog signal. 3. Fourier analysis of RLC transient process 4. Fourier analysis of coupled RLC transient process. 5. Fourier analysis of Music and language. Instruments Circuit Board A4,(#57624); Coil (500 turns, #56214); Microphone(#58626);DC power supply(#52145); Function Generator (#52156); Base (#30011); Wires; Resistors (1Ω, 10Ω, 5.1Ω, 20Ω, 100Ω, 2W);2 Capacitors (1μ F, 100v) ; Switch; Computer aided Data Acquisition System Hints 1. Read experimental instructions carefully. Learn the requirements and procedure of the experiment. 2. Read the manuals of the instruments carefully. 3. Read Cassy Leb’s manual. You can find more details in online documentation. 4. Open the computer. In folder C:\Data, open existing files, to learn the basic experimental parameters setting. 5. In folder C:\StuData, there have old folders (named by student ID) left by previous students. Create your own folder, and you will save all your experimental data here, including a TEXT file which you will use as your experimental log. 6. Open program Cassy Leb; click setting icon, and enter into setting dialog box; chose Tab Cassy, and then imput A; set parameter of the sensors. Click measurement parameter button, and set the measurement parameters like time etc. Open Tab Parameter/Formula/FFT, and click new_quantity button, select FFT, and choose UA1

(as shown in fig below) D路色⊙&口公N届w1n 02 04 06 00 08 。 Sttisg ☒ 1 CASSY Paaere/Fa FFT Deple Con Gere 22 Seled Qharty Biew Quariy 25 CPraneteis Marud E向nIxh 2 CFoms Pme deerUAT 33 CDetedion ove Tne hom CMenVao-of习e} 习 29 41 Syebd■tfo=p■ te© Decmai Plscet 1 C0a12300 回西15% Fig.4.Set Experimental Parameters 7.Choose the Research Topic 1:After installing all parts,and setting all necessary parameters,ask your teacher to check your setup.Save all your data into your private folder,and your own log file.You may also want to print screen,and save. 8. Choose Research Topics Yourself:no matter the one list in the research topic section,or you design your own.Save your data,and take detail record of the procedure. 9 Copy all files in your private folder to your own media for your experimental report after class. Cautions: 1.Read the manuals and instruction carefully beforehand 2.The total number of points N and the time interval dT are import for FFT result.Once you choose the proper N and dT,the curve in the UAl window would smooth. 3 Make sure you put the switch to="positon,when you connect the microphone in. 4. Floppy disks are used to copy the experimental data.Ask your teacher to format them. Discussions 1.If change the connection of the oscillation circuit,or change initial conditions,does the frequency spectrum change? 2.Explain what will be,if choose different d'T,or N,where dT is the sampling time interval,and N is the total sampling points. 3.Explain why there have two peaks in the spectrum of the coupled RLC circuit. 4.Are there any advantages or disadvantages of computer aided data acquisition and processing system? 5. All phenomena appearing in your experiment should be analyzed.If possible,make a simple order-of-magnitude analysis,and/or verify your points experimentally. 22
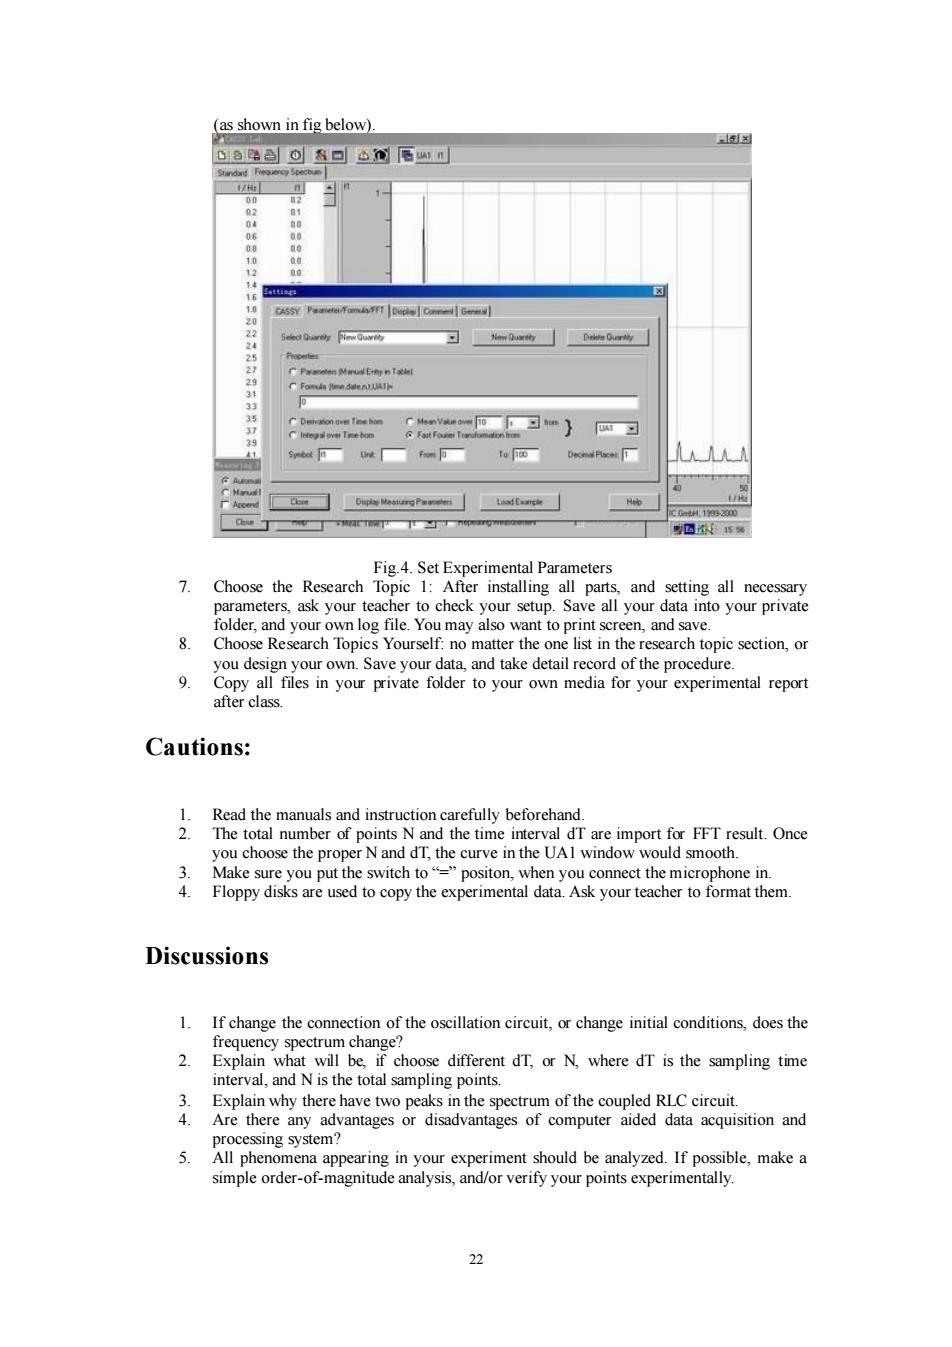
22 (as shown in fig below). Fig.4. Set Experimental Parameters 7. Choose the Research Topic 1: After installing all parts, and setting all necessary parameters, ask your teacher to check your setup. Save all your data into your private folder, and your own log file. You may also want to print screen, and save. 8. Choose Research Topics Yourself: no matter the one list in the research topic section, or you design your own. Save your data, and take detail record of the procedure. 9. Copy all files in your private folder to your own media for your experimental report after class. Cautions: 1. Read the manuals and instruction carefully beforehand. 2. The total number of points N and the time interval dT are import for FFT result. Once you choose the proper N and dT, the curve in the UA1 window would smooth. 3. Make sure you put the switch to “=” positon, when you connect the microphone in. 4. Floppy disks are used to copy the experimental data. Ask your teacher to format them. Discussions 1. If change the connection of the oscillation circuit, or change initial conditions, does the frequency spectrum change? 2. Explain what will be, if choose different dT, or N, where dT is the sampling time interval, and N is the total sampling points. 3. Explain why there have two peaks in the spectrum of the coupled RLC circuit. 4. Are there any advantages or disadvantages of computer aided data acquisition and processing system? 5. All phenomena appearing in your experiment should be analyzed. If possible, make a simple order-of-magnitude analysis, and/or verify your points experimentally