正在加载图片...
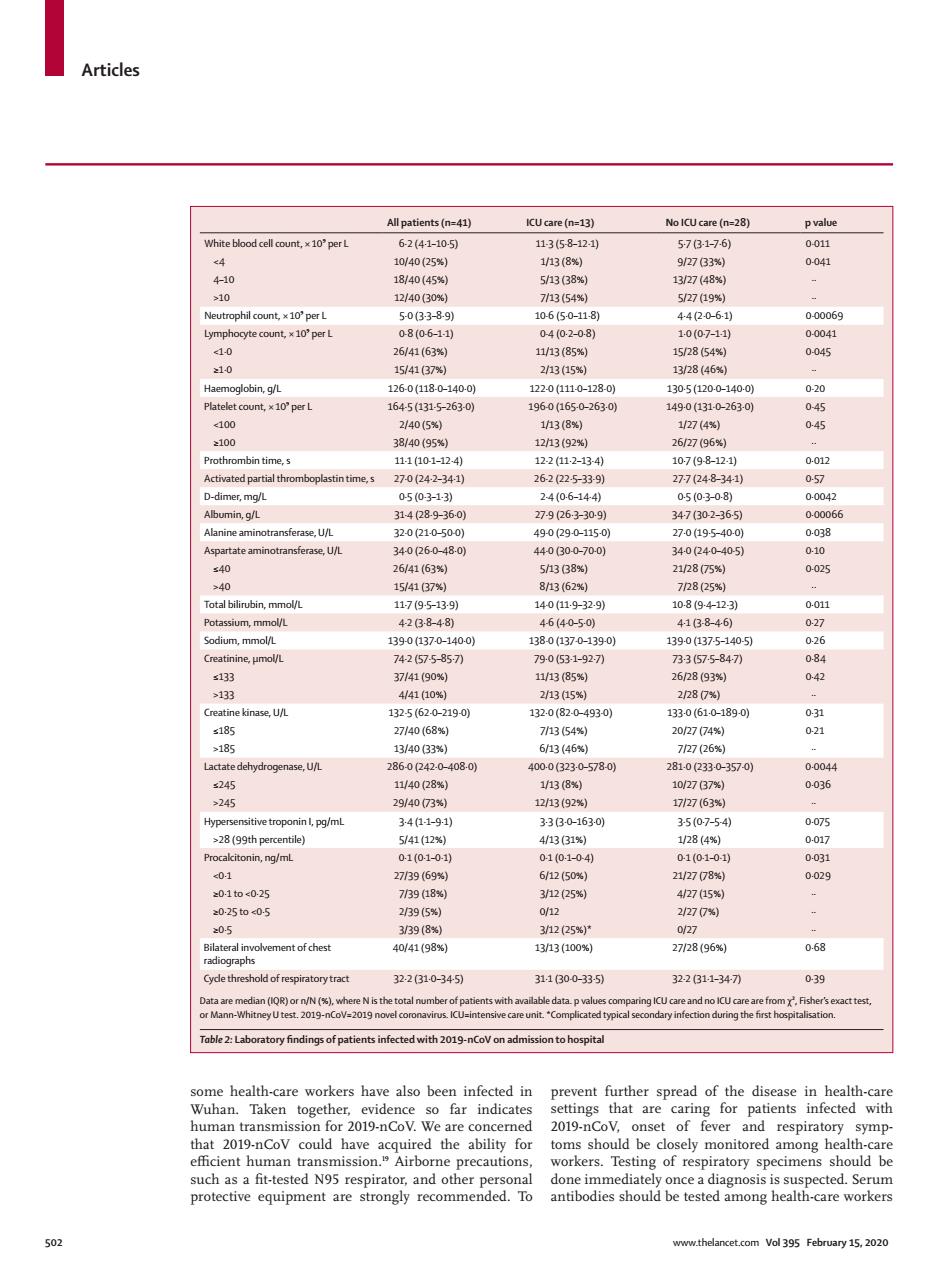
Articles All patients (n=41 ICUcare (n=13) No KCU sare (n=28) White blood cell count. 2E12 0.01 040(25 0041 0B389 10650-18 44061 00069 26(63 1/3( 10 5/4137 13/28(46 2/40(5%) 1/27(4 0 in time 100124 002 270242-341 262225-339 277(248-341 057 m9 34p8.9-360 79p63-309 34707-365 sferase.UA 49-0(290-115 270a95-400 6163 285 154137% 8n62 7825% 07 1390a370-1400 s133 3(85 262893W 441(10W 2/13( 2280% 6 930 83 340(33 6(46 570 10r2G7 9/4073 1213(929 1727(63% I.pg/n >28(99th percentike 5/41028 284 citonin,ng/m 01(01-0 0101-04 01(01-0 8 30-10c025 793 1205* 2025to05 n95 o25 ment of chest 2728(96 068 32.2610-345 31.1000-335】 32.2311-341 0-39 e Nis Table 2:Laboratory findings of patients infected with 2019-nCoV on adm sion to hospita heal her vidence setings that ar patients infected with human trans 019-nCoV of fe respira ory symp- orkers.Testin of res Articles 502 www.thelancet.com Vol 395 February 15, 2020 some health-care workers have also been infected in Wuhan. Taken together, evidence so far indicates human transmission for 2019-nCoV. We are concerned that 2019-nCoV could have acquired the ability for efficient human transmission.19 Airborne precautions, such as a fit-tested N95 respirator, and other personal protective equipment are strongly recommended. To prevent further spread of the disease in health-care settings that are caring for patients infected with 2019-nCoV, onset of fever and respiratory symptoms should be closely monitored among health-care workers. Testing of respiratory specimens should be done immediately once a diagnosis is suspected. Serum antibodies should be tested among health-care workers All patients (n=41) ICU care (n=13) No ICU care (n=28) p value White blood cell count, × 10⁹ per L 6·2 (4·1–10·5) 11·3 (5·8–12·1) 5·7 (3·1–7·6) 0·011 <4 10/40 (25%) 1/13 (8%) 9/27 (33%) 0·041 4–10 18/40 (45%) 5/13 (38%) 13/27 (48%) ·· >10 12/40 (30%) 7/13 (54%) 5/27 (19%) ·· Neutrophil count, × 10⁹ per L 5·0 (3·3–8·9) 10·6 (5·0–11·8) 4·4 (2·0–6·1) 0·00069 Lymphocyte count, × 10⁹ per L 0·8 (0·6–1·1) 0·4 (0·2–0·8) 1·0 (0·7–1·1) 0·0041 <1·0 26/41 (63%) 11/13 (85%) 15/28 (54%) 0·045 ≥1·0 15/41 (37%) 2/13 (15%) 13/28 (46%) ·· Haemoglobin, g/L 126·0 (118·0–140·0) 122·0 (111·0–128·0) 130·5 (120·0–140·0) 0·20 Platelet count, × 10⁹ per L 164·5 (131·5–263·0) 196·0 (165·0–263·0) 149·0 (131·0–263·0) 0·45 <100 2/40 (5%) 1/13 (8%) 1/27 (4%) 0·45 ≥100 38/40 (95%) 12/13 (92%) 26/27 (96%) ·· Prothrombin time, s 11·1 (10·1–12·4) 12·2 (11·2–13·4) 10·7 (9·8–12·1) 0·012 Activated partial thromboplastin time, s 27·0 (24·2–34·1) 26·2 (22·5–33·9) 27·7 (24·8–34·1) 0·57 D-dimer, mg/L 0·5 (0·3–1·3) 2·4 (0·6–14·4) 0·5 (0·3–0·8) 0·0042 Albumin, g/L 31·4 (28·9–36·0) 27·9 (26·3–30·9) 34·7 (30·2–36·5) 0·00066 Alanine aminotransferase, U/L 32·0 (21·0–50·0) 49·0 (29·0–115·0) 27·0 (19·5–40·0) 0·038 Aspartate aminotransferase, U/L 34·0 (26·0–48·0) 44·0 (30·0–70·0) 34·0 (24·0–40·5) 0·10 ≤40 26/41 (63%) 5/13 (38%) 21/28 (75%) 0·025 >40 15/41 (37%) 8/13 (62%) 7/28 (25%) ·· Total bilirubin, mmol/L 11·7 (9·5–13·9) 14·0 (11·9–32·9) 10·8 (9·4–12·3) 0·011 Potassium, mmol/L 4·2 (3·8–4·8) 4·6 (4·0–5·0) 4·1 (3·8–4·6) 0·27 Sodium, mmol/L 139·0 (137·0–140·0) 138·0 (137·0–139·0) 139·0 (137·5–140·5) 0·26 Creatinine, μmol/L 74·2 (57·5–85·7) 79·0 (53·1–92·7) 73·3 (57·5–84·7) 0·84 ≤133 37/41 (90%) 11/13 (85%) 26/28 (93%) 0·42 >133 4/41 (10%) 2/13 (15%) 2/28 (7%) ·· Creatine kinase, U/L 132·5 (62·0–219·0) 132·0 (82·0–493·0) 133·0 (61·0–189·0) 0·31 ≤185 27/40 (68%) 7/13 (54%) 20/27 (74%) 0·21 >185 13/40 (33%) 6/13 (46%) 7/27 (26%) ·· Lactate dehydrogenase, U/L 286·0 (242·0–408·0) 400·0 (323·0–578·0) 281·0 (233·0–357·0) 0·0044 ≤245 11/40 (28%) 1/13 (8%) 10/27 (37%) 0·036 >245 29/40 (73%) 12/13 (92%) 17/27 (63%) ·· Hypersensitive troponin I, pg/mL 3·4 (1·1–9·1) 3·3 (3·0–163·0) 3·5 (0·7–5·4) 0·075 >28 (99th percentile) 5/41 (12%) 4/13 (31%) 1/28 (4%) 0·017 Procalcitonin, ng/mL 0·1 (0·1–0·1) 0·1 (0·1–0·4) 0·1 (0·1–0·1) 0·031 <0·1 27/39 (69%) 6/12 (50%) 21/27 (78%) 0·029 ≥0·1 to <0·25 7/39 (18%) 3/12 (25%) 4/27 (15%) ·· ≥0·25 to <0·5 2/39 (5%) 0/12 2/27 (7%) ·· ≥0·5 3/39 (8%) 3/12 (25%)* 0/27 ·· Bilateral involvement of chest radiographs 40/41 (98%) 13/13 (100%) 27/28 (96%) 0·68 Cycle threshold of respiratory tract 32·2 (31·0–34·5) 31·1 (30·0–33·5) 32·2 (31·1–34·7) 0·39 Data are median (IQR) or n/N (%), where N is the total number of patients with available data. p values comparing ICU care and no ICU care are from χ², Fisher’s exact test, or Mann-Whitney U test. 2019-nCoV=2019 novel coronavirus. ICU=intensive care unit. *Complicated typical secondary infection during the first hospitalisation. Table 2: Laboratory findings of patients infected with 2019-nCoV on admission to hospital