正在加载图片...

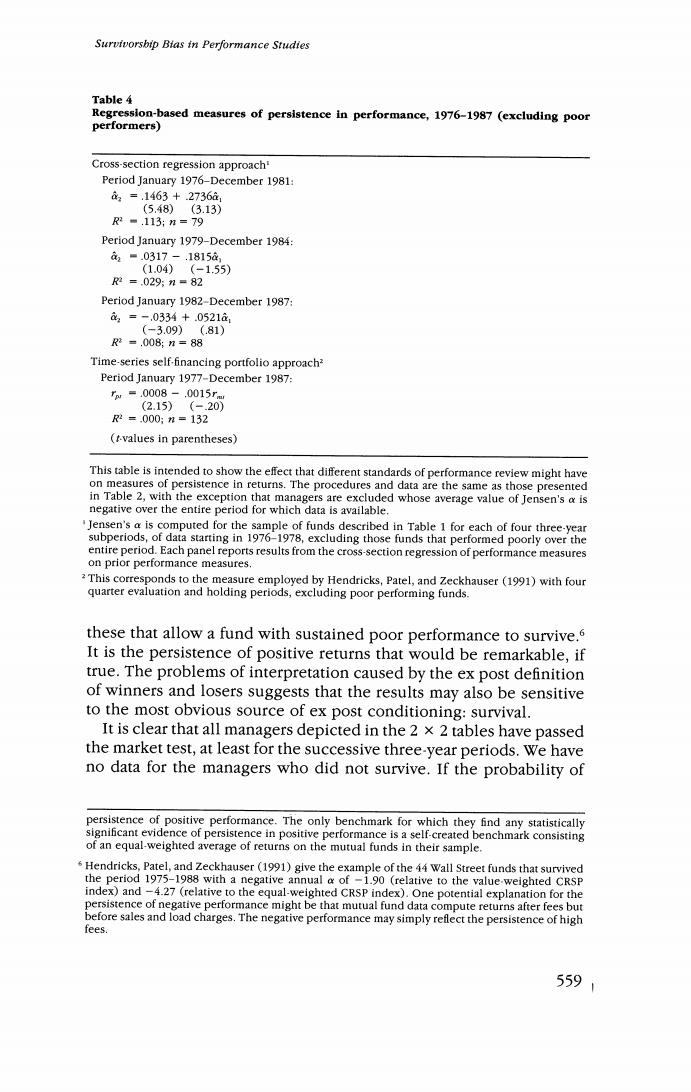
Survivorsbip Bias in Performance Studies Table 4 Regression-based measures of persistence in performance,1976-1987(excluding poor performers) Cross-section regression approach' Period January 1976-December 1981: 2=.1463+.2736à1 (5.48)(3.13) R2=.113;n=79 Period January 1979-December 1984: a■.0317-.18158 (1.04)(-1.55) 2=.029:n=82 Period January 1982-December 1987: 3=-.0334+.0521a (-3.09)(.81) R2=.008:n=88 Time-series self-financing portfolio approach? Period January 1977-December 1987: rw=.0008.-,0015rm (2.15)(-.20) 2=.000:n=132 (t-values in parentheses) This table is intended to show the effect that different standards of performance review might have on measures of persistence in returns.The procedures and data are the same as those presented in Table 2,with the exception that managers are excluded whose average value of Jensen's a is negative over the entire period for which data is available. "Jensen's a is computed for the sample of funds described in Table 1 for each of four three-year subperiods,of data starting in 1976-1978,excluding those funds that performed poorly over the entire period.Each panel reports results from the cross-section regression of performance measures on prior performance measures. This corresponds to the measure employed by Hendricks,Patel,and Zeckhauser (1991)with four quarter evaluation and holding periods,excluding poor performing funds. these that allow a fund with sustained poor performance to survive.6 It is the persistence of positive returns that would be remarkable,if true.The problems of interpretation caused by the ex post definition of winners and losers suggests that the results may also be sensitive to the most obvious source of ex post conditioning:survival. It is clear that all managers depicted in the 2 x 2 tables have passed the market test,at least for the successive three-year periods.We have no data for the managers who did not survive.If the probability of persistence of positive performance.The only benchmark for which they find any statistically significant evidence of persistence in positive performance is a self-created benchmark consisting of an equal-weighted average of returns on the mutual funds in their sample. Hendricks,Patel,and Zeckhauser(1991)give the example of the 44 Wall Street funds that survived the period 1975-1988 with a negative annual a of -1.90 (relative to the value-weighted CRSP index)and -4.27 (relative to the equal-weighted CRSP index).One potential explanation for the persistence of negative performance might be that mutual fund data compute returns after fees but before sales and load charges.The negative performance may simply reflect the persistence of high fees. 5591