正在加载图片...
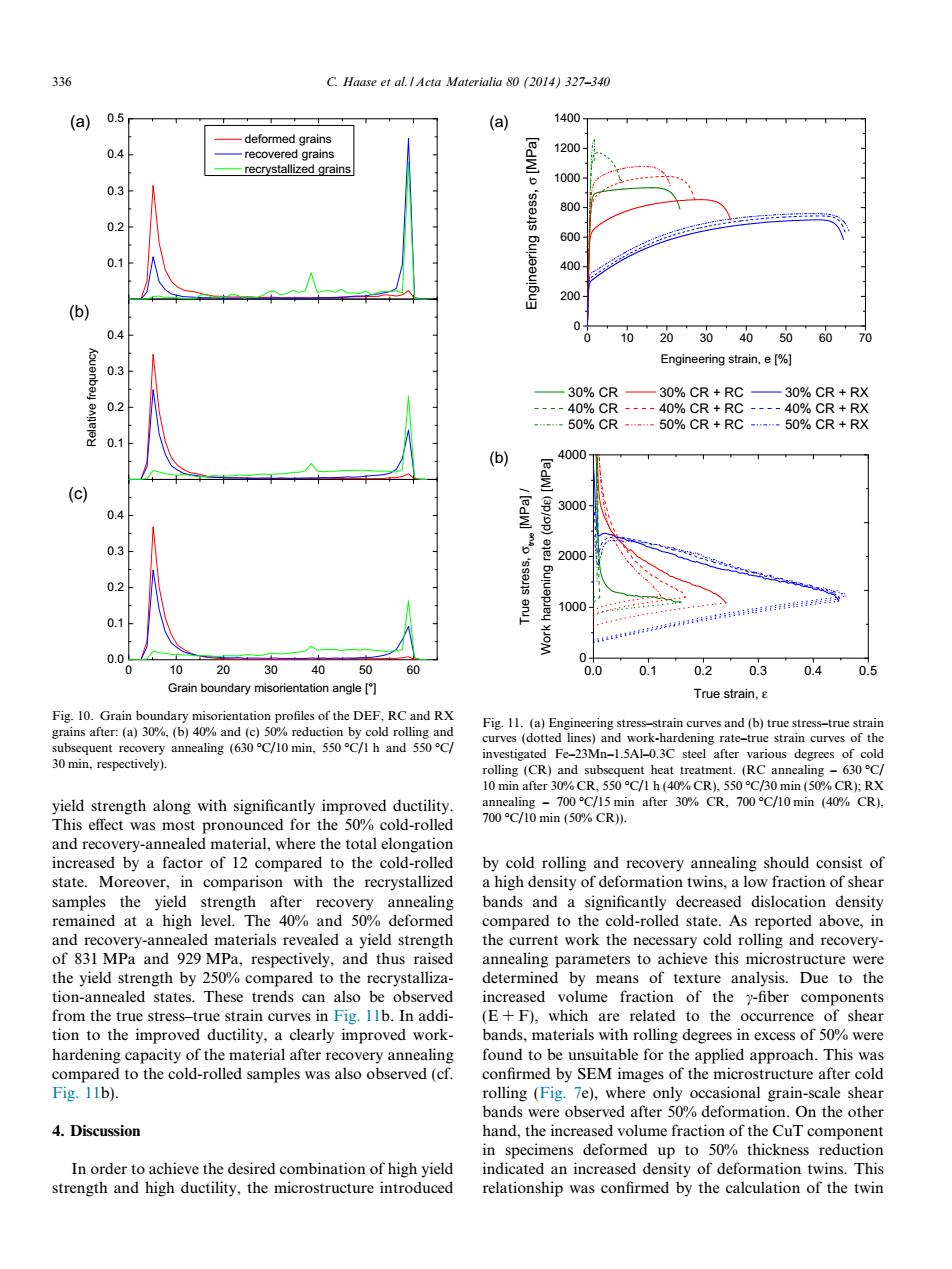
336 C.Haase et al.Acta Materialia 80 (2014)327-340 (a) 0.5 (a) 1400 deformed grains 0.4 -recovered grains 1200 -recrystallized grains 1000 0.3 800 0.2 600 0.1 400 200 (b) 0.4 0 10 2030405060 70 Engineering strain,e[%] 0.3 —30%CR—30%CR+RC —30%CR+RX 02 ----40%CR----40%CR+RC----40%CR+RX ---50%CR---50%CR+RC---50%CR+RX 0.1 (b) 4000 (c) 3000 0.4 0.3 2000 g 0.2 1000 0.1 0.0 0 10 20 30 40 50 60 0.0 0.1 0.2 0.3 0.4 0.5 Grain boundary misorientation angle[] True strain,2 Fig.10.Grain boundary misorientation profiles of the DEF,RC and RX grains after:(a)30%.(b)40%and (c)50%reduction by cold rolling and Fig.11.(a)Engineering stress-strain curves and(b)true stress-true strain subsequent recovery annealing (630C/10 min,550C/1 h and 550C/ curves (dotted lines)and work-hardening rate-true strain curves of the 30 min,respectively) investigated Fe-23Mn-1.5Al-0.3C steel after various degrees of cold rolling (CR)and subsequent heat treatment.(RC annealing-630C/ 10 min after 30%CR,550C/1 h(40%CR),550C/30 min (50%CR):RX yield strength along with significantly improved ductility annealing -700C/15 min after 30%CR,700C/10 min (40%CR). This effect was most pronounced for the 50%cold-rolled 700C10min(50%CR). and recovery-annealed material,where the total elongation increased by a factor of 12 compared to the cold-rolled by cold rolling and recovery annealing should consist of state.Moreover,in comparison with the recrystallized a high density of deformation twins,a low fraction of shear samples the yield strength after recovery annealing bands and a significantly decreased dislocation density remained at a high level.The 40%and 50%deformed compared to the cold-rolled state.As reported above,in and recovery-annealed materials revealed a yield strength the current work the necessary cold rolling and recovery- of 831 MPa and 929 MPa,respectively,and thus raised annealing parameters to achieve this microstructure were the yield strength by 250%compared to the recrystalliza- determined by means of texture analysis.Due to the tion-annealed states.These trends can also be observed increased volume fraction of the y-fiber components from the true stress-true strain curves in Fig.I1b.In addi- (E+F),which are related to the occurrence of shear tion to the improved ductility,a clearly improved work- bands,materials with rolling degrees in excess of 50%were hardening capacity of the material after recovery annealing found to be unsuitable for the applied approach.This was compared to the cold-rolled samples was also observed (cf. confirmed by SEM images of the microstructure after cold Fig.11b). rolling (Fig.7e),where only occasional grain-scale shear bands were observed after 50%deformation.On the other 4.Discussion hand,the increased volume fraction of the CuT component in specimens deformed up to 50%thickness reduction In order to achieve the desired combination of high yield indicated an increased density of deformation twins.This strength and high ductility,the microstructure introduced relationship was confirmed by the calculation of the twinyield strength along with significantly improved ductility. This effect was most pronounced for the 50% cold-rolled and recovery-annealed material, where the total elongation increased by a factor of 12 compared to the cold-rolled state. Moreover, in comparison with the recrystallized samples the yield strength after recovery annealing remained at a high level. The 40% and 50% deformed and recovery-annealed materials revealed a yield strength of 831 MPa and 929 MPa, respectively, and thus raised the yield strength by 250% compared to the recrystallization-annealed states. These trends can also be observed from the true stress–true strain curves in Fig. 11b. In addition to the improved ductility, a clearly improved workhardening capacity of the material after recovery annealing compared to the cold-rolled samples was also observed (cf. Fig. 11b). 4. Discussion In order to achieve the desired combination of high yield strength and high ductility, the microstructure introduced by cold rolling and recovery annealing should consist of a high density of deformation twins, a low fraction of shear bands and a significantly decreased dislocation density compared to the cold-rolled state. As reported above, in the current work the necessary cold rolling and recoveryannealing parameters to achieve this microstructure were determined by means of texture analysis. Due to the increased volume fraction of the c-fiber components (E + F), which are related to the occurrence of shear bands, materials with rolling degrees in excess of 50% were found to be unsuitable for the applied approach. This was confirmed by SEM images of the microstructure after cold rolling (Fig. 7e), where only occasional grain-scale shear bands were observed after 50% deformation. On the other hand, the increased volume fraction of the CuT component in specimens deformed up to 50% thickness reduction indicated an increased density of deformation twins. This relationship was confirmed by the calculation of the twin 0.1 0.2 0.3 0.4 0.5 0.1 0.2 0.3 0.4 0 10 20 30 40 50 60 0.0 0.1 0.2 0.3 0.4 deformed grains recovered grains recrystallized grains (a) Relative frequency (b) Grain boundary misorientation angle [°] (c) Fig. 10. Grain boundary misorientation profiles of the DEF, RC and RX grains after: (a) 30%, (b) 40% and (c) 50% reduction by cold rolling and subsequent recovery annealing (630 C/10 min, 550 C/1 h and 550 C/ 30 min, respectively). 0 10 20 30 40 50 60 70 0 200 400 600 800 1000 1200 1400 Engineering stress, σ [MPa] Engineering strain, e [%] 0.0 0.1 0.2 0.3 0.4 0.5 0 1000 2000 3000 4000 True stress, σtrue [MPa] / Work hardening rate (d σ/dε) [MPa] True strain, ε 30% CR 30% CR + RC 30% CR + RX 40% CR 40% CR + RC 40% CR + RX 50% CR 50% CR + RC 50% CR + RX (a) (b) Fig. 11. (a) Engineering stress–strain curves and (b) true stress–true strain curves (dotted lines) and work-hardening rate–true strain curves of the investigated Fe–23Mn–1.5Al–0.3C steel after various degrees of cold rolling (CR) and subsequent heat treatment. (RC annealing – 630 C/ 10 min after 30% CR, 550 C/1 h (40% CR), 550 C/30 min (50% CR); RX annealing – 700 C/15 min after 30% CR, 700 C/10 min (40% CR), 700 C/10 min (50% CR)). 336 C. Haase et al. / Acta Materialia 80 (2014) 327–340���������