正在加载图片...
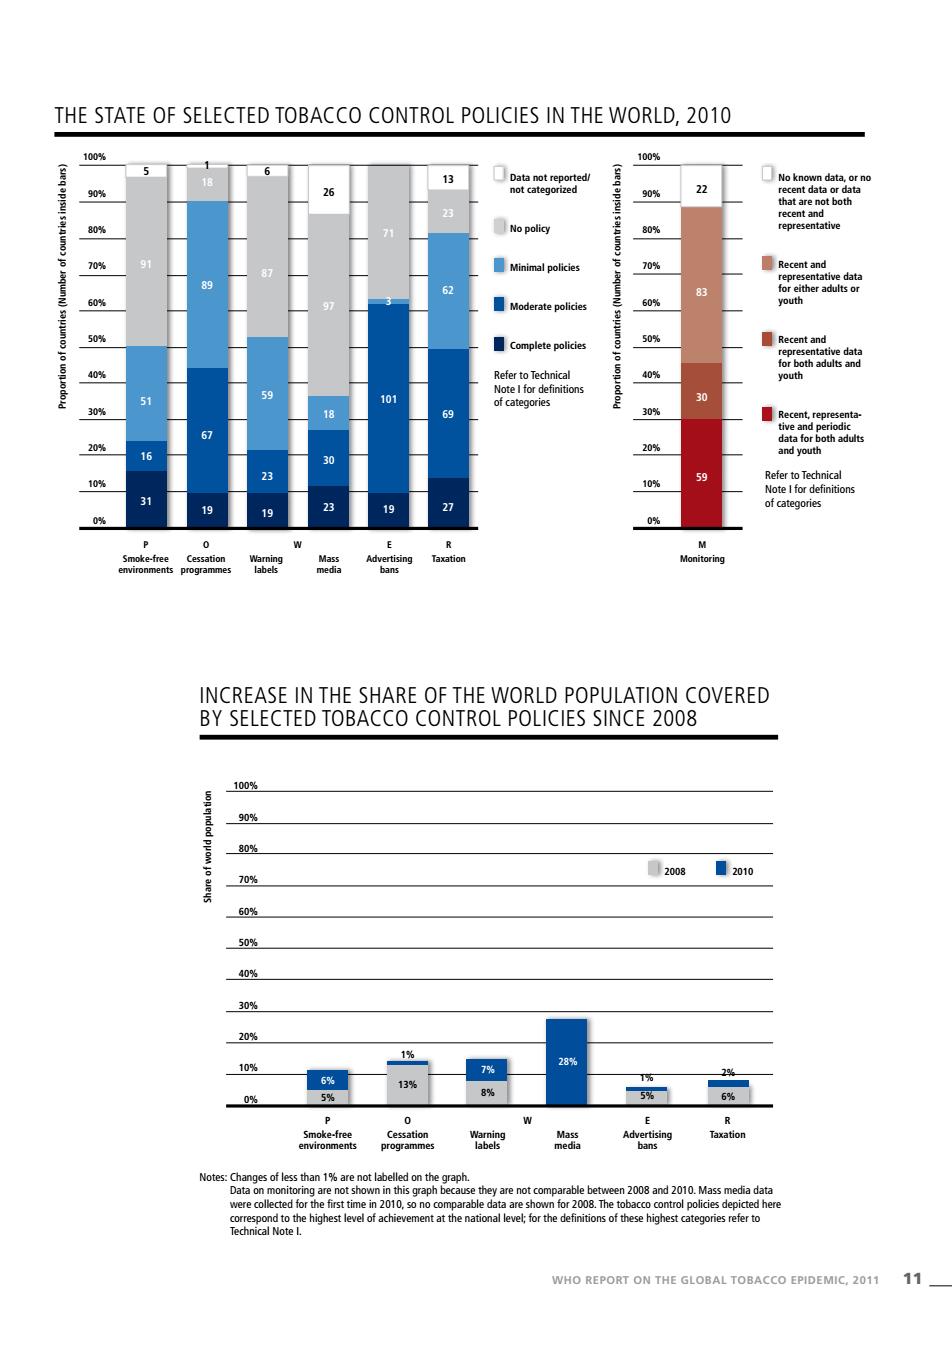
THE STATE OF SELECTED TOBACCO CONTROL POLICIES IN THE WORLD,2010 100% 100% 3 No known data,orno 90% 90% 22 recent data or data that are not both recent and 80% No policy 80% representative 70% 70% 87 夏Recent and representative data 89 62 83 for either adults or 60% 97 60% youth 50% ■Complete police 50% Recent and nt ative data 40% Refer to Technical 40% youth 51 59 Note I for definitions 101 of categories 30 30% 18 69 30% ■Recent,representa- tive and periodic 67 data for both adults 20% 6 20% and youth 10% 13 10% 59 Refer to Technical Note I for definitions 19 of categories 0% 0% 0 E R M Smoke-free Cessation Advertising Monitoring INCREASE IN THE SHARE OF THE WORLD POPULATION COVERED BY SELECTED TOBACCO CONTROL POLICIES SINCE 2008 100% 90% 80% 70% 0208■2010 60% 50% 40% 309% 20% 1% 10% 28% 7% 6% 13% 1% 24 8% 0% 5% 5% 6% P 0 E R Smoke-free Cessation Warning Mass Advertising Taxation environments programmes labels media bans Notes:Changes of less than 1%are not labelled on the graph. Data on monitoring are not shown in this graph because they are not comparable between 2008 and 2010.Mass media data were collected for the first time in 2010,so no comparable data are shown for 2008.The tobacco control policies depicted here correspond to the highest level of achievement at the national level;for the definitions of these highest categories refer to Technical Note L. WHO REPORT ON THE GLOBAL TOBACCO EPIDEMIC,2011 11WHO REPORT ON THE GLOBAL TOBACCO EPIDEMIC, 2011 11 Share of world population 100% 90% 80% 70% 60% 50% 40% 30% 20% 10% 0% E Advertising bans 5% R Taxation 6% O Cessation programmes 13% 1% 1% 2% Warning labels W 8% 7% Mass media 28% 2008 2010 P Smoke-free environments 6% 5% Increase in the share of the world population covered by selected tobacco control policies since 2008 Notes: Changes of less than 1% are not labelled on the graph. Data on monitoring are not shown in this graph because they are not comparable between 2008 and 2010. Mass media data were collected for the first time in 2010, so no comparable data are shown for 2008. The tobacco control policies depicted here correspond to the highest level of achievement at the national level; for the definitions of these highest categories refer to Technical Note I. P Smoke-free environments O Cessation programmes Warning labels W Mass media E Advertising bans R Taxation M Monitoring 100% 90% 80% 70% 60% 50% 40% 30% 20% 10% 0% 100% 90% 80% 70% 60% 50% 40% 30% 20% 10% 0% Proportion of countries (Number of countries inside bars) Proportion of countries (Number of countries inside bars) No known data, or no recent data or data that are not both recent and representative Recent and representative data for either adults or youth Recent and representative data for both adults and youth Recent, representative and periodic data for both adults and youth Data not reported/ not categorized No policy Minimal policies Moderate policies Complete policies 91 51 16 31 5 83 30 59 22 18 89 67 19 1 87 59 23 19 6 97 18 30 23 26 23 62 69 27 13 71 3 101 19 The state of selected tobacco control policies in the world, 2010 Refer to Technical Note I for definitions of categories Refer to Technical Note I for definitions of categories