附录E Matlab FAO M文件的使用 使用matlab的时候,可以在“Command Window”内直接书写matlab代码,也可以将 代码保存到M文件中,然后运行该文件。使用matlab主界面菜单“File”->“New”>“M-File” 可以打开一个文本编辑器编辑M文件。M文件及matlab的代码文件,在M文件编辑器的 菜单中,选取“Debug”->“Run”即可运行。在路径设置正确的情况下,在“Command Window” 中直接输入M文件的名称可以运行M文件中的代码。 注意:M文件的取名请以英文字母开头,用字母和数字组成:不要起中文文件名称, 也不要在文件名称中使用“(”、“)”等特殊字符:M文件的名称不能和matlab系统函数重名。 Matlab常用函数 符号变量转数值变量 rho sym('(1 sqrt(n))/2) eval(rho); 多项式替换 poly2sym([1 0-2-5]) poly2sym(10-2-5],2*t+1) fread 读取文件数据 调用格式: [A.count]=fread(fid.size.precision) 从指定的文件读取二进制数据并写入矩阵A。例如: fid fopen('fread.m','r'), F=fread(fid); s=char(F) fliplr 矩阵左右反转
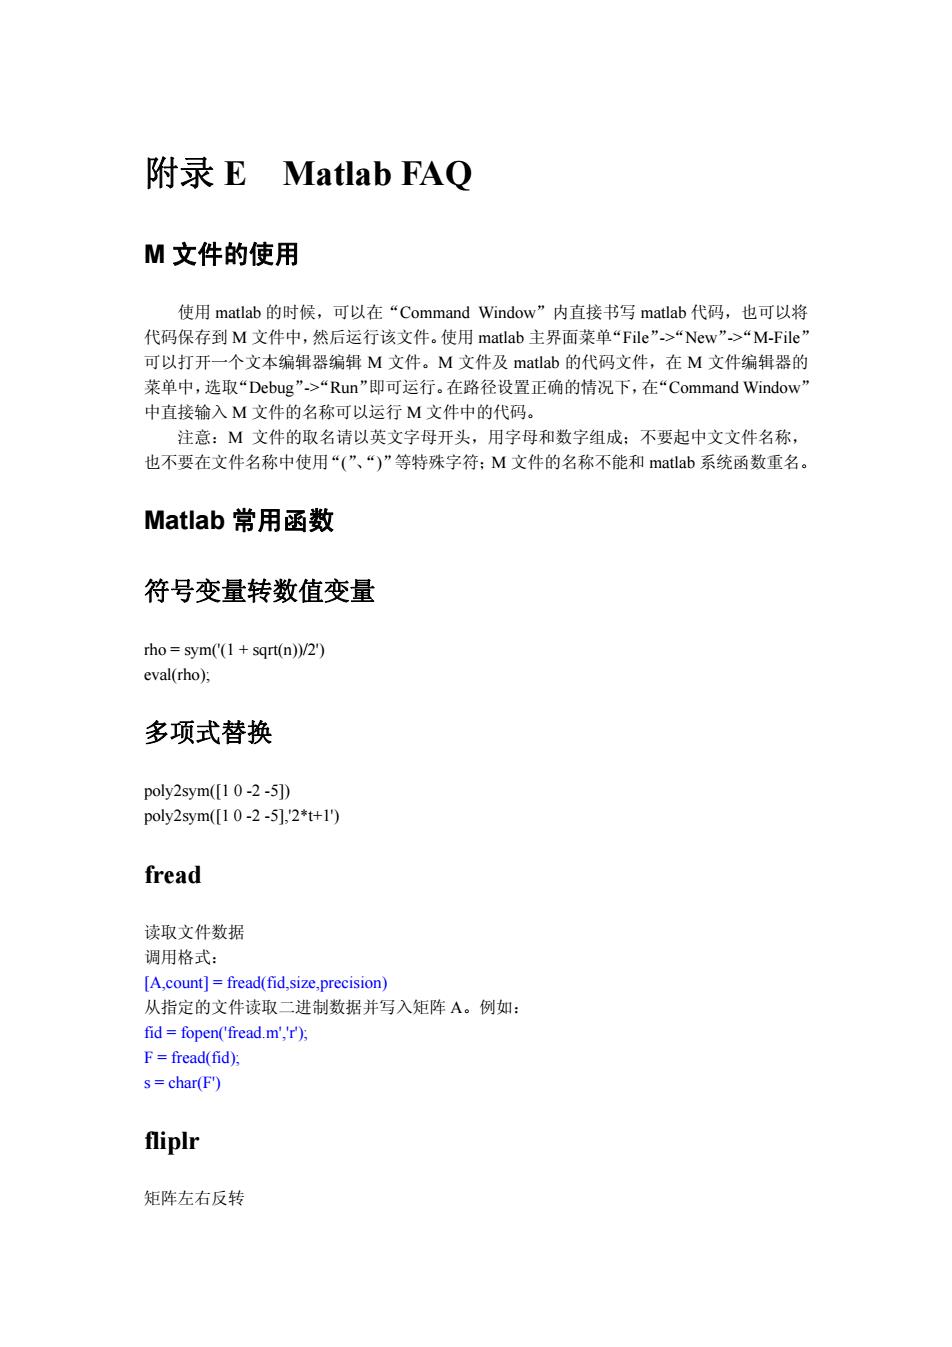
附录 E Matlab FAQ M 文件的使用 使用 matlab 的时候,可以在“Command Window”内直接书写 matlab 代码,也可以将 代码保存到 M 文件中,然后运行该文件。使用 matlab 主界面菜单“File”->“New”->“M-File” 可以打开一个文本编辑器编辑 M 文件。M 文件及 matlab 的代码文件,在 M 文件编辑器的 菜单中,选取“Debug”->“Run”即可运行。在路径设置正确的情况下,在“Command Window” 中直接输入 M 文件的名称可以运行 M 文件中的代码。 注意:M 文件的取名请以英文字母开头,用字母和数字组成;不要起中文文件名称, 也不要在文件名称中使用“(”、“)”等特殊字符;M 文件的名称不能和 matlab 系统函数重名。 Matlab 常用函数 符号变量转数值变量 rho = sym('(1 + sqrt(n))/2') eval(rho); 多项式替换 poly2sym([1 0 -2 -5]) poly2sym([1 0 -2 -5],'2*t+1') fread 读取文件数据 调用格式: [A,count] = fread(fid,size,precision) 从指定的文件读取二进制数据并写入矩阵 A。例如: fid = fopen('fread.m','r'); F = fread(fid); s = char(F') fliplr 矩阵左右反转

aaa=[123] fliplr(aaa)=[3 2 1] ifN==16 h fi fliplr((70]); hwi=fliplre(27.44-1.38]) h iadg fliplr([2.85 0.91]); h gan fliplr([2.04-inf]); end; x(1)*8191/32767=-950.9129: x(2)*8191/32767=-784.9281; x(3)*8191/32767=-522.4522; x(4)*8191/32767=-194.9821 x(5)*8191/32767=155.9857: x(6)*8191/32767=488.4553: matlab中如何自定义函数 在matlab中一个函数需要定义一个M文件,该文件名称和函数的名称一致。例如:我 们需要定义个函数完成两个矩阵的加法和乘法运算。函数名称为“nat plus'”,则对应写一 个名称为“mat plus.m”的M文件。“mat plus..m”文件内容如下: function [C.D]=mat plus(A.B) %Copyright2004,Testing function %矩阵加法和矩阵乘法的计算 C=A+B: D=A*B: 在“Command Window”中输入如下命令 >A=[123,456,789;%给矩阵赋值 >[C,D=mat plus(A,A)%矩阵C为矩阵A+A'的结果:D为矩阵A*A'的结果 对于上述函数,还可以测试一下如下命令行的运行结果 >>help mat_plus matlab的矩阵运算函数 如果想了解MATLAB中有关矩阵的操作运算函数,可以键入: >>help matfun 在开始使用matlab之前,建议运行以下代码来了解matlab的矩阵(数组)运算的基本概念。 A=123:456,7891;%给矩阵赋值 A(1) %查看矩阵A的第一个元素 1
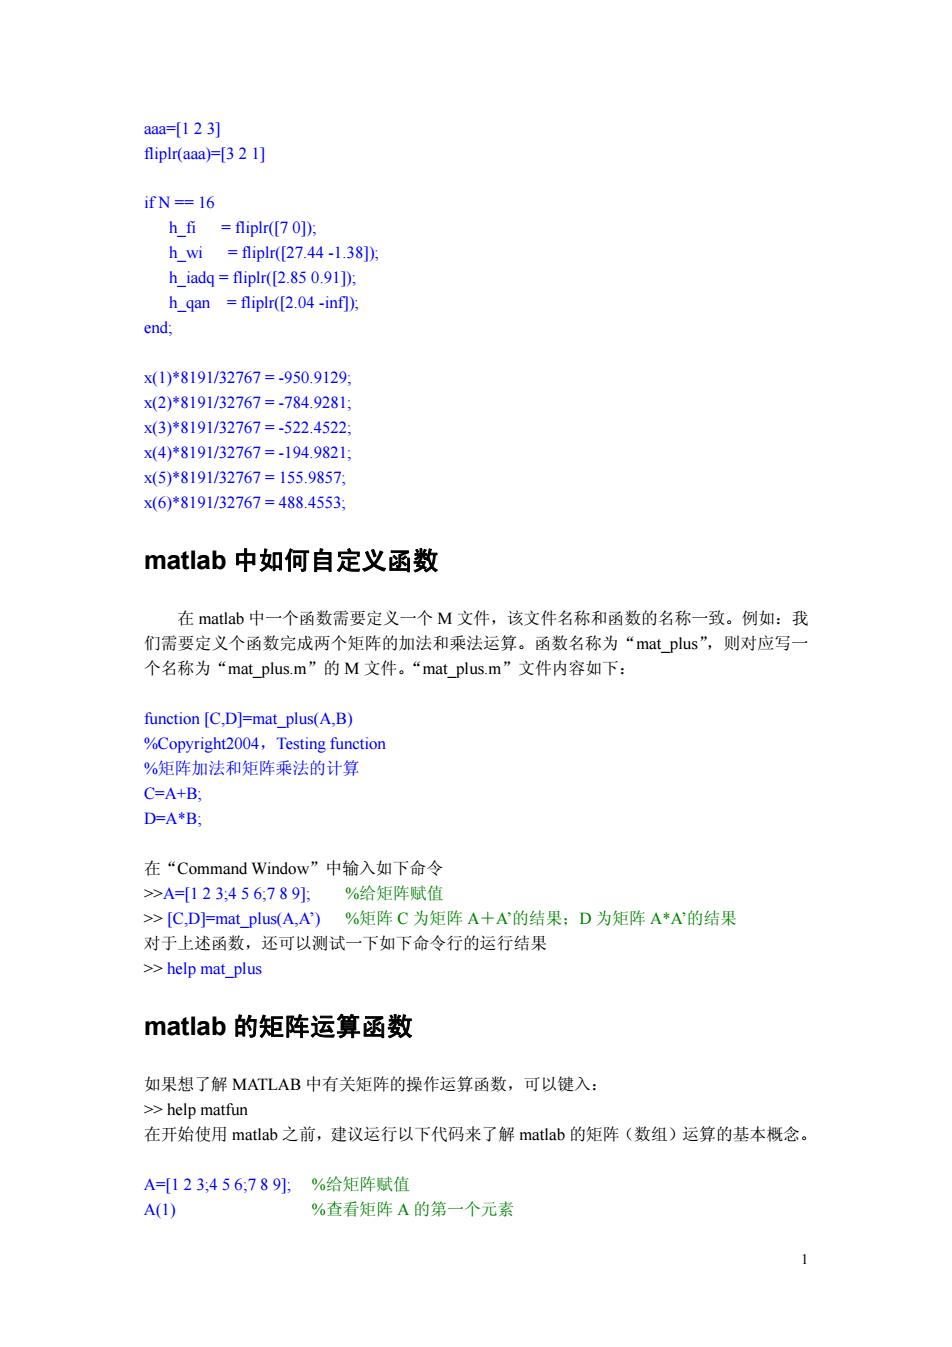
aaa=[1 2 3] fliplr(aaa)=[3 2 1] if N == 16 h_fi = fliplr([7 0]); h_wi = fliplr([27.44 -1.38]); h_iadq = fliplr([2.85 0.91]); h_qan = fliplr([2.04 -inf]); end; x(1)*8191/32767 = -950.9129; x(2)*8191/32767 = -784.9281; x(3)*8191/32767 = -522.4522; x(4)*8191/32767 = -194.9821; x(5)*8191/32767 = 155.9857; x(6)*8191/32767 = 488.4553; matlab 中如何自定义函数 在 matlab 中一个函数需要定义一个 M 文件,该文件名称和函数的名称一致。例如:我 们需要定义个函数完成两个矩阵的加法和乘法运算。函数名称为“mat_plus”,则对应写一 个名称为“mat_plus.m”的 M 文件。“mat_plus.m”文件内容如下: function [C,D]=mat_plus(A,B) %Copyright2004,Testing function %矩阵加法和矩阵乘法的计算 C=A+B; D=A*B; 在“Command Window”中输入如下命令 >>A=[1 2 3;4 5 6;7 8 9]; %给矩阵赋值 >> [C,D]=mat_plus(A,A’) %矩阵 C 为矩阵 A+A’的结果;D 为矩阵 A*A’的结果 对于上述函数,还可以测试一下如下命令行的运行结果 >> help mat_plus matlab 的矩阵运算函数 如果想了解 MATLAB 中有关矩阵的操作运算函数,可以键入: >> help matfun 在开始使用 matlab 之前,建议运行以下代码来了解 matlab 的矩阵(数组)运算的基本概念。 A=[1 2 3;4 5 6;7 8 9]; %给矩阵赋值 A(1) %查看矩阵 A 的第一个元素 1

A(9) %查看矩阵A的第9个元素 B=A'; %求矩阵A的转置 B %查看矩阵B的内容 C=A+B' %矩阵的加法运算 C %查看矩阵C的内容 C=A(1,) %C的内容为矩阵A的第一行 C=A(2,:) %C的内容为矩阵A的第2行 C=A(:,1) %C的内容为矩阵A的第一列 C=A(,3) %C的内容为矩阵A的第3列 下表列出matlab中常用的矩阵运算函数。 表0-1常用线性代数函数 B=A' 矩阵转置 C=A+B 矩阵相加 C=A*B 矩阵相乘 C=Ak 矩阵幂 C=A.*B 矩阵点乘,即两维数相同的矩阵各对应元素相乘 expm(A) 指数矩阵,也就是eA inv(A) 矩阵的逆矩阵 det(A) 矩阵的行列式的值 rank(A) 计算矩阵的秩 eig(A) 矩阵的特征值 [X,D]-eig(A) 矩阵的特征向量X和以特征值为元素的对角阵D p=poly(A) 矩阵的特征多项式 r=roots(p) 特征多项式方程的根 conv(pl,p2) 两多项式相乘 图形界面的实现 %各种对话框的使用 handle helpdlg(hi''test') handle warndlg('hi','test') handle errordlg('hi','test','on') handle questdlg('Input a:','yes',default) %设置颜色 c uisetcolor(handle,'set dlg color') %打开文件对话框,获取文件名称和路径 [name,path]=uigetfile(*.m','Open test...'); [name,path]=uiputfile(*.m','Open test...); 2
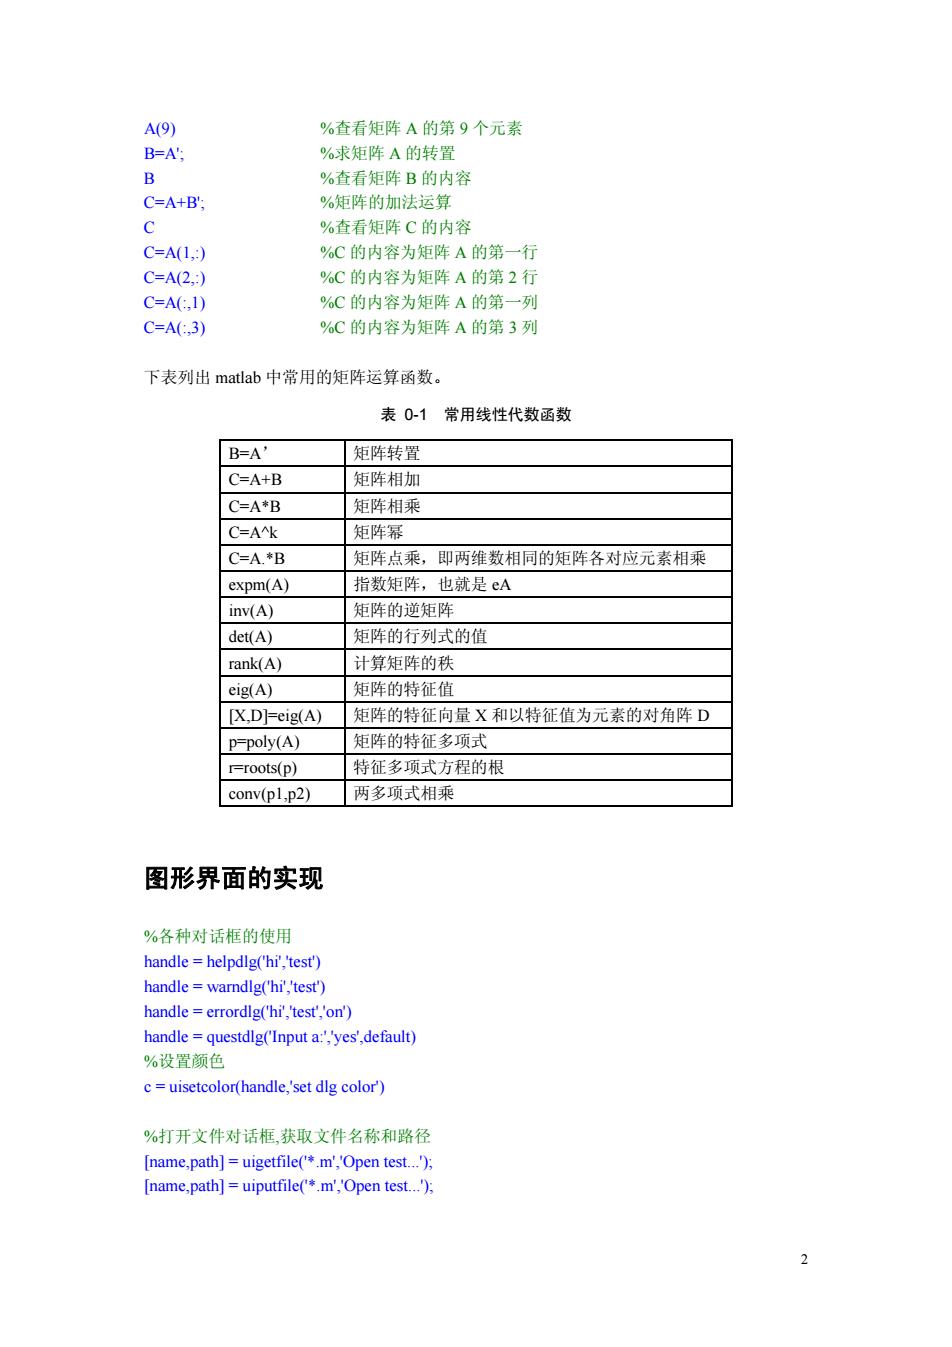
A(9) %查看矩阵 A 的第 9 个元素 B=A'; %求矩阵 A 的转置 B %查看矩阵 B 的内容 C=A+B'; %矩阵的加法运算 C %查看矩阵 C 的内容 C=A(1,:) %C 的内容为矩阵 A 的第一行 C=A(2,:) %C 的内容为矩阵 A 的第 2 行 C=A(:,1) %C 的内容为矩阵 A 的第一列 C=A(:,3) %C 的内容为矩阵 A 的第 3 列 下表列出 matlab 中常用的矩阵运算函数。 表 0-1 常用线性代数函数 B=A’ 矩阵转置 C=A+B 矩阵相加 C=A*B 矩阵相乘 C=A^k 矩阵幂 C=A.*B 矩阵点乘,即两维数相同的矩阵各对应元素相乘 expm(A) 指数矩阵,也就是 eA inv(A) 矩阵的逆矩阵 det(A) 矩阵的行列式的值 rank(A) 计算矩阵的秩 eig(A) 矩阵的特征值 [X,D]=eig(A) 矩阵的特征向量 X 和以特征值为元素的对角阵 D p=poly(A) 矩阵的特征多项式 r=roots(p) 特征多项式方程的根 conv(p1,p2) 两多项式相乘 图形界面的实现 %各种对话框的使用 handle = helpdlg('hi','test') handle = warndlg('hi','test') handle = errordlg('hi','test','on') handle = questdlg('Input a:','yes',default) %设置颜色 c = uisetcolor(handle,'set dlg color') %打开文件对话框,获取文件名称和路径 [name,path] = uigetfile('*.m','Open test...'); [name,path] = uiputfile('*.m','Open test...'); 2

%菜单操作 Hm_ex=uimenu(gcf,'Label',程序) Hm exgrid=uimenu(Hmex,'Labe,'测试,'Callback','Grid') Hm exview=uimenu(Hm ex,'Label','View'); Hm_ex2d=uimenu(Hm_exview,'Label',二维',Callback',view(2; Hmex3d=uimenu(Hm exview,Label",'三维',Callback','View(3g Matlab绘图示例 示例一(用plot同时绘制两条曲线) x=0:0.01:2*pi plot(x,sin(x),'green') hold on plot(x.sin(2*x).'red') 示例二(用stem绘制多个序列) n=0:50: A=444.128 a=50*sqrt(2.0)*pi; T=0.001: w0=50*sqrt(2.0)*pi x=444.128*exp(-a*n*T).*sin(w0*n*T): X=f(x)方 Draw x,abs(X),angle(X) hold on stem(x) stem(abs(X),'fill','r-.) stem(angle(X),'fill','g-.) 示例三(从复平面看幅频特性) th=(0:127)/128*2*p X=cos(th)月 y=sin(th); f=abs(ft(ones(10,1),128): stem3(x,y,f,'d','fill') view(-6530]) xlabel(Real) ylabel('Imaginary) zlabel('Amplitude') title('Magnitude Frequency Response) rotate3d on 3
%菜单操作 Hm_ex=uimenu(gcf,'Label','程序') Hm_exgrid=uimenu(Hm_ex,'Label', '测试' , 'Callback' , 'Grid' ) Hm_exview=uimenu(Hm_ex,'Label','View ' ); Hm_ex2d=uimenu(Hm_exview,'Label','二维','Callback','view(2)'); Hm_ex3d=uimenu(Hm_exview,'Label','三维','Callback','View(3)'); Matlab 绘图示例 示例一(用 plot 同时绘制两条曲线) x=0:0.01:2*pi plot(x,sin(x),'green') hold on plot(x,sin(2*x),'red') 示例二(用 stem 绘制多个序列) n=0:50; A=444.128; a=50*sqrt(2.0)*pi; T=0.001; w0=50*sqrt(2.0)*pi; x=444.128*exp(-a*n*T).*sin(w0*n*T); X=fft(x); % Draw x,abs(X),angle(X) hold on stem(x) stem(abs(X),'fill','r-.') stem(angle(X),'fill','g-.') 示例三(从复平面看幅频特性) th = (0:127)/128*2*pi; x = cos(th); y = sin(th); f = abs(fft(ones(10,1),128)); stem3(x,y,f','d','fill') view([-65 30]) xlabel('Real') ylabel('Imaginary') zlabel('Amplitude') title('Magnitude Frequency Response') rotate3d on 3

Matlab文件操作示例 问题l:如何在matlab中读取数据文件 将如下格式的数据文件data.txt装载到内存中,并生成一个二维数组 10.00022 20.00043 30.34 输入命令“load-ascii data.txt”,此时数组data已经存在,输入命令“data”可以察看data >load -ascii data.txt >data data= 1.0000 0.0002 2.0000 2.0000 0.0004 3.0000 3.0000 0.3000 4.0000 >> 问题2:如何将数组的数据保存到数据文件? Use the Save command. Save the data in ASCII form using the save command with the-ascii option.For example, A=rand(4,3)方 save temp.dat A-ascii creates an ASCII file called temp.dat containing 1.3889088e-0012.7218792e-0014.4509643e-001 2.0276522e-0011.9881427e-0019.3181458e-001 1.9872174e-0011.5273927e-0024.6599434e-001 6.0379248e-0017.4678568e-0014.1864947e-001 用命令行查看帮助 在MATLAB的命令窗口中键入help,即可获得第一层帮助: >>help HELP topics: toolbox\local Local function library. matlabldatafun Data analysis and Fourier transform functions matlablelfun Elementary math functions. matlablelmat Elementary matrices and matrix manipulation. 4
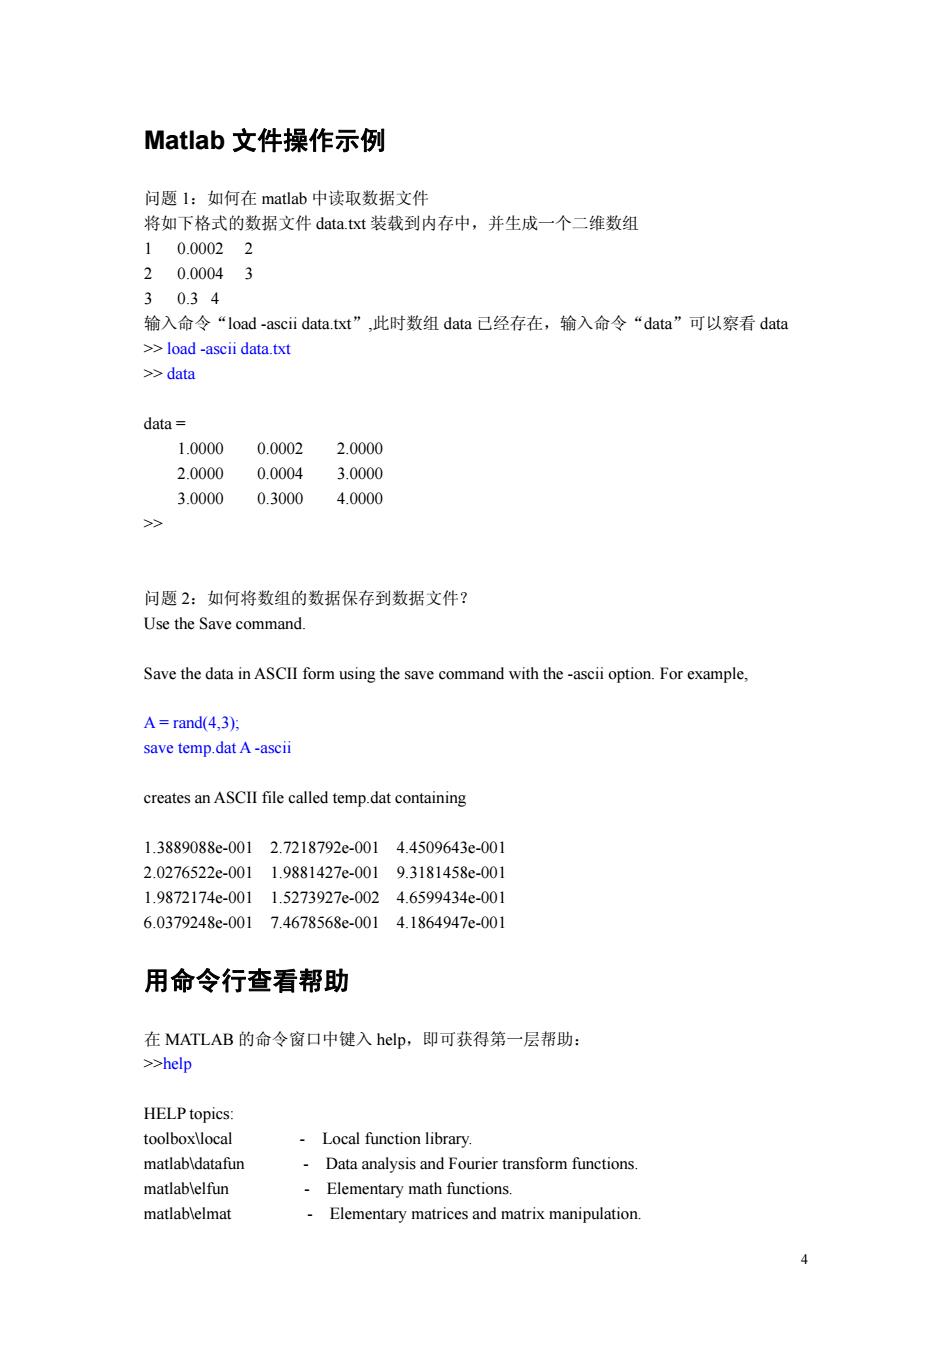
Matlab 文件操作示例 问题 1:如何在 matlab 中读取数据文件 将如下格式的数据文件 data.txt 装载到内存中,并生成一个二维数组 1 0.0002 2 2 0.0004 3 3 0.3 4 输入命令“load -ascii data.txt”,此时数组 data 已经存在,输入命令“data”可以察看 data >> load -ascii data.txt >> data data = 1.0000 0.0002 2.0000 2.0000 0.0004 3.0000 3.0000 0.3000 4.0000 >> 问题 2:如何将数组的数据保存到数据文件? Use the Save command. Save the data in ASCII form using the save command with the -ascii option. For example, A = rand(4,3); save temp.dat A -ascii creates an ASCII file called temp.dat containing 1.3889088e-001 2.7218792e-001 4.4509643e-001 2.0276522e-001 1.9881427e-001 9.3181458e-001 1.9872174e-001 1.5273927e-002 4.6599434e-001 6.0379248e-001 7.4678568e-001 4.1864947e-001 用命令行查看帮助 在 MATLAB 的命令窗口中键入 help,即可获得第一层帮助: >>help HELP topics: toolbox\local - Local function library. matlab\datafun - Data analysis and Fourier transform functions. matlab\elfun - Elementary math functions. matlab\elmat - Elementary matrices and matrix manipulation. 4

如果对MATLAB的plot函数感兴趣,想进一步了解,则键入: >>help plot PLOT Linear plot. PLOT(X,Y)plots vector Y versus vector X.If X or Y is a matrix, then the vector is plotted versus the rows or columns of the matrix, whichever line up.If X is a scalar and Y is a vector,length(Y) disconnected points are plotted. 同样,如果想了解MATLAB中有关矩阵的操作运算函数,可以键入: >>help matfun Matrix functions-numerical linear algebra. Matrix analysis. norm Matrix or vector norm. normest Estimate the matrix 2-norm. rank Matrix rank det -Determinant. trace -Sum of diagonal elements null Null space. orth -Orthogonalization. plot函数的参数 plot(X,Y,'st’)可以用不同颜色、不同符号绘制曲线,其中’st’可以是下列参数选项 的组合。 表0-2plot绘图函数的参数 y -----vellow ------poInt -----solid m----magenta o------circle -----dotted -----cvan X------X-mark ----dashdot ------red +----plus ----dashed g----green *----star ^-----triangle (up) b----blue s---square ----triangle (right) k----black v---triangle (down) p----pentagram h----hexagram 5
……. 如果对 MATLAB 的 plot 函数感兴趣,想进一步了解,则键入: >> help plot PLOT Linear plot. PLOT(X,Y) plots vector Y versus vector X. If X or Y is a matrix, then the vector is plotted versus the rows or columns of the matrix, whichever line up. If X is a scalar and Y is a vector, length(Y) disconnected points are plotted. ……. 同样,如果想了解 MATLAB 中有关矩阵的操作运算函数,可以键入: >> help matfun Matrix functions - numerical linear algebra. Matrix analysis. norm - Matrix or vector norm. normest - Estimate the matrix 2-norm. rank - Matrix rank. det - Determinant. trace - Sum of diagonal elements. null - Null space. orth - Orthogonalization. plot 函数的参数 plot(X,Y,’str’)可以用不同颜色、不同符号绘制曲线,其中’str’可以是下列参数选项 的组合。 表 0-2 plot 绘图函数的参数 y -----yellow . ------point - -----solid m ----magenta o------circle : -----dotted c -----cyan x------x-mark -. ----dashdot r ------red + ----plus -- ----dashed g ----green * ----star ^ -----triangle (up) b ----blue s ---square ----triangle (right) k ----black v ---triangle (down) p ----pentagram h ----hexagram 5