正在加载图片...
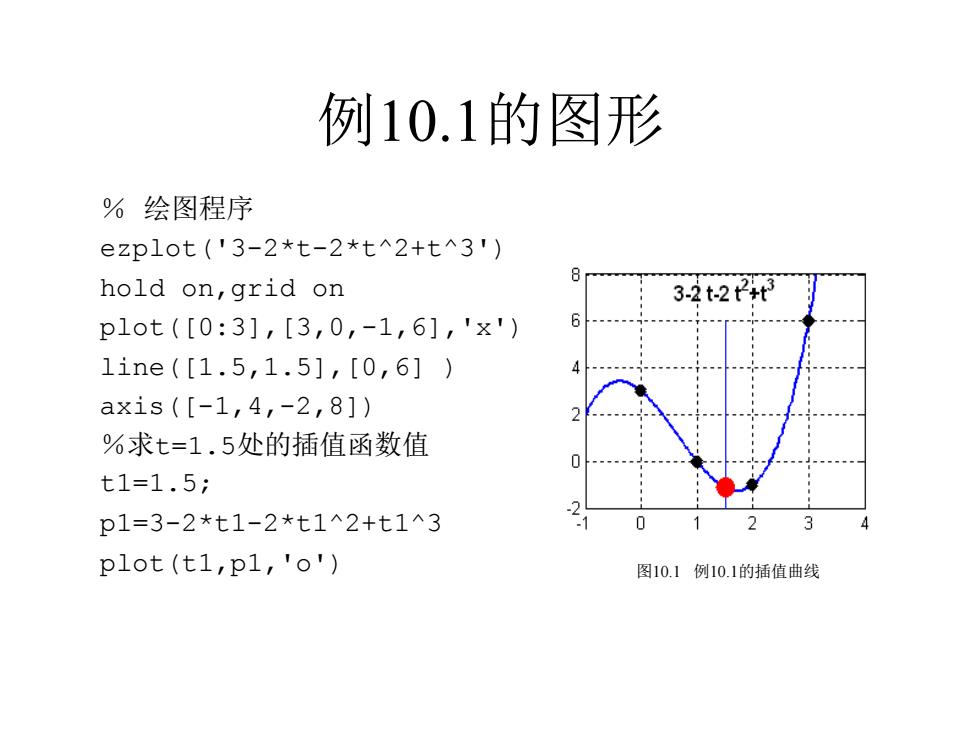
例10.1的图形 %绘图程序 ezp1ot('3-2*t-2*t^2+t^3') hold on,grid on 3-2t-2t2 p1ot([0:3],[3,0,-1,6],'x') 1ine([1.5,1.5],[0,6]) axis([-1,4,-2,8]) %求t=1.5处的插值函数值 t1=1.5: p1=3-2*t1-2*t1^2+t1^3 0 p1ot(t1,p1,'o') 图10.1例10.1的插值曲线 例10.1的图形 % 绘图程序 ezplot('3-2*t-2*t^2+t^3') hold on,grid on plot([0:3],[3,0,-1,6],'x') line([1.5,1.5],[0,6] ) axis([-1,4,-2,8]) %求t=1.5处的插值函数值 t1=1.5; p1=3-2*t1-2*t1^2+t1^3 plot(t1,p1,'o') 图10.1 例10.1的插值曲线