正在加载图片...
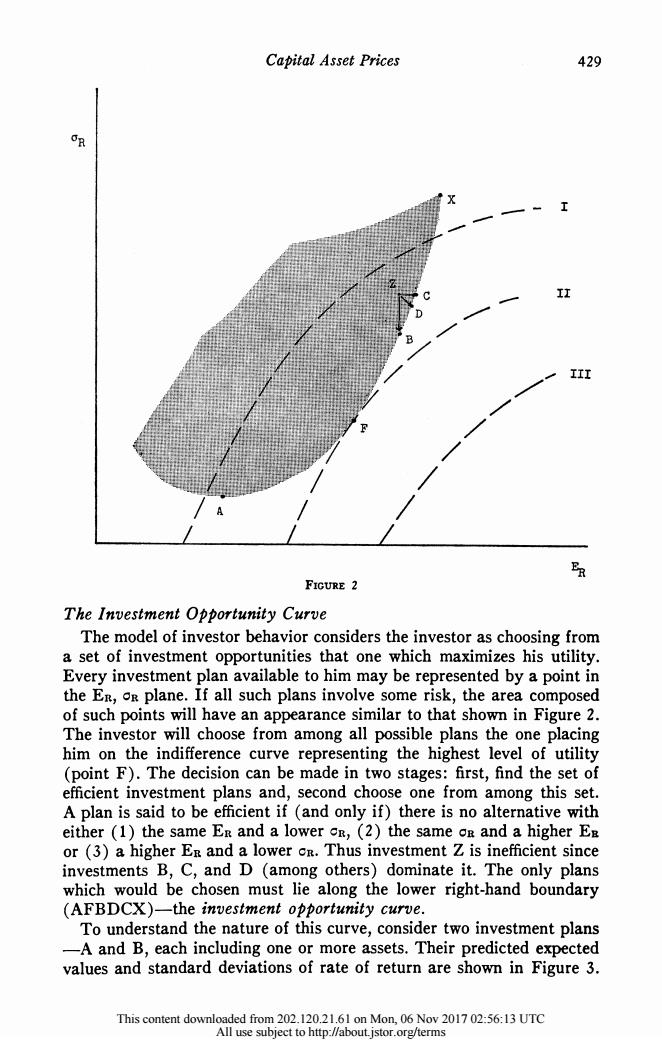
Capital Asset Prices 429 II III FIGURE 2 The Investment Opportunity Curve The model of investor behavior considers the investor as choosing from a set of investment opportunities that one which maximizes his utility. Every investment plan available to him may be represented by a point in the Er,os plane.If all such plans involve some risk,the area composed of such points will have an appearance similar to that shown in Figure 2. The investor will choose from among all possible plans the one placing him on the indifference curve representing the highest level of utility (point F).The decision can be made in two stages:first,find the set of efficient investment plans and,second choose one from among this set. A plan is said to be efficient if (and only if)there is no alternative with either (1)the same Er and a lower cr,(2)the same on and a higher E or (3)a higher Er and a lower cr.Thus investment Z is inefficient since investments B,C,and D (among others)dominate it.The only plans which would be chosen must lie along the lower right-hand boundary (AFBDCX)-the investment opportunity curve. To understand the nature of this curve,consider two investment plans -A and B,each including one or more assets.Their predicted expected values and standard deviations of rate of return are shown in Figure 3. This content downloaded from 202.120.21.61 on Mon,06 Nov 2017 02:56:13 UTC All use subject to http://about.istor.org/termsCapital Asset Prices 429 CYR The~. Ineten poruiy uv /he .. or // -7..... Thset ofinvestment opportuniti ures htoewihmsm shsuiiy Every investment plan available to him may be represented by a point in the ER, OR plane. If all such plans involve some risk, the area composed of such points will have an appearance similar to that shown in Figure 2. The investor will choose from among all possible plans the one placing him on the indifference curve representing the highest level of utility (point F). The decision can be made in two stages: first, find the set of efficient investment plans and, second choose one from among this set. A plan is said to be efficient if (and only if) there is no alternative with either (1) the same ER and a lower CR, (2) the same OR and a higher EB or (3) a higher ER and a lower CR. Thus investment Z is inefficient since investments B, C, and D (among others) dominate it. The only plans which would be chosen must lie along the lower right-hand boundary (AFBDCX)- the investment opportunity curve. To understand the nature of this curve, consider two investment plans -A and B, each including one or more assets. Their predicted expected values and standard deviations of rate of return are shown in Figure 3. This content downloaded from 202.120.21.61 on Mon, 06 Nov 2017 02:56:13 UTC All use subject to http://about.jstor.org/terms