正在加载图片...

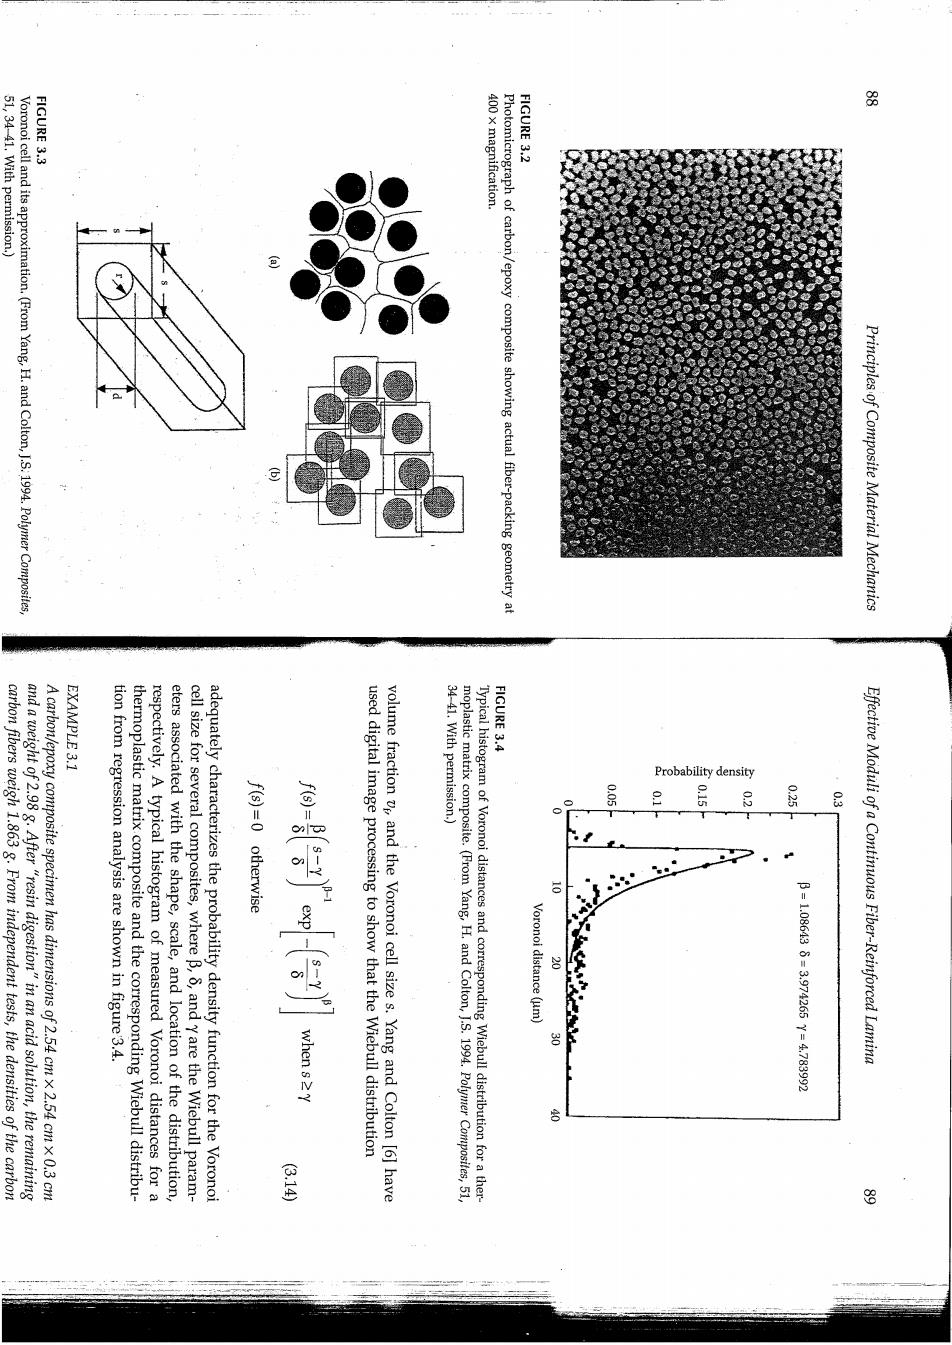
51,34-41.With permission.) FIGURE 3.3 400 x magnification FIGURE 3.2 Voronoi cell and its approximation.(From Yang,H.and Colton,J.S.1994.Polymer Composites Photomicrograph of carbon/epoxy composite showing actual fiber-packing geometry at Principles of Composite Material Mechanics EXAMPLE 3.1 FIGURE 3.4 Probability density carbon fibers weigh 1.863 g.From independent tests,the densities of the carbon and a weight of 2.98 g.After "resin digestion"in an acid solution,the remaining A carbon/epoxy composite specimen has dimensions of 2.54 cmx 2.54 cmx 0.3 cm tion from regression analysis are shown in figure 3.4. thermoplastic matrix composite and the corresponding Wiebull distribu- respectively.A typical histogram of measured Voronoi distances for a eters associated with the shape,scale,and location of the distribution, cell size for several composites,where B,5,and Y are the Wiebull param- adequately characterizes the probability density function for the Voronoi f(s)=0 otherwise when s 2Y used digital image processing to show that the Wiebull distribution volume fraction vp,and the Voronoi cell size s.Yang and Colton [6]have 34-41.With permission.) moplastic matrix composite.(From Yang,H.and Colton,J.S.1994.Polymer Composites,51 Typical histogram of Voronoi distances and corresponding Wiebull distribution for a ther 205 2 Voronoi distance (um) B10861393974265716783992 Effective Moduli of a Continuous Fiber-Reinforced Lamina 是 8