正在加载图片...
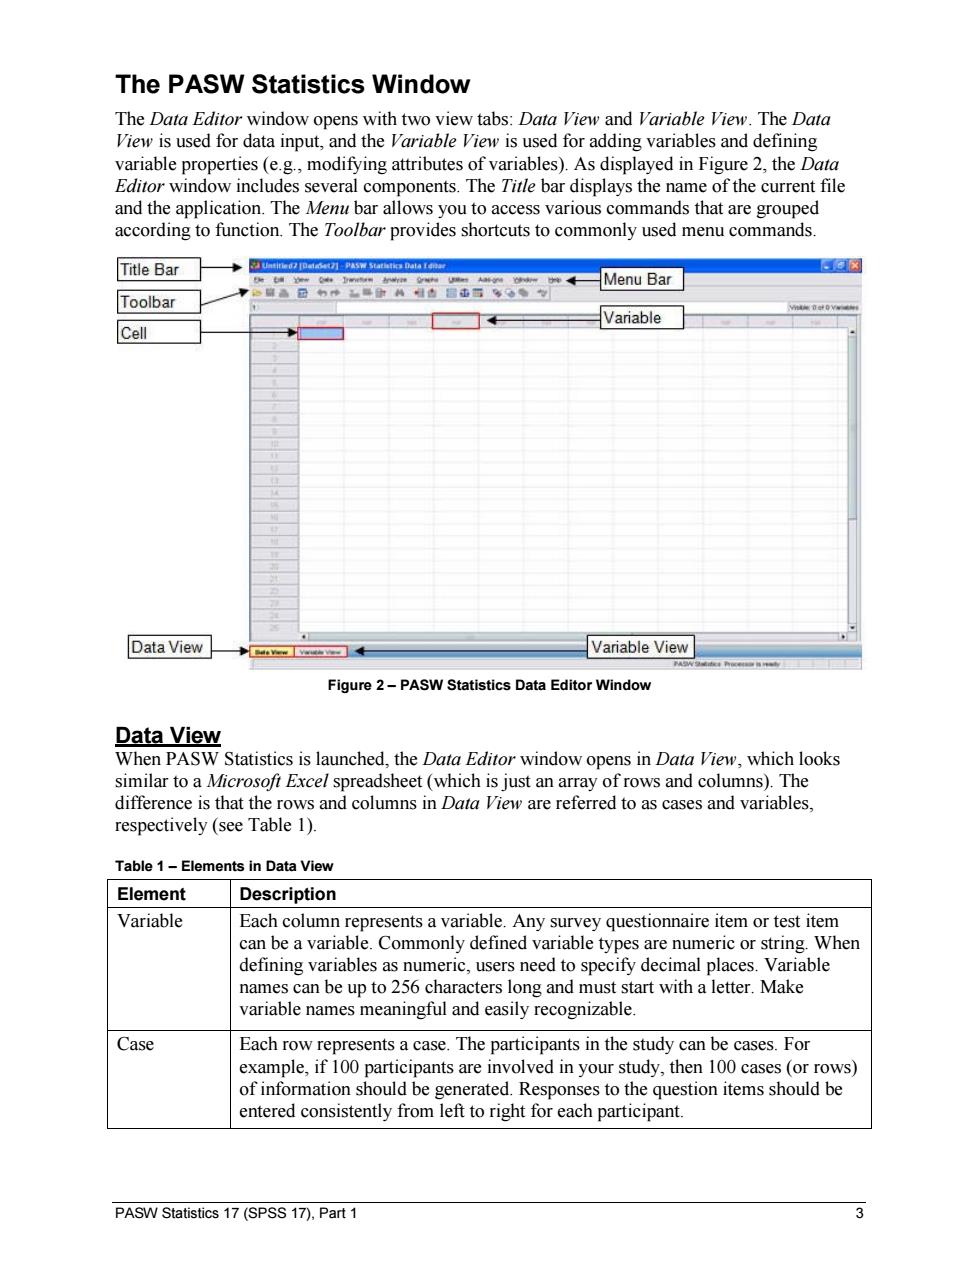
The PASW Statistics Window The Data Editor window opens with two view tabs:Data View and Variable View.The Data View is used for data input,and the Variable View is used for adding variables and defining variable properties (e.g.,modifying attributes of variables).As displayed in Figure 2,the Data Editor window includes several components.The Title bar displays the name of the current file and the application.The Menu bar allows you to access various commands that are grouped according to function.The Toolbar provides shortcuts to commonly used menu commands. Title Bar ◆IdePAS Suathties Data . Menu Bar Toolbar Variable Cell Data View Variable View Figure 2-PASW Statistics Data Editor Window Data View When PASW Statistics is launched,the Data Editor window opens in Data View,which looks similar to a Microsofi Excel spreadsheet (which is just an array of rows and columns).The difference is that the rows and columns in Data View are referred to as cases and variables, respectively (see Table 1). Table 1-Elements in Data View Element Description Variable Each column represents a variable.Any survey questionnaire item or test item can be a variable.Commonly defined variable types are numeric or string.When defining variables as numeric,users need to specify decimal places.Variable names can be up to 256 characters long and must start with a letter.Make variable names meaningful and easily recognizable. Case Each row represents a case.The participants in the study can be cases.For example,if 100 participants are involved in your study,then 100 cases (or rows) of information should be generated.Responses to the question items should be entered consistently from left to right for each participant. PASW Statistics 17(SPSS 17),Part 1 3PASW Statistics 17 (SPSS 17), Part 1 3 The PASW Statistics Window The Data Editor window opens with two view tabs: Data View and Variable View. The Data View is used for data input, and the Variable View is used for adding variables and defining variable properties (e.g., modifying attributes of variables). As displayed in Figure 2, the Data Editor window includes several components. The Title bar displays the name of the current file and the application. The Menu bar allows you to access various commands that are grouped according to function. The Toolbar provides shortcuts to commonly used menu commands. Figure 2 – PASW Statistics Data Editor Window Data View When PASW Statistics is launched, the Data Editor window opens in Data View, which looks similar to a Microsoft Excel spreadsheet (which is just an array of rows and columns). The difference is that the rows and columns in Data View are referred to as cases and variables, respectively (see Table 1). Table 1 – Elements in Data View Element Description Variable Each column represents a variable. Any survey questionnaire item or test item can be a variable. Commonly defined variable types are numeric or string. When defining variables as numeric, users need to specify decimal places. Variable names can be up to 256 characters long and must start with a letter. Make variable names meaningful and easily recognizable. Case Each row represents a case. The participants in the study can be cases. For example, if 100 participants are involved in your study, then 100 cases (or rows) of information should be generated. Responses to the question items should be entered consistently from left to right for each participant