Rangeland Sustainable Management on Tibetan Plateau Challenges and Opportunities Zhao Xin-Quan, xqzhao@nwipb.ac.cn Northwest Institute of Plateau Biology,CAS
Zhao Xin-Quan, xqzhao@nwipb.ac.cn Northwest Institute of Plateau Biology, CAS Rangeland Sustainable Management on Tibetan Plateau Challenges and Opportunities
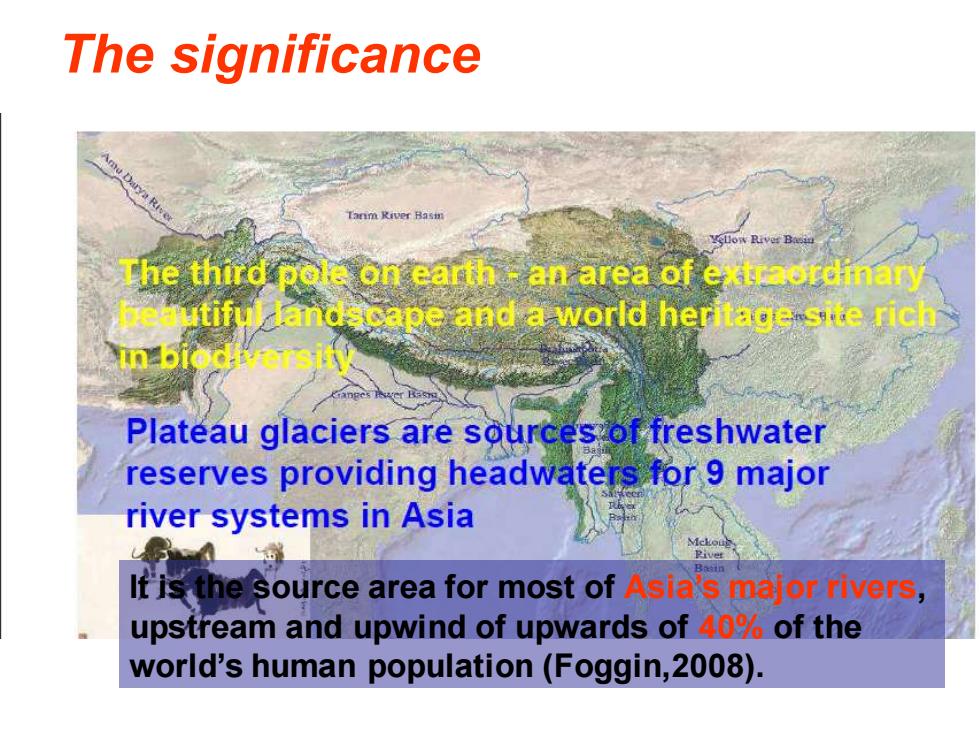
The significance Tanm River Basm The third pole on earth an area of extraordinary eutiful landscape and a world heritage site rich in biodtrsity Plateau glaciers are sources of freshwater reserves providing headwaters for 9 major river systems in Asia It'is the source area for most of Asias malornvers, upstream and upwind of upwards of 0%of the world's human population (Foggin,2008)
It is the source area for most of Asia’s major rivers, upstream and upwind of upwards of 40% of the world’s human population (Foggin,2008). The significance

The significance Total area:The 2.5 million km2-One fourth of China's territory Qinghai QI N G H A I T I B E T A N Gong P L A TE大 PLAAE
Tibetan Rangelands Total area: The 2.5 million km2—One fourth of China’s territory The significance
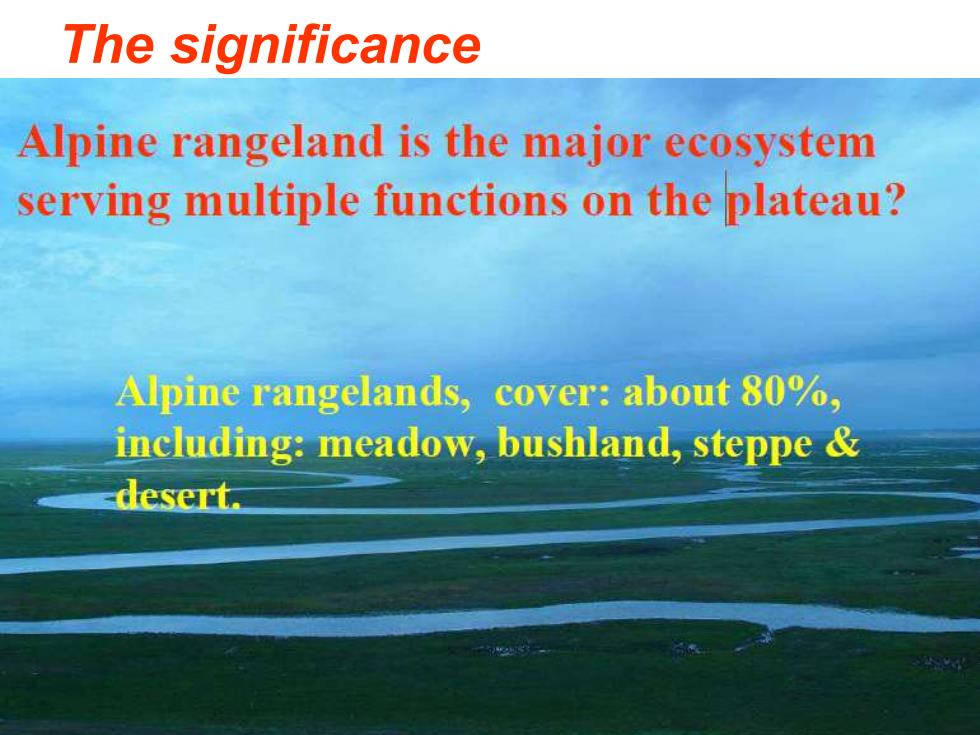
The significance Alpine rangeland is the major ecosystem serving multiple functions on the plateau? Alpine rangelands,cover:about 80%, including:meadow,bushland,steppe desert
The significance

The significance Desertification of alpine rangeland in Eastern Tibetan Plateau,Ruoergai Plateau of Sichuan Province,China Pholccoms
The significance
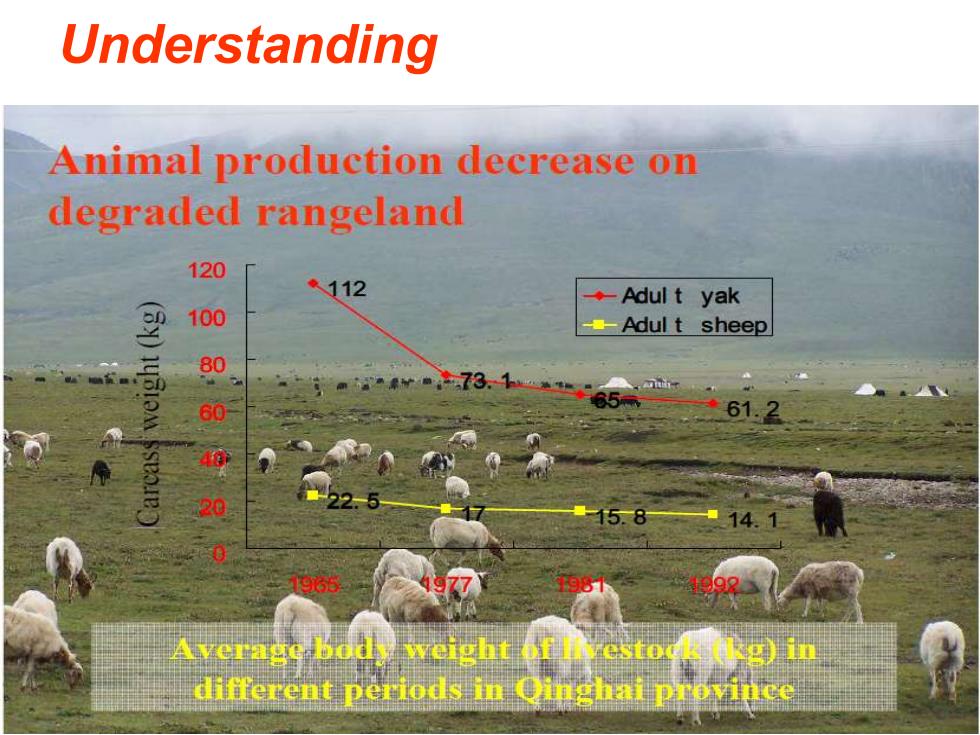
Understanding Animal production decrease on degraded rangeland 120 112 ◆Adul t yak 罗 100 -Adul t sheep 80 73165 60 61.2 40 20 15.8 14.1 1965 1977】 verage body weight of (Rg)in different periods in Qinghai province
Understanding
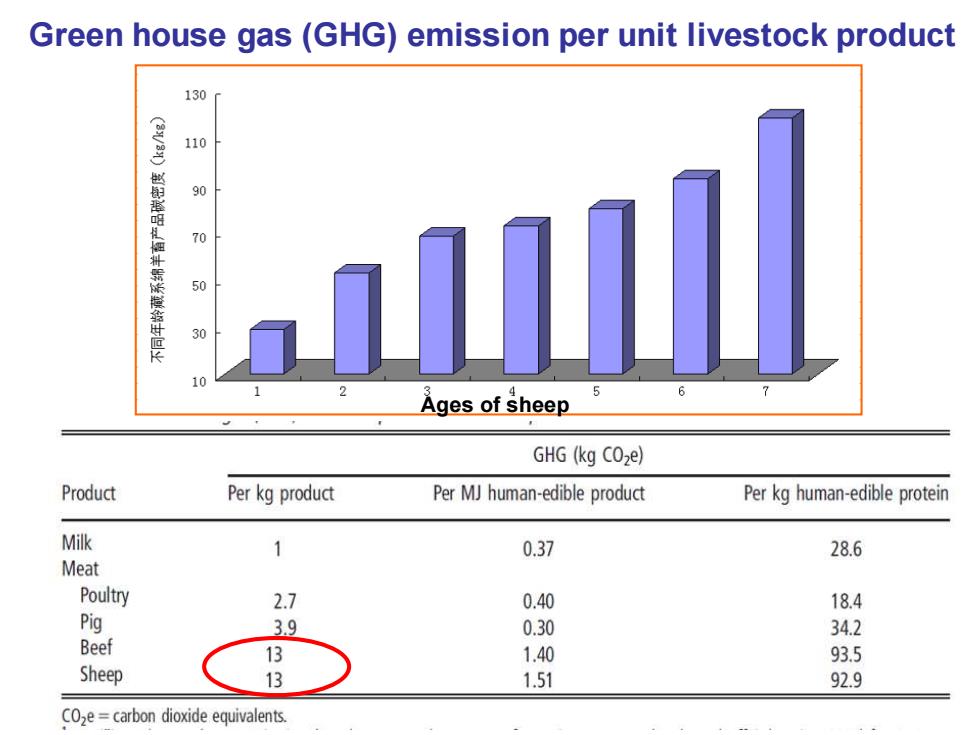
Green house gas(GHG)emission per unit livestock product 130 110 90 70 50 30 10 Ages of sheep GHG (kg COze) Product Per kg product Per MJ human-edible product Per kg human-edible protein Milk 1 0.37 28.6 Meat Poultry 2.7 0.40 18.4 Pig 3.9 0.30 34.2 Beef 13 1.40 93.5 Sheep 13 1.51 92.9 COze=carbon dioxide equivalents
Green house gas (GHG) emission per unit livestock product Ages of sheep
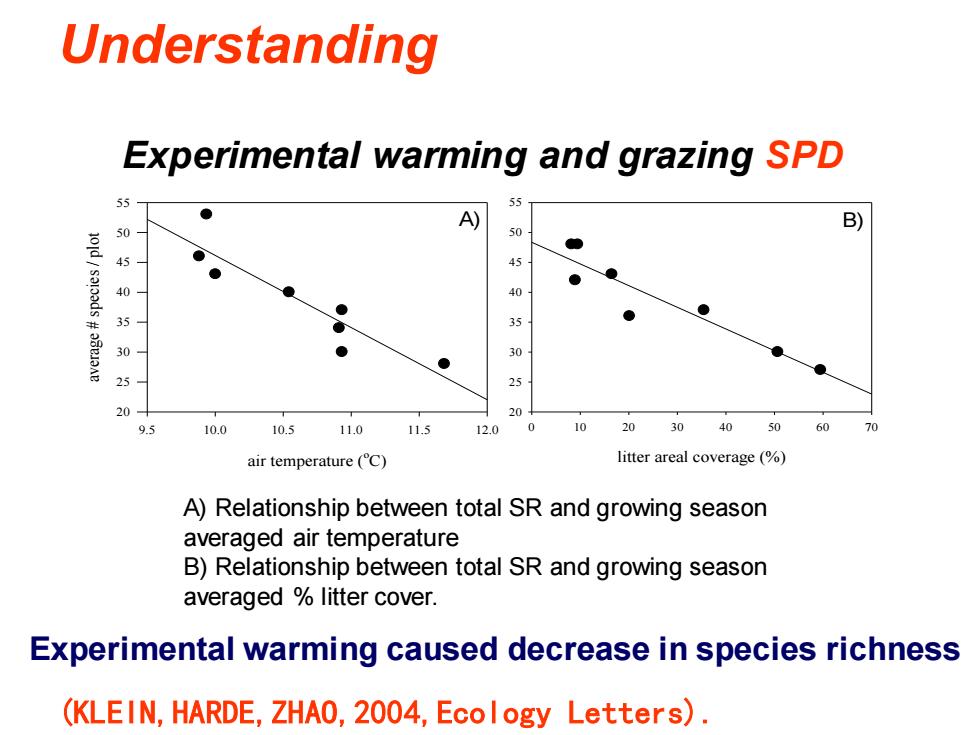
Understanding Experimental warming and grazing SPD A B) 50 50 40 35 30 20 20 95 10.0 10.5 11.0 11.5 12.0 0 20 30 40 50 60 70 air temperature(C) litter areal coverage (% A)Relationship between total SR and growing season averaged air temperature B)Relationship between total SR and growing season averaged litter cover. Experimental warming caused decrease in species richness (KLEIN,HARDE,ZHAO,2004,Ecology Letters)
litter areal coverage (%) 0 10 20 30 40 50 60 70 20 25 30 35 40 45 50 55 air temperature (o C) 9.5 10.0 10.5 11.0 11.5 12.0 average # species / plot 20 25 30 35 40 45 50 55 A) B) Experimental warming and grazing SPD Experimental warming caused decrease in species richness A) Relationship between total SR and growing season averaged air temperature B) Relationship between total SR and growing season averaged % litter cover. (KLEIN,HARDE,ZHAO,2004,Ecology Letters). Understanding

Understanding Experimental warming and grazing SPD 40 35 30 25 20 ☐NO WARM WARM 10 NO CLIP CLIP Mean total SR values of warmed plots in both the presence and absence of clipping at the high grazing intensity shrubland site Clipping could mediated the affects of experimental warming
Experimental warming and grazing SPD NO CLIP CLIP av. # species / plot 0 5 10 15 20 25 30 35 40 NO WARM WARM ** Mean total SR values of warmed plots in both the presence and absence of clipping at the high grazing intensity shrubland site Clipping could mediated the affects of experimental warming Understanding
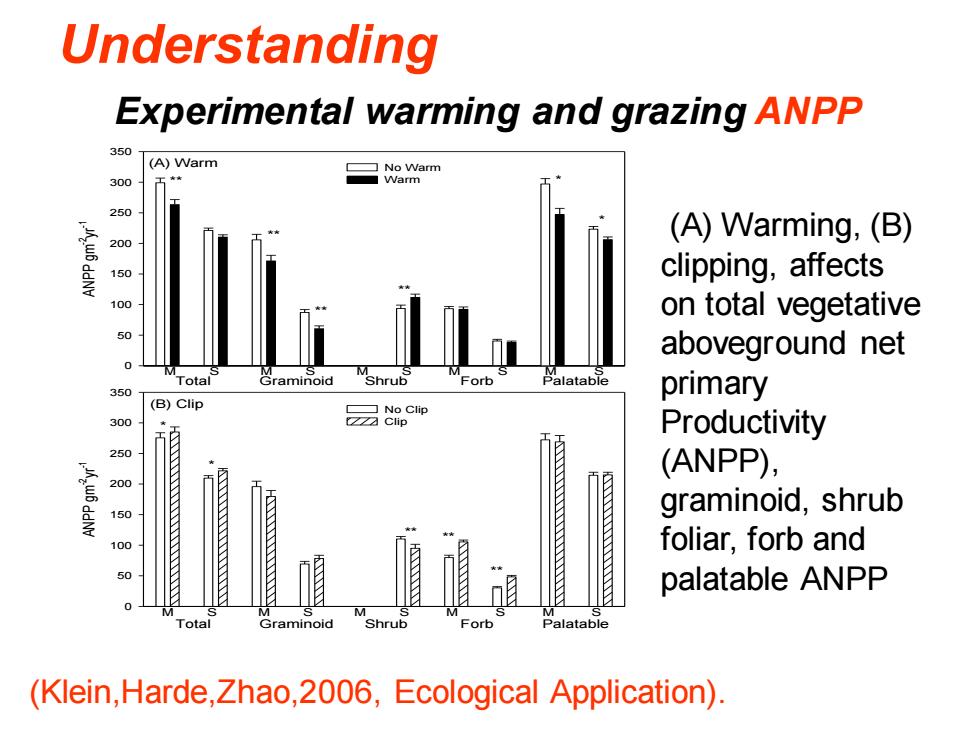
Understanding Experimental warming and grazing ANPP 350 (A)Warm 300 250 (A)Warming,(B) 200 150 clipping,affects 100 on total vegetative aboveground net 0 Total Graminoid Shrub Forb Palatable 350 primary (B)Clip 300 Productivity 250 (ANPP), 200 graminoid,shrub 0 foliar,forb and 50 palatable ANPP (Klein,Harde,Zhao,2006,Ecological Application)
(Klein,Harde,Zhao,2006, Ecological Application). Experimental warming and grazing ANPP ANPP gm-2yr-1 0 50 100 150 200 250 300 350 No Warm Warm (A) Warm ANPP gm-2yr-1 0 50 100 150 200 250 300 350 No Clip Clip (B) Clip ANPP gm-2yr-1 0 50 100 150 200 250 300 350 No Warm, No Clip + Warm, + Clip (C) Combined ** ** ** ** * * * * ** ** * * ** ** Total Graminoid Shrub Forb Palatable M S M S M S M S M S ** M S M S M S M S M S Total Graminoid Shrub Forb Palatable M S M S M S M S M S Total Graminoid Shrub Forb Palatable (A) Warming, (B) clipping, affects on total vegetative aboveground net primary Productivity (ANPP), graminoid, shrub foliar, forb and palatable ANPP Understanding