Data Analysis Tools and 2018.04.10 Practice(Using R) R基本图形II 北大软件与微电荐院 Huiping Sun(孙惠平) School of Software and Microelectronics,Peking University sunhp@ss.pku.edu.cn
Huiping Sun(ਃణଘ) sunhp@ss.pku.edu.cn R基本图形II Data Analysis Tools and Practice(Using R) 2018.04.10

课堂测试时间
᧞झၥᦶᳵ

课堂测试06 先用电脑完成 R Graphics Il 30分钟 然后誊抄纸上 I、数据集alpe_d huez?2描述了环法自行车赛期间Alpe d'Huez赛段的最快时间,以及关于 年份和吸毒指控的背景信息。绘制出车手最快时间的分布。使用)直方图和b)箱线图 显示它们。 2、mtcars是datasets包中的数据集。请使用str0函数了解这个数据集的构成,并输出数 据集,然后按要求画图: 米a. 我们要设置一个蓝色背景和红色的点或线。我们应该使用什么命令 米b.画出cyl和mPg关系的散点图,并将结果输出为plot.png,要求输出为白底, 360px*360px,点的大小为72 ·3、obama vs mccain数据集描述了2008年美国总统选举中的各州投票信息,以及关于收 入,失业,种族和宗教的背景信息。 米a.画出收入Income和参加选举比例Turnout,之间的关系的散点图。提示:Turnout存 在Na值。 米b.将上述图形点的形状为黑色实心三角形I) 米c.数据集中有一个因子类型的列regions,.请画出每个地区region下的收入Income和参 加选举比例Turnout,之间的关系的散点图。要求设置布局为5列,行优先
• 1̵හഝᵞalpe_d_huez2ൈᬿԧሾဩᛔᤈᩦ๗ᳵAlpe d’Huezᩦྦྷጱ๋ளᳵ҅զ݊ىԭ ଙղޕྰഴጱᙧวמ̶௳ᕲڊګಋ๋ளᳵጱړ̶ֵአa҂ፗොࢶb҂ᓟᕚࢶ ดᐏਙժ̶ • 2̵mtcarsฎdatasets۱Ӿጱහഝᵞ̶᧗ֵአstr()ڍහԧᥴᬯӻහഝᵞጱ౮҅ଚᬌڊහ ഝᵞ҅ᆐݸೲᥝኮࢶғ ✴ a. ౯ժᥝᦡᗝӞӻ᠗ᜋᙧวᕁᜋጱᅩᕚ̶ ౯ժଫᧆֵአՋԍե ✴ b. ኮڊcylmpgىᔮጱවᅩࢶ҅ଚਖ਼ᕮຎᬌڊԅplot.png҅ᥝᬌڊԅጮବ҅ 360px*360px,ᅩጱय़ੜԅ72 • 3̵obama_vs_mccainහഝᵞൈᬿԧ2008ଙᗦࢵᕹᭌԈӾጱݱಭᐥמ҅௳զ݊ىԭත ̶௳מਤරጱᙧว෧ᐿ҅०ӱ҅ف ✴ a. ኮڊතفIncome݇ےᭌԈྲֺTurnoutԏᳵጱىᔮጱවᅩࢶ̶ᐏғTurnoutਂ ̶Naࣁ ✴ b. ਖ਼Ӥᬿࢶ୵ᅩጱ୵ᇫԅἓᜋਫஞӣ୵(17) ✴ c. හഝᵞӾํӞӻࢩৼᔄࣳጱڜregions,᧗ኮڊྯӻ܄ࣈregionӥጱතفIncome݇ ےᭌԈྲֺTurnoutԏᳵጱىᔮጱවᅩࢶ̶ᥝᦡᗝੴԅ5ڜ҅ᤈսض̶ R Graphics II 课堂测试06 ضአኪᚏਠ౮ 30ړᰦ ᆐݸᦀಧᕕӤ

R Graphics Il 上次课程内容回顾 ●图形函数: *plot();barplot();pie();hist();boxplot(); ● 图形参数: col;font;pch;cex;Ity;lwd;xlab;ylab;xlim;ylim;type;main;horiz;beside; ·图例函数: 米legend(location,title,legend,.…); ·图形组合: 米par();layout(0; ·其余函数: *title();abline();line();text();mtext();
හғڍ୵ࢶ • ✴ plot(); barplot(); pie(); hist(); boxplot(); හғ୵݇ࢶ • ✴ col; font; pch; cex; Ity; lwd; xlab; ylab; xlim; ylim; type; main; horiz; beside; හғڍֺࢶ • ✴ legend(location, title, legend, …); ғݳᕟ୵ࢶ • ✴ par(); layout(); හғڍٌ֟ • ✴ title(); abline(); line(); text(); mtext(); R Graphics II 上次课程内容回顾

图形控制
ګഴ୵ࢶ

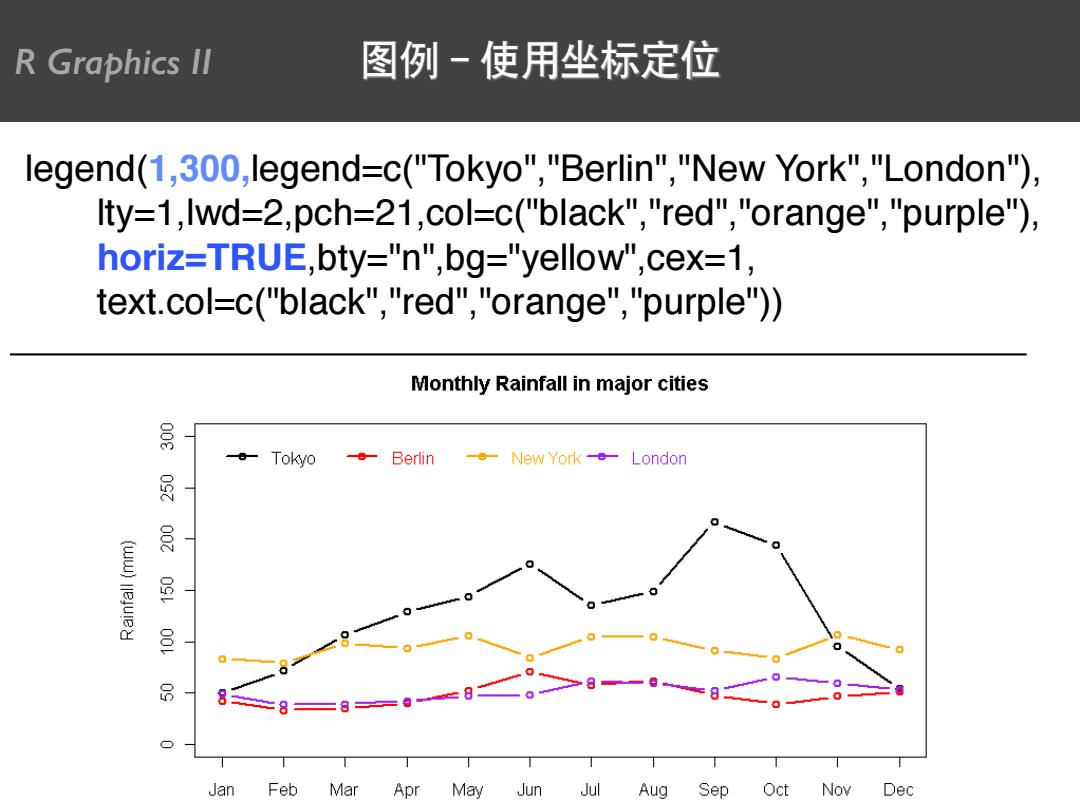
R Graphics Il 图例一使用坐标定位 legend(1,300,legend=c("Tokyo","Berlin","New York","London"). Ity=1,lwd=2,pch=21,col-c("black","red","orange","purple"), horiz=TRUE,bty="n",bg="yellow",cex=1, text.col=c("black","red","orange","purple")) Monthly Rainfall in major cities 导 。Toky0 Berlin New York-London 虽 量 Jan Feb Mar Apr May Jun Jul Aug Sep Oct Nov Dec
legend(1,300,legend=c("Tokyo","Berlin","New York","London"), lty=1,lwd=2,pch=21,col=c("black","red","orange","purple"), horiz=TRUE,bty="n",bg="yellow",cex=1, text.col=c("black","red","orange","purple")) R Graphics II 图例-使用坐标定位

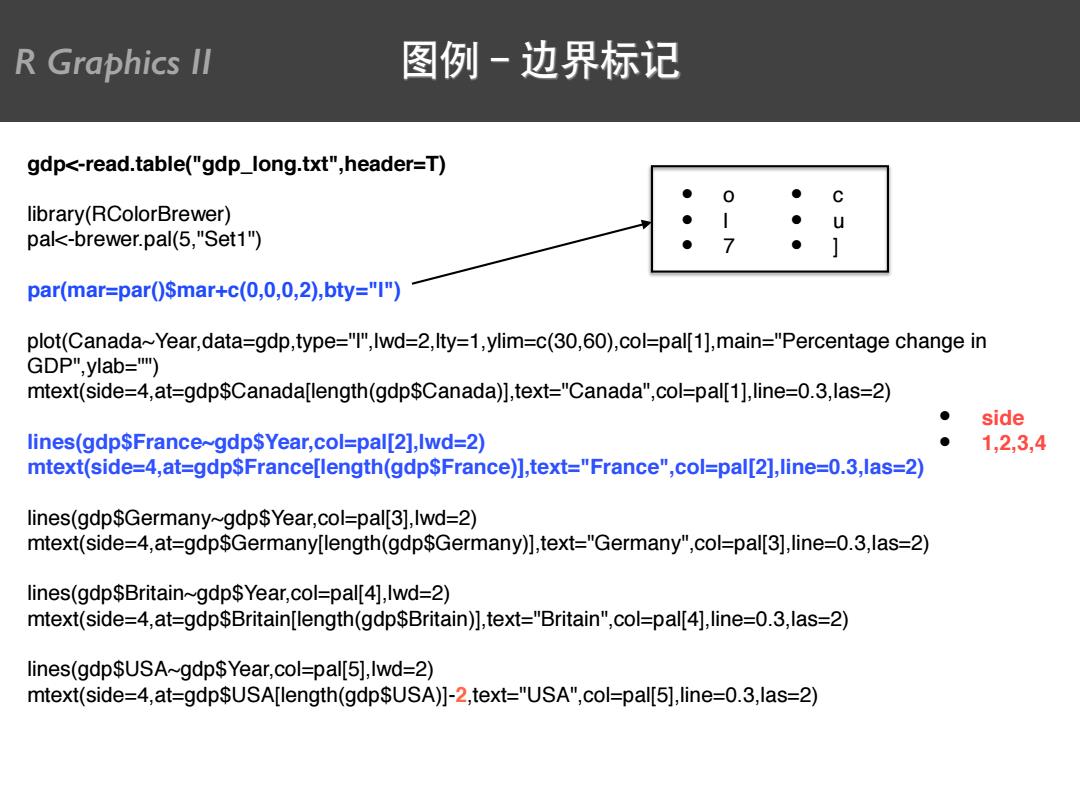
R Graphics Il 图例-边界标记 gdp<-read.table("gdp_long.txt",header=T) 0 C library(RColorBrewer) pal<-brewer.pal(5,"Set1") 7 par(mar=par()Smar+c(0,0,0,2),bty="I") plot(Canada~Year,data=gdp,type="I",lwd=2,Ity=1,ylim=c(30,60),col=pal[1],main="Percentage change in GDP",ylab=T) mtext(side=4,at=gdp$Canada[length(gdp$Canada)],text="Canada",col=pal[1],line=0.3,las=2) side lines(gdpSFrance~gdpSYear,col=pal[2],Iwd=2) 1,2,3,4 mtext(side=4,at=gdpSFrance[length(gdpSFrance)],text="France",col=pal[2],line=0.3,las=2) lines(gdp$Germany~gdp$Year,col=pal[3],lwd=2) mtext(side=4,at=gdp$Germany[length(gdp$Germany)],text="Germany",col=pal[3],line=0.3,las=2) lines(gdp$Britain~gdp$Year,col=pal[4],lwd=2) mtext(side=4,at=gdp$Britain[length(gdp$Britain)],text="Britain",col=pal[4],line=0.3,las=2) lines(gdpSUSA~gdp$Year,col=pal[5],lwd=2) mtext(side=4,at=gdpSUSA[length(gdpSUSA)]-2,text="USA",col=pal[5],line=0.3,las=2)
gdp<-read.table("gdp_long.txt",header=T) library(RColorBrewer) pal<-brewer.pal(5,"Set1") par(mar=par()$mar+c(0,0,0,2),bty="l") plot(Canada~Year,data=gdp,type="l",lwd=2,lty=1,ylim=c(30,60),col=pal[1],main="Percentage change in GDP",ylab="") mtext(side=4,at=gdp$Canada[length(gdp$Canada)],text="Canada",col=pal[1],line=0.3,las=2) lines(gdp$France~gdp$Year,col=pal[2],lwd=2) mtext(side=4,at=gdp$France[length(gdp$France)],text="France",col=pal[2],line=0.3,las=2) lines(gdp$Germany~gdp$Year,col=pal[3],lwd=2) mtext(side=4,at=gdp$Germany[length(gdp$Germany)],text="Germany",col=pal[3],line=0.3,las=2) lines(gdp$Britain~gdp$Year,col=pal[4],lwd=2) mtext(side=4,at=gdp$Britain[length(gdp$Britain)],text="Britain",col=pal[4],line=0.3,las=2) lines(gdp$USA~gdp$Year,col=pal[5],lwd=2) mtext(side=4,at=gdp$USA[length(gdp$USA)]-2,text="USA",col=pal[5],line=0.3,las=2) • o • l • 7 • c • u • ] • side • 1,2,3,4 R Graphics II 图例-边界标记

R Graphics Il 图例-边界标记 Percentage change in GDP 8 8 France Britain 8 Germany 导 Canada 导 USA 8 8 1995 2000 2005 2010 Year
R Graphics II 图例-边界标记

R Graphics Il 折线图-网格图 rain<-read.csv("cityrain.csv") plot(rain$Tokyo,type=“b",lwd=2,xaxt=“n”,ylim=c(O,300),col=“black",xlab=“Month", ylab="Rainfall(mm)",main="Monthly Rainfall in Tokyo") axis(1,at=1:length(rain$Month),labels=rain$Month) grid() grid(nx=NA,ny=8,lwd=1,Ity=2,col="blue") Monthly Rainfall in Tokyo Monthly Rainfall in Tokyo Jan Feb Mar Apr May Jun Jul Aug Sep Oct Nov Dec Jan Feb Mar Apr May Jun Jul Aug Sep Oct Nov Dec Month Month
rain<-read.csv(“cityrain.csv") plot(rain$Tokyo,type=“b",lwd=2, xaxt=“n”,ylim=c(0,300),col=“black", xlab=“Month", ylab="Rainfall (mm)",main="Monthly Rainfall in Tokyo") axis(1,at=1:length(rain$Month),labels=rain$Month) grid() grid(nx=NA, ny=8, lwd=1,lty=2,col="blue") R Graphics II 折线图-网格图

R Graphics Il 折线图-特殊线 rain<-read.csv("cityrain.csv") plot(rain$Tokyo,type=“b",lwd=2,xaxt=“n",ylim=c(0,30o),col=“black",xlab=“Month", ylab="Rainfall(mm)",main="Monthly Rainfall in Tokyo") axis(1,at=1:length(rain$Month),labels=rain$Month) abline(v=9) abline(h=150,col="red",Ity=2) Monthly Rainfall in Tokyo Monthly Rainfall in Tokyo Jan Feb Mar Apr May Jun Ju Aug Sep Oct Nov Dec Mor迪 Jan Feb Mar Apr May Jun Jul Aug Sep Oct Nov Dec Month
rain<-read.csv(“cityrain.csv") plot(rain$Tokyo,type=“b",lwd=2, xaxt=“n”,ylim=c(0,300),col=“black", xlab=“Month", ylab="Rainfall (mm)",main="Monthly Rainfall in Tokyo") axis(1,at=1:length(rain$Month),labels=rain$Month) abline(v=9) abline(h=150,col="red",lty=2) R Graphics II 折线图-特殊线