Data Analysis Tools and 2018.04.03 Practice(Using R) R基本图形 北大软件与微电荐院 Huiping Sun(孙惠平) School of Software and Microelectronics,Peking University sunhp@ss.pku.edu.cn
Huiping Sun(ਃణଘ) sunhp@ss.pku.edu.cn R基本图形 Data Analysis Tools and Practice(Using R) 2018.04.03

课堂测试时间
᧞झၥᦶᳵ

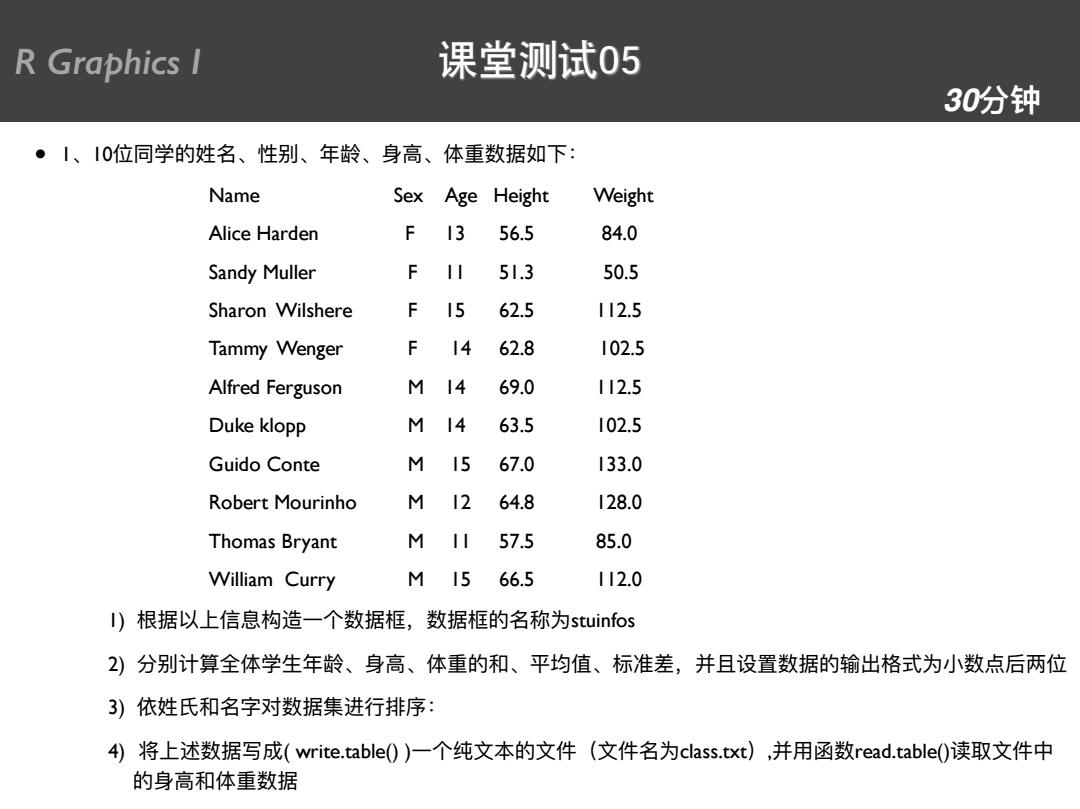
R Graphics I 课堂测试05 30分钟 ·1、0位同学的姓名、性别、年龄、身高、体重数据如下: Name Sex Age Height Weight Alice Harden F 13 56.5 84.0 Sandy Muller F 51.3 50.5 Sharon Wilshere 15 62.5 112.5 Tammy Wenger F 14 62.8 102.5 Alfred Ferguson M 14 69.0 112.5 Duke klopp M 14 63.5 102.5 Guido Conte M 15 67.0 133.0 Robert Mourinho M 12 64.8 128.0 Thomas Bryant M I 57.5 85.0 William Curry M15 66.5 112.0 I)根据以上信息构造一个数据框,数据框的名称为stuinfos 2)分别计算全体学生年龄、身高、体重的和、平均值、标准差,并且设置数据的输出格式为小数点后两位 3)依姓氏和名字对数据集进行排序: 4)将上述数据写成(write.table0)一个纯文本的文件(文件名为class..txt),并用函数read.table)(读取文件中 的身高和体重数据
• 1̵10֖ݶጱনݷ̵ڦ̵ଙἻ̵ṛ̵֛᯿හഝইӥғ Name Sex Age Height Weight Alice Harden F 13 56.5 84.0 Sandy Muller F 11 51.3 50.5 Sharon Wilshere F 15 62.5 112.5 Tammy Wenger F 14 62.8 102.5 Alfred Ferguson M 14 69.0 112.5 Duke klopp M 14 63.5 102.5 Guido Conte M 15 67.0 133.0 Robert Mourinho M 12 64.8 128.0 Thomas Bryant M 11 57.5 85.0 William Curry M 15 66.5 112.0 1) ໑ഝզӤמ௳᭜Ӟӻහഝ҅හഝጱݷᑍԅstuinfos 2) ڦړᦇᓒق֛ኞଙἻ̵ṛ̵֛᯿ጱ̵ଘ̵࣐ຽاٴ૧҅ଚӬᦡᗝහഝጱᬌڊ໒ୗԅੜහᅩݸӷ֖ 3) ׁন࿄ݷਁහഝᵞᬰᤈഭଧғ 4) ਖ਼Ӥᬿහഝٟ౮( write.table() )Ӟӻᕍጱկҁկݷԅclass.txt҂,ଚአڍහread.table()ݐկӾ ጱṛ᯿֛හഝ R Graphics I 课堂测试05 30ړᰦ

R Graphics I 参考教材 君Grapbics Cookbouk Qulck answers to common problems R Graphs Cookbook R数据可视化手册 Detailed hands-on recipes for creating the most useful types of graphs in R-starting from the simplest versions to more 【美]7mnCn限等 advanced applications 问横易一硫缝太云泽 怡轩申校 O'REILLY" Hrishi V.Mittal []open source 套人民地出版社
R Graphics I 参考教材

基本图形 图形参数
图形参数 ୵ࢶच

R Graphics I 一个例子 plot(mtcarsswt,mtcars$mpg) abline(lm(mtcarssmpg mtcarsswt)) title("Regression of MPG on Weight") Regression of MPG on Weight 200000m 00 000000 0 P00000 0008° 9 见RiA课本44页 2 3 4 5 mtcarsSwt
R Graphics I 一个例子 ᥠRiA᧞44ᶭ

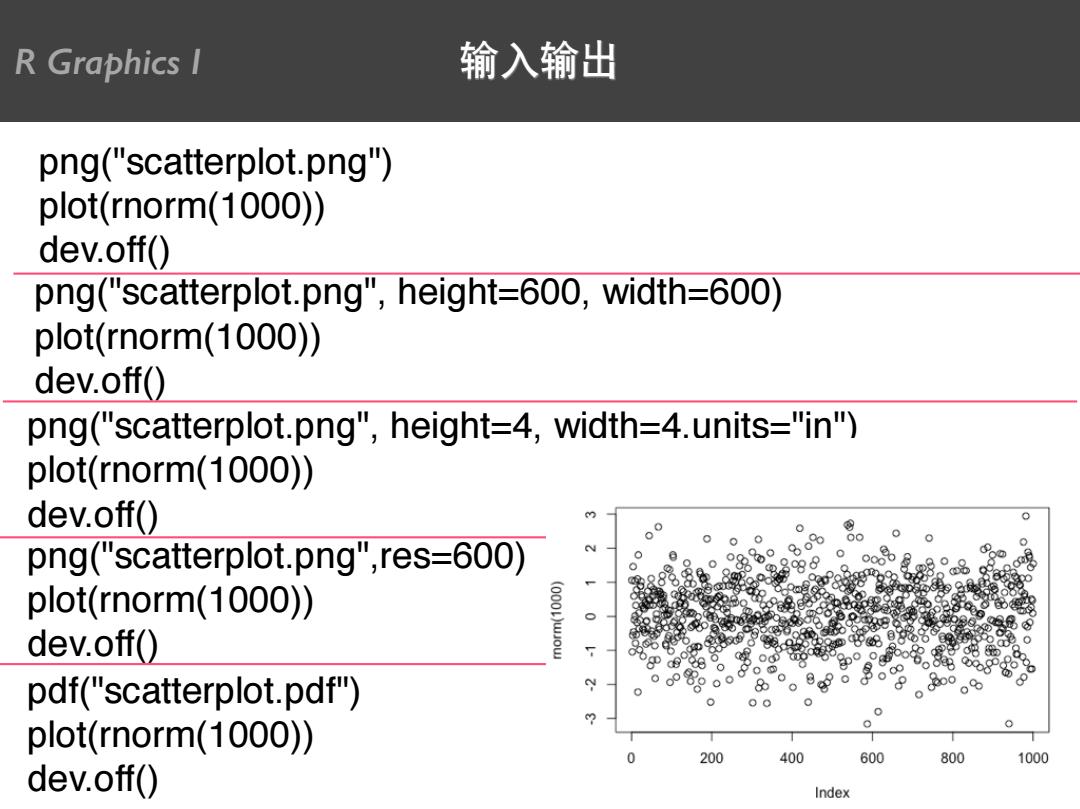
R Graphics l 输入输出 png("scatterplot.png") plot(rnorm(1000)) dev.off() png("scatterplot.png",height=600,width=600) plot(rnorm(1000)) dev.off() png("scatterplot.png",height=4,width=4.units="in") plot(rnorm(1000)) dev.off() png("scatterplot.png",res-600) plot(rnorm(1000)) dev.off() o电 pdf("scatterplot.pdf") 0 00 plot(rnorm(1000)) 200 400 600 800 1000 dev.off() Index
png("scatterplot.png") plot(rnorm(1000)) dev.off() png("scatterplot.png", height=600, width=600) plot(rnorm(1000)) dev.off() png("scatterplot.png", height=4, width=4,units="in") plot(rnorm(1000)) dev.off() png("scatterplot.png",res=600) plot(rnorm(1000)) dev.off() pdf("scatterplot.pdf") plot(rnorm(1000)) dev.off() R Graphics I 输入输出

R Graphics I 另一个例子 表3-1病人对两种药物五个剂量水平上的响应情况 剂量 对药物A的响应 对药物B的响应 20 16 15 30 20 18 40 27 25 45 40 31 60 60 40 t11出口曰11t小△14,日 品 >d0sedrugA drugB plot(dose,drugA,type ="b") 号 8 见RiA课本46页 20 30 40 50 60 dose
R Graphics I 另一个例子 ᥠRiA᧞46ᶭ

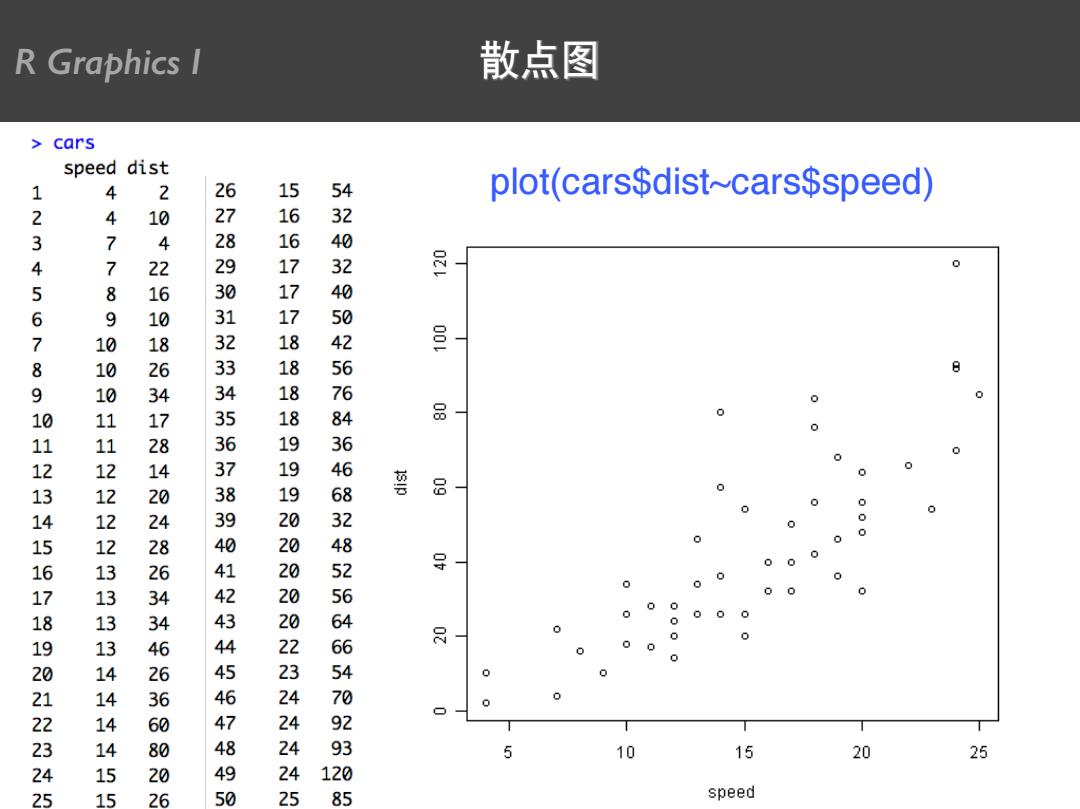
R Graphics I 散点图 cars speed dist 1 plot(cars$dist~cars$speed) 3 4 4477 8 0 56 品- · 89912345678951234 89099112222333344445 21942619186478434864466636826 678951234567899425456789 566777888899903330234444 3256466382182654364029 警 0 0 0 ■ 0 0 0 0 0 000 0 0 0 5 10 15 20 25 120 5 5 26 50 5 85 speed
plot(cars$dist~cars$speed) R Graphics I 散点图

R Graphics I 散点图 plot(cars$dist~cars$speed, main="Relationship between car distance speed", xlab="Speed (miles per hour)", ylab="Distance travelled(miles)", Relationship between car distance and speed xlim=c(0,30), ylim=c(0,140), XaXS=“i", yaxs="j", col="red", 品 pch=19) 品 导 0 5 10 15 20 25 30
plot(cars$dist~cars$speed, main="Relationship between car distance & speed", xlab="Speed (miles per hour)", ylab="Distance travelled (miles)", xlim=c(0,30), ylim=c(0,140), xaxs=“i", yaxs="i", col="red", pch=19) R Graphics I 散点图