Data Analysis Tools and 2018.04.24 Practice(Using R) gg plot.2画图I川 北大软件与微电荐院 Huiping Sun(孙惠平) School of Software and Microelectronics,Peking University sunhp@ss.pku.edu.cn
Huiping Sun(ਃణଘ) sunhp@ss.pku.edu.cn ggplot2画图II Data Analysis Tools and Practice(Using R) 2018.04.24

课堂测试时间
᧞झၥᦶᳵ
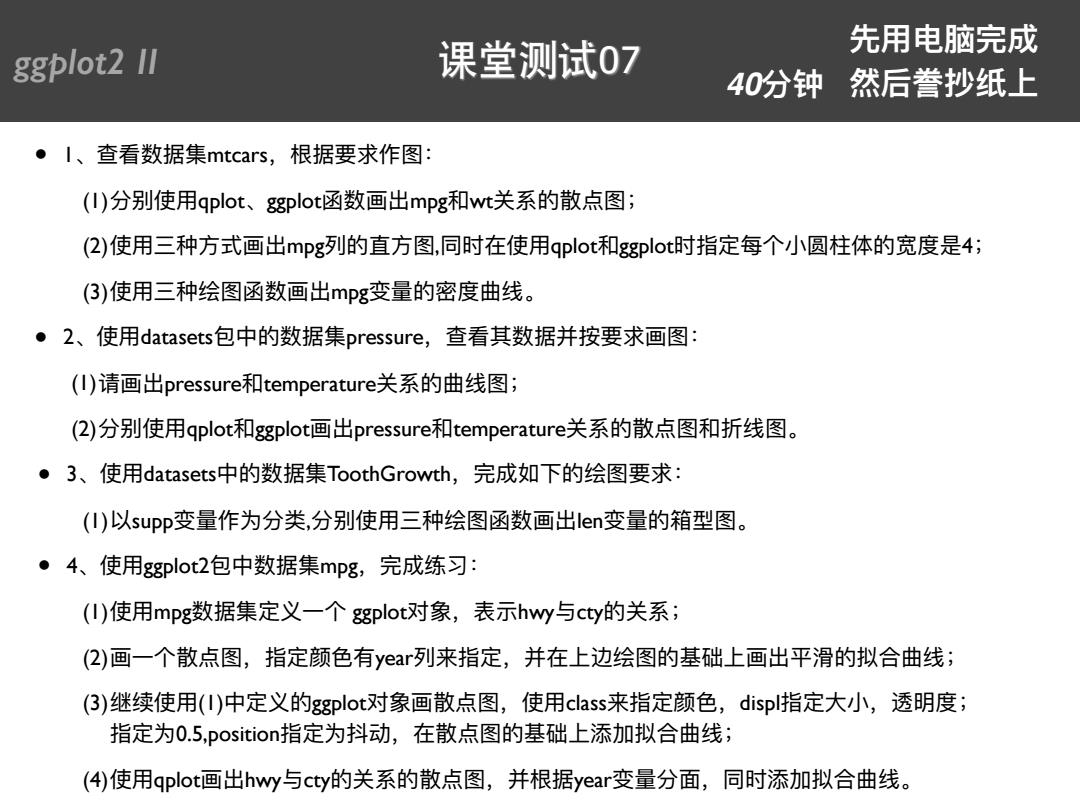
先用电脑完成 ggplot2 II 课堂测试07 40分钟 然后誊抄纸上 l、查看数据集mtcars, 根据要求作图: (I)分别使用qplot、gplot函数画出mpg和wt关系的散点图; (2)使用三种方式画出mPg列的直方图,同时在使用qplot和ggplot时指定每个小圆柱体的宽度是4; (3)使用三种绘图函数画出mpg变量的密度曲线。 ·2、使用datasets包中的数据集pressure,查看其数据并按要求画图: (I)请画出pressure和temperature关系的曲线图; (2)分别使用qplot和ggplot画出pressure和temperature关系的散点图和折线图。 ●3、使用datasets中的数据集ToothGrowth,完成如下的绘图要求: (I)以supp变量作为分类,分别使用三种绘图函数画出Ien变量的箱型图。 ●4、使用ggplot2包中数据集mpg,完成练习: (I)使用mpg数据集定义一个plot对象,表示hwy与cty的关系; (2)画一个散点图,指定颜色有year列来指定,并在上边绘图的基础上画出平滑的拟合曲线; (3)继续使用(I)中定义的ggplot对象画散点图,使用class来指定颜色,displ指定大小,透明度; 指定为0.5,position指定为抖动,在散点图的基础上添加拟合曲线; (4)使用qplot画出hwy与cty的关系的散点图,并根据year变量分面,同时添加拟合曲线
• 1̵ັ፡හഝᵞmtcars҅໑ഝᥝ֢ࢶғ (1)ڦړֵአqplot̵ggplotڍහኮڊmpgwtىᔮጱවᅩࢶҔ (2)ֵአӣᐿොୗኮڊmpgڜጱፗොࢶ,ݶࣁֵአqplotggplotਧྯӻੜࢺ֛ຶጱ਼ଶฎ4Ҕ (3)ֵአӣᐿᕲڍࢶහኮڊmpgݒᰁጱੂଶใᕚ̶ • 2̵ֵአdatasets۱Ӿጱහഝᵞpressure҅ັ፡ٌහഝଚೲᥝኮࢶғ (1)᧗ኮڊpressuretemperatureىᔮጱใᕚࢶҔ ̶ࢶರᕚࢶᔮጱවᅩىtemperaturepressureڊggplotኮአqplotֵڦړ(2( • 3̵ֵአdatasetsӾጱහഝᵞToothGrowth҅ਠ౮ইӥጱᕲࢶᥝғ (1)զsuppݒᰁ֢ԅړᔄ,ڦړֵአӣᐿᕲڍࢶහኮڊlenݒᰁጱᓟࢶ̶ࣳ • 4̵ֵአggplot2۱Ӿහഝᵞmpg҅ਠ౮ᕞԟғ (1)ֵአmpgහഝᵞਧԎӞӻ ggplot҅ᤒᐏhwyӨctyጱىᔮҔ (2)ኮӞӻවᅩࢶ҅ਧ᷏ᜋํyearڜਧ҅ଚࣁӤᬟᕲࢶጱचᏐӤኮڊଘჶጱݳใᕚҔ (3)ᖀᖅֵአ(1)ӾਧԎጱggplotኮවᅩࢶֵ҅አclassਧ᷏ᜋ҅displਧय़ੜ҅᭐กଶҔ ਧԅ0.5,positionਧԅಮۖ҅ࣁවᅩࢶጱचᏐӤႲےݳใᕚҔ (4)ֵአqplotኮڊhwyӨctyጱىᔮጱවᅩࢶ҅ଚ໑ഝyearݒᰁړᶎ҅ݶႲےݳใᕚ̶ ggplot2 II 课堂测试07 ضአኪᚏਠ౮ 40ړᰦ ᆐݸᦀಧᕕӤ
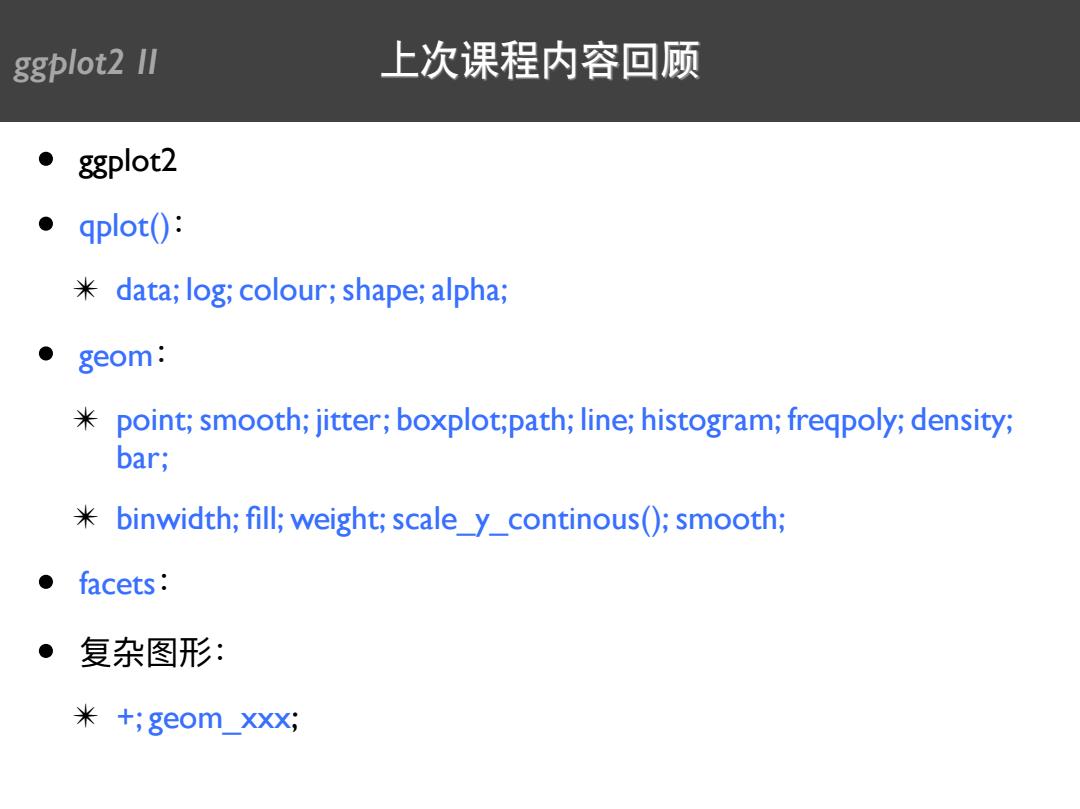
8 gplot2l∥ 上次课程内容回顾 ● ggplot2 ·qplot(0: *data;log;colour;shape;alpha; geom: 米 point;smooth;jitter;boxplot;path;line;histogram;freqpoly;density; bar; *binwidth;fill;weight;scale_y_continous();smooth; ● facets: 。复杂图形: 米+;geom_XX;
• ggplot2 • qplot()ғ ✴ data; log; colour; shape; alpha; • geomғ ✴ point; smooth; jitter; boxplot;path; line; histogram; freqpoly; density; bar; ✴ binwidth; fill; weight; scale_y_continous(); smooth; • facetsғ ғ୵ࢶ॔ • ✴ +; geom_xxx; ggplot2 II 上次课程内容回顾

用图层构建图形 CH4
୵ࢶୌ੶ࢶአ CH4

ggplot2 II 图层 ·数据 data 一组图形属性映射 mapping ·几何对象 geom ·统计变换 ● stat 位置调整 position 数据必须是数据框 aes() 默认参数 参数设定 layer()
• හഝ • Ӟᕟࢶં୵ฉ ֜پ • • ᕹᦇݒഘ • ֖ᗝ᧣ෆ ggplot2 II 图层 ἕᦊ݇හ ݇හᦡਧ • data • mapping • geom • stat • position හഝᶳฎහഝ aes() layer()

ggplot2Ⅱ ggplot() ggplot(data NULL, mapping aes(, layer() 自己查帮助 environment parent.frame() p<-ggplot(diamondas, aes(carat, 15000 price, cut colour cut), 。Fair ●Good 10000 p ●Very Good ●Premium ●Ideal p <-p layer(geom ="point", 5000 stat "identity", position ="identity" 2 carat p
ggplot(data = NULL, mapping = aes(), …, environment = parent.frame()) p <- ggplot(diamondas, aes(carat, price, colour = cut), ) p p <- p + layer(geom = “point", stat = "identity", position = "identity" ) p layer() ᛔ૩ັଆۗ ggplot2 II ggplot()
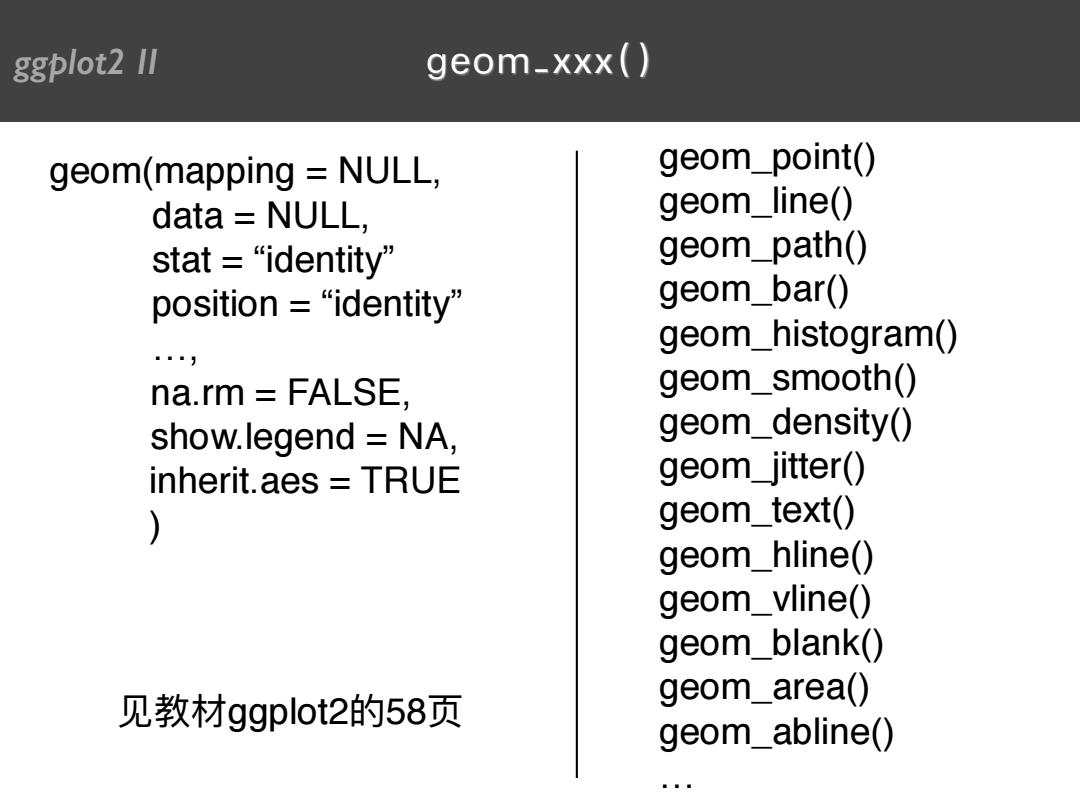
ggplot2 II geom_xxx() geom(mapping NULL, geom_point() data NULL, geom_line() stat=“identity” geom_path() position=“identity'” geom_bar() geom_histogram() 。。· na.rm FALSE. geom_smooth() show.legend NA, geom_density() inherit.aes TRUE geom_jitter() geom_text() geom_hline() geom_vline() geom_blank() 见教材ggplot2的58页 geom_area() geom_abline()
geom(mapping = NULL, data = NULL, stat = “identity” position = “identity” …, na.rm = FALSE, show.legend = NA, inherit.aes = TRUE ) geom_point() geom_line() geom_path() geom_bar() geom_histogram() geom_smooth() geom_density() geom_jitter() geom_text() geom_hline() geom_vline() geom_blank() geom_area() geom_abline() … ᥠරggplot2ጱ58ᶭ ggplot2 II geom_xxx()

ggplot2 II stat_xxx() stat(mapping NULL, stat_identity() data NULL, stat_smooth() geom/stat =543 stat_function() position=“identity” stat_boxplot() stat_density() na.rm FALSE. stat_quantile() show.legend NA, stat_sum() inherit.aes TRUE stat_summary() stat_unique() stat_bin() stat_bindot() 见教材ggplot22的60页
stat(mapping = NULL, data = NULL, geom/stat = “” position = “identity” …, na.rm = FALSE, show.legend = NA, inherit.aes = TRUE ) stat_identity() stat_smooth() stat_function() stat_boxplot() stat_density() stat_quantile() stat_sum() stat_summary() stat_unique() stat_bin() stat_bindot() … ᥠරggplot2ጱ60ᶭ ggplot2 II stat_xxx()

ggplot.21Ⅱ layer()和geom-xxx() p <-ggplot(diamonds,aes(x carat)) p <-ggplot(diamonds, p<-p+layer( aes(x carat)) geom "bar", p<-p geom_histogram(bins =30, stat "bin", fill "steelblue") position "identity", p params list(fill ="steelblue") p 15000 10000 5000 carat
p <- ggplot(diamonds, aes(x = carat)) p <- p + layer( geom = "bar", stat = "bin", position = "identity", params = list(fill = "steelblue") ) p p <- ggplot(diamonds, aes(x = carat)) p <- p + geom_histogram(bins = 30, fill = "steelblue") p ggplot2 II layer()和geom_xxx()