What is happening to the world economy?Here are some answers,in seven charts.They reveal a world undergoing profound changes. The most important transformation of recent decades has been the declining weight of the high-income countries in global economic activity.The "great divergence"of the 19th and early 20th centuries,when today's high-income economies leapt ahead of the rest of the world in terms of wealth and power,has gone into remarkably rapid reverse.Where once there was divergence,we now see a "great convergence".Yet it is also a limited convergence.The change is all about the rise of Asia and,most importantly.of China. Nothing better illustrates China's advance than its huge savings.These are so large.partly because the economy has become so big and partly because Chinese households and businesses save so much.It is likely that Chinese capital,capital markets and financial institutions will become as influential in the world economy in the 21st century,as US capital. capital markets and financial institutions were in the 20th century. Emerging and developing countries have not only become increasingly important inworld output,they are becoming increasingly important in world population.The declining weight of the high-income countries is dramatic.By 2050,the share of sub-Saharan Africa in the global population is forecast by the UN to be almost as large as that of all the high-income countries in 1950.The challenges created by this shift in the world's population towards its poorest countries are evident. Economic convergence and shifts in population are central elements in the big economic picture.A third is technological change.The convergence of data processing with communication has brought us the internet,the most important technology of our era.The collapse in the relative cost of semiconductors underpins this technological revolution. Intriguingly (and worryingly),it seems to have slowed. The US has driven the global technological frontier outwards ever since the late 19th century. Robert Gordon,a professor of social sciences at Northwestern University.has shown that the US economy has not matched the outstanding productivity it achieved between 1920 and 1970.He also shows that the burst of productivity growth between 1994 and 2014,often attributed to the internet,has ended in a period of extremely low productivity growth. Mismeasurement appears to explain at most only a small part of this disturbing slowdown. Weak investment since the financial crisis is another partial explanation. The world economy is not deglobalising.But the rapid growth of both trade and cross-border financial assets and liabilities and trade,relative to global output,has come to a halt.In the case of finance,plausible explanations are risk-aversion and re-regulation.In terms of trade,the last significant act of trade liberalisation was China's accession to the World Trade Organisation,which happened as long ago as 2001.Many of the opportunities afforded by the cross-border integration of supply chains may also by now have been exhausted. Rapid change in relative economic power and huge shifts in the relative size of populations shape our world.At the same time,the sources of dynamism -technological change, productivity growth and globalisation-are slowing.to a worrying degree.One result, powerfully reinforced by the crisis,has been real income stagnation in many high-income countries. Rising populist pressure across the high-income economies makes managing these shifts far
What is happening to the world economy? Here are some answers, in seven charts. They reveal a world undergoing profound changes. The most important transformation of recent decades has been the declining weight of the high-income countries in global economic activity. The “great divergence” of the 19th and early 20th centuries, when today’s high-income economies leapt ahead of the rest of the world in terms of wealth and power, has gone into remarkably rapid reverse. Where once there was divergence, we now see a “great convergence”. Yet it is also a limited convergence. The change is all about the rise of Asia and, most importantly, of China. Nothing better illustrates China’s advance than its huge savings. These are so large, partly because the economy has become so big and partly because Chinese households and businesses save so much. It is likely that Chinese capital, capital markets and financial institutions will become as influential in the world economy in the 21st century, as US capital, capital markets and financial institutions were in the 20th century. Emerging and developing countries have not only become increasingly important inworld output, they are becoming increasingly important in world population. The declining weight of the high-income countries is dramatic. By 2050, the share of sub-Saharan Africa in the global population is forecast by the UN to be almost as large as that of all the high-income countries in 1950. The challenges created by this shift in the world’s population towards its poorest countries are evident. Economic convergence and shifts in population are central elements in the big economic picture. A third is technological change. The convergence of data processing with communication has brought us the internet, the most important technology of our era. The collapse in the relative cost of semiconductors underpins this technological revolution. Intriguingly (and worryingly), it seems to have slowed. The US has driven the global technological frontier outwards ever since the late 19th century. Robert Gordon, a professor of social sciences at Northwestern University, has shown that the US economy has not matched the outstanding productivity it achieved between 1920 and 1970. He also shows that the burst of productivity growth between 1994 and 2014, often attributed to the internet, has ended in a period of extremely low productivity growth. Mismeasurement appears to explain at most only a small part of this disturbing slowdown. Weak investment since the financial crisis is another partial explanation. The world economy is not deglobalising. But the rapid growth of both trade and cross-border financial assets and liabilities and trade, relative to global output, has come to a halt. In the case of finance, plausible explanations are risk-aversion and re-regulation. In terms of trade, the last significant act of trade liberalisation was China’s accession to the World Trade Organisation, which happened as long ago as 2001. Many of the opportunities afforded by the cross-border integration of supply chains may also by now have been exhausted. Rapid change in relative economic power and huge shifts in the relative size of populations shape our world. At the same time, the sources of dynamism — technological change, productivity growth and globalisation — are slowing, to a worrying degree. One result, powerfully reinforced by the crisis, has been real income stagnation in many high-income countries. Rising populist pressure across the high-income economies makes managing these shifts far
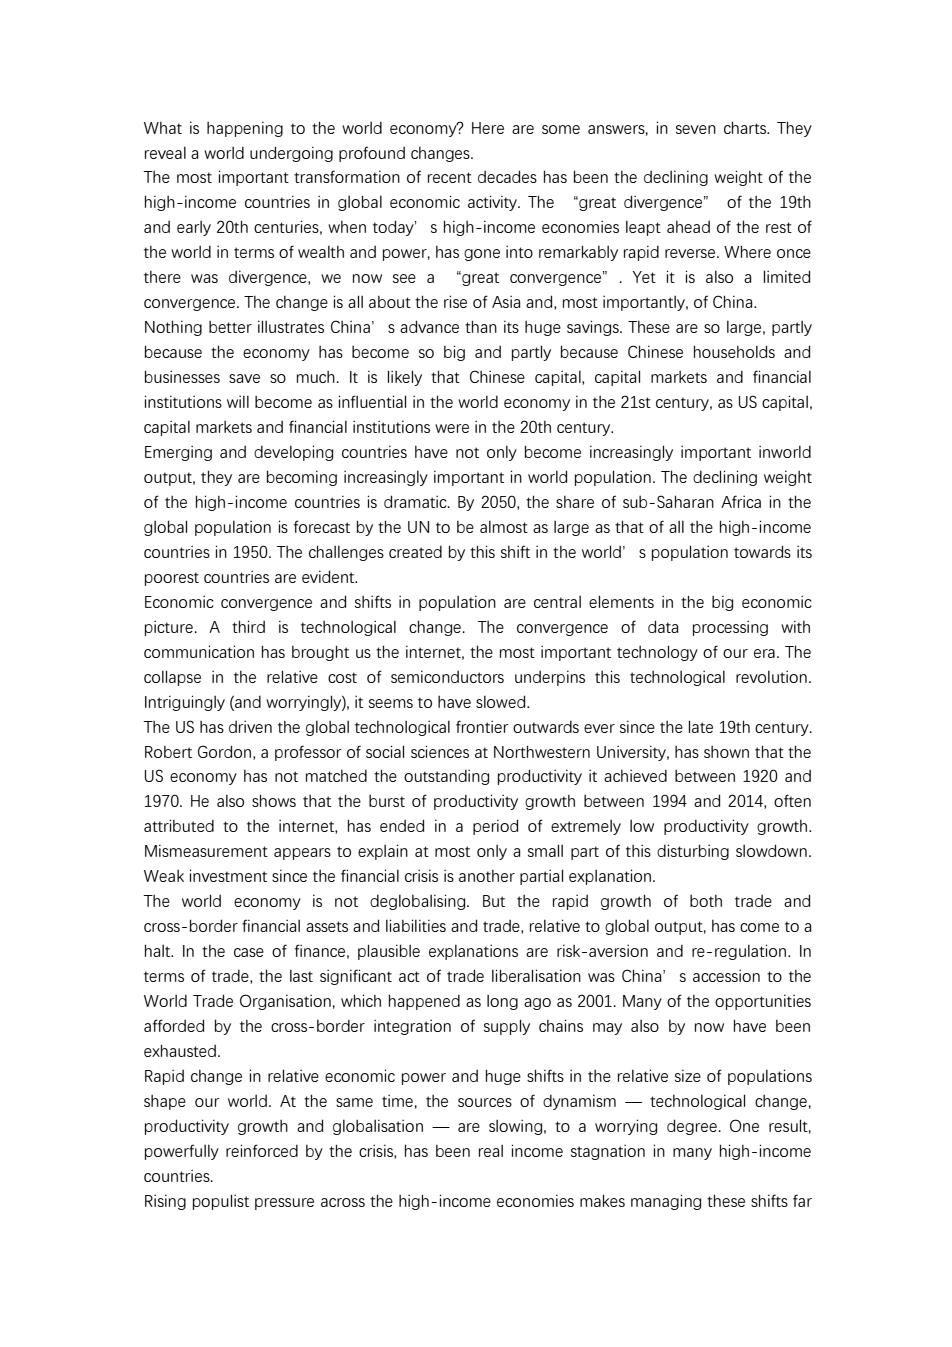
more difficult.Among the most significant developments is flat or falling real incomes since the financial crisis.Up to two-thirds of the population of many high-income countries seem to have suffered flat or falling real incomes between 2005 and 2014.It is little wonder so many voters are grumpy.They are neither used to this nor wish to become used to this. Profound shifts-Seven measures of change 重大转变一一衡量变化的7个指标 1.亚洲崛起一全球经济的变化 各地区占全球产值的份额·,按购买力平价衡量(单位:%) 100 非亚洲 发展中国家 80 其他亚洲 发展中国家 60 印度 中国 40 其他高收入 国家 20 欧盟 美国 LLL1上LL1 0 1980 85 909520000510 152022 ·排除独立国家联合体(CS) 预测一 来源:国际货币基金组织(MF) 产值 国际货币基金组织(IMF)预计,按购买力平价计算,从1990年到2022 年,高收入国家占世界产值的份额从64%下降至区区39%的水平。引人 注目的是,新兴和发展中国家份额的上升完全是亚洲新兴和发展中国家贡 献的:因此,预计同期亚洲新兴和发展中国家占世界产值的份额将从12% 升至39%
more difficult. Among the most significant developments is flat or falling real incomes since the financial crisis. Up to two-thirds of the population of many high-income countries seem to have suffered flat or falling real incomes between 2005 and 2014. It is little wonder so many voters are grumpy. They are neither used to this nor wish to become used to this. Profound shifts — Seven measures of change 重大转变——衡量变化的 7 个指标 产值 国际货币基金组织(IMF)预计,按购买力平价计算,从 1990 年到 2022 年,高收入国家占世界产值的份额从 64%下降至区区 39%的水平。引人 注目的是,新兴和发展中国家份额的上升完全是亚洲新兴和发展中国家贡 献的:因此,预计同期亚洲新兴和发展中国家占世界产值的份额将从 12% 升至 39%
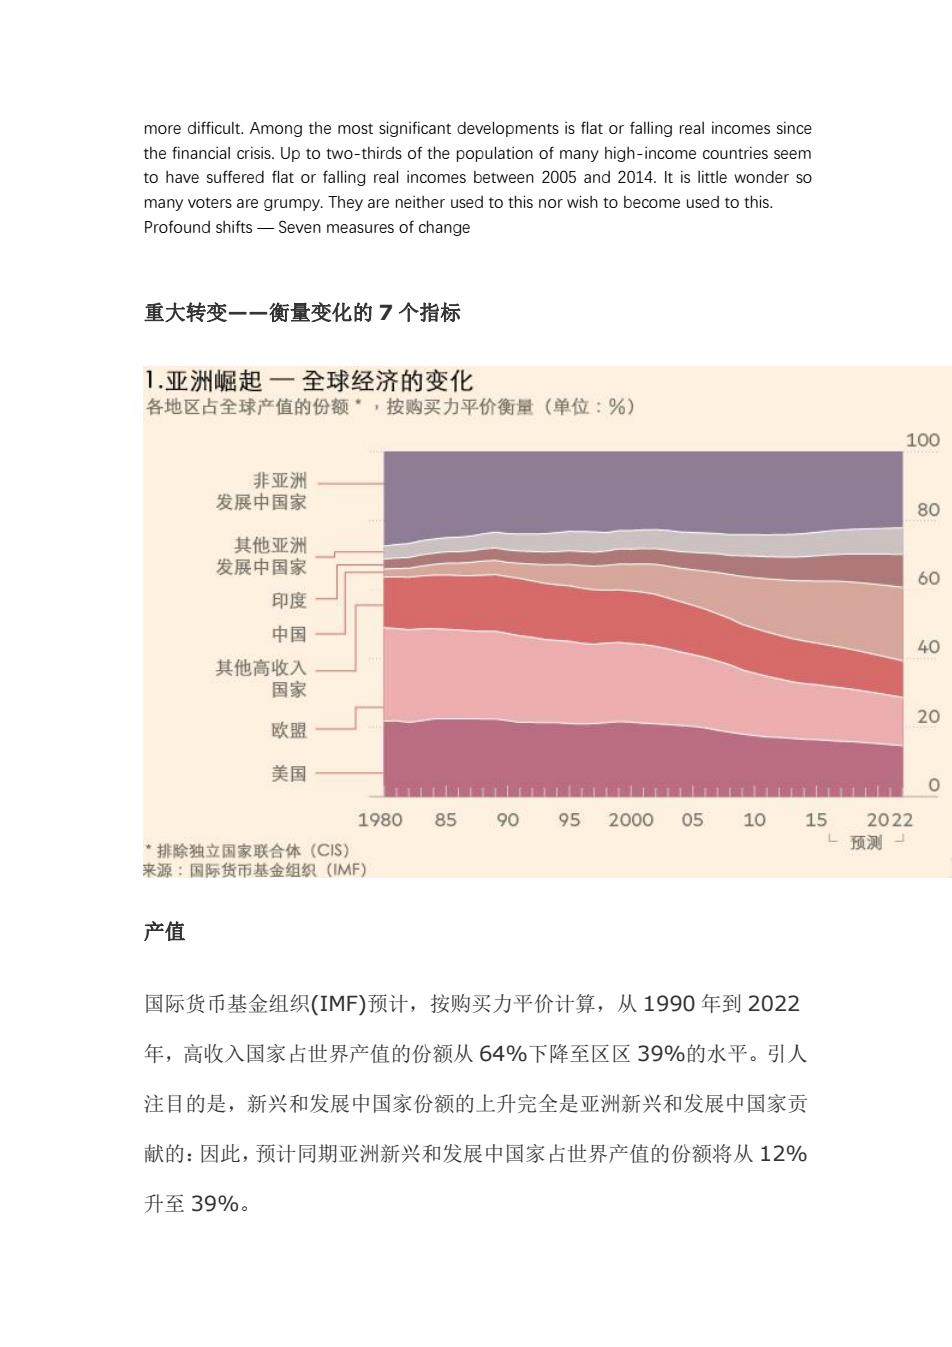
预计到2022年,亚洲新兴和发展中国家占世界产值的比例将与高收入国 家相同。中国的崛起是这种相对经济实力重大转变的主要原因,尽管印度 崛起也同样重要。到2022年,中国占世界产值的份额预计将从1990年 的4%升至21%。预计印度的份额将从4%升至10%。 2超额储蓄一中国的贡献 国民储蓄总额,按市场汇率计算(单位:占全球的份额%) ■欧盟■美国■中国 70 60 50 40 30 20 10 0 200001020304050607080910111213141516171819202122 预测 来源:国际货币基金组织(MF) 储蓄 按照市场汇率计算,中国的储蓄总额几乎是美国和欧盟的总和。中国储蓄 了几乎一半的国民收入。这种异常高的储蓄率可能下降,但这种下降将是 渐进的,因为中国家庭可能会保持节俭,企业利润在国民收入中所占的份 额可能持续高企
预计到 2022 年,亚洲新兴和发展中国家占世界产值的比例将与高收入国 家相同。中国的崛起是这种相对经济实力重大转变的主要原因,尽管印度 崛起也同样重要。到 2022 年,中国占世界产值的份额预计将从 1990 年 的 4%升至 21%。预计印度的份额将从 4%升至 10%。 储蓄 按照市场汇率计算,中国的储蓄总额几乎是美国和欧盟的总和。中国储蓄 了几乎一半的国民收入。这种异常高的储蓄率可能下降,但这种下降将是 渐进的,因为中国家庭可能会保持节俭,企业利润在国民收入中所占的份 额可能持续高企
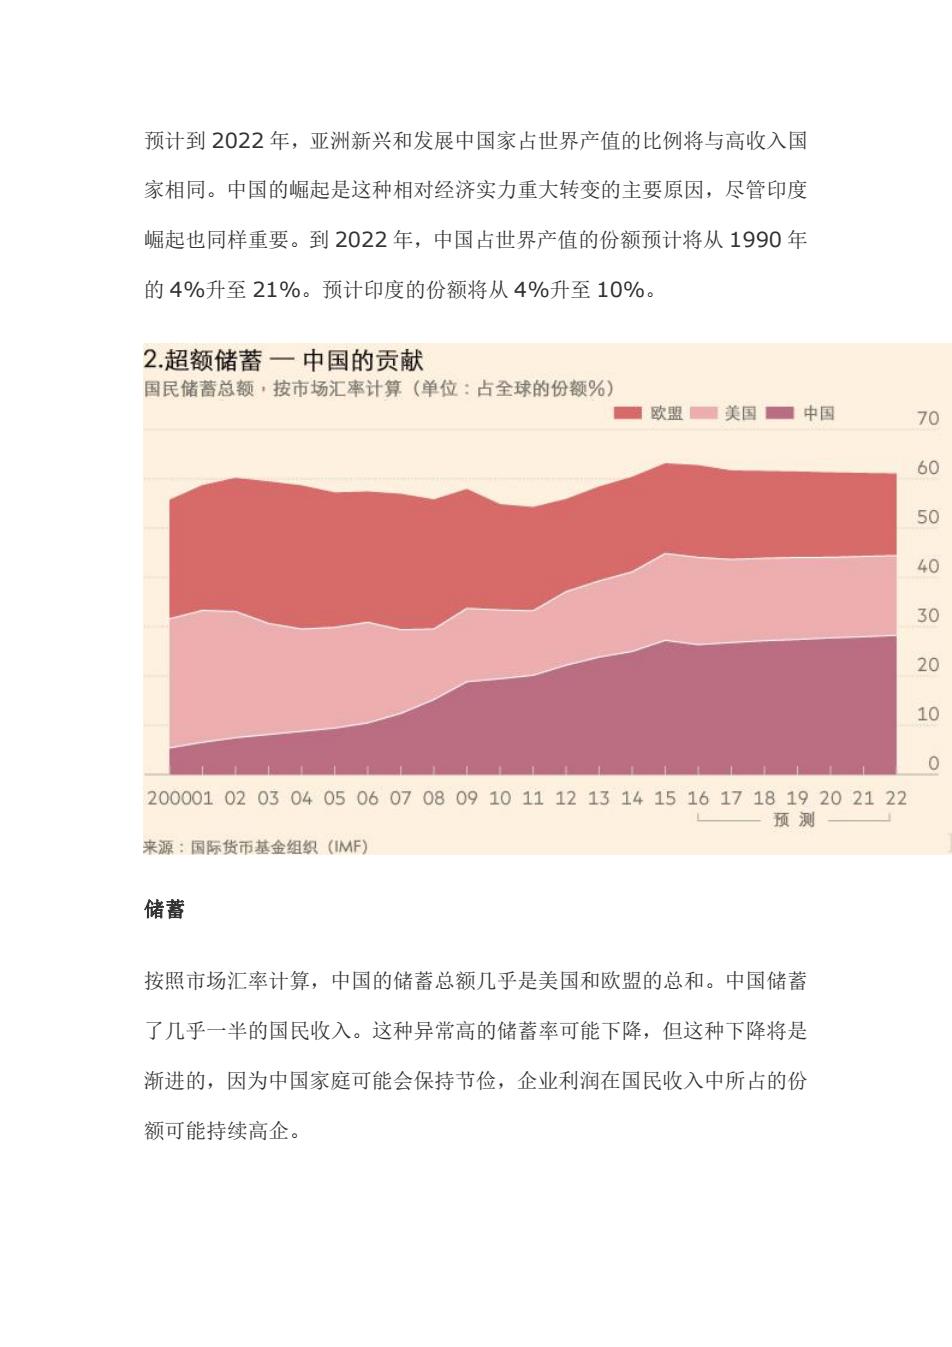
3.人口变迁一人口面貌的变化 占全球人口的份额(单位:%) 100 其他发展中国家 撒哈拉以南 80 非洲地区 其他发展中 亚洲地区 60 印度 40 中国 其他高收入国家 20 欧盟 美国 0 19506070809020001020304050 一预测 来源:国际货币基金组织(IMF) 人口 从1950年到2015年,当前高收入国家的人口占世界人口的比例从27% 大幅下降至15%。甚至中国人口的比例也从1950年的22%下降至2015 年的19%。预计印度到2025年将成为全球人口最多的国家。联合国预 计撒哈拉以南非洲地区的人口到2050年将占到全球人口的22%
人口 从 1950 年到 2015 年,当前高收入国家的人口占世界人口的比例从 27% 大幅下降至15%。甚至中国人口的比例也从1950年的22%下降至2015 年的 19%。预计印度到 2025 年将成为全球人口最多的国家。联合国预 计撒哈拉以南非洲地区的人口到 2050 年将占到全球人口的 22%
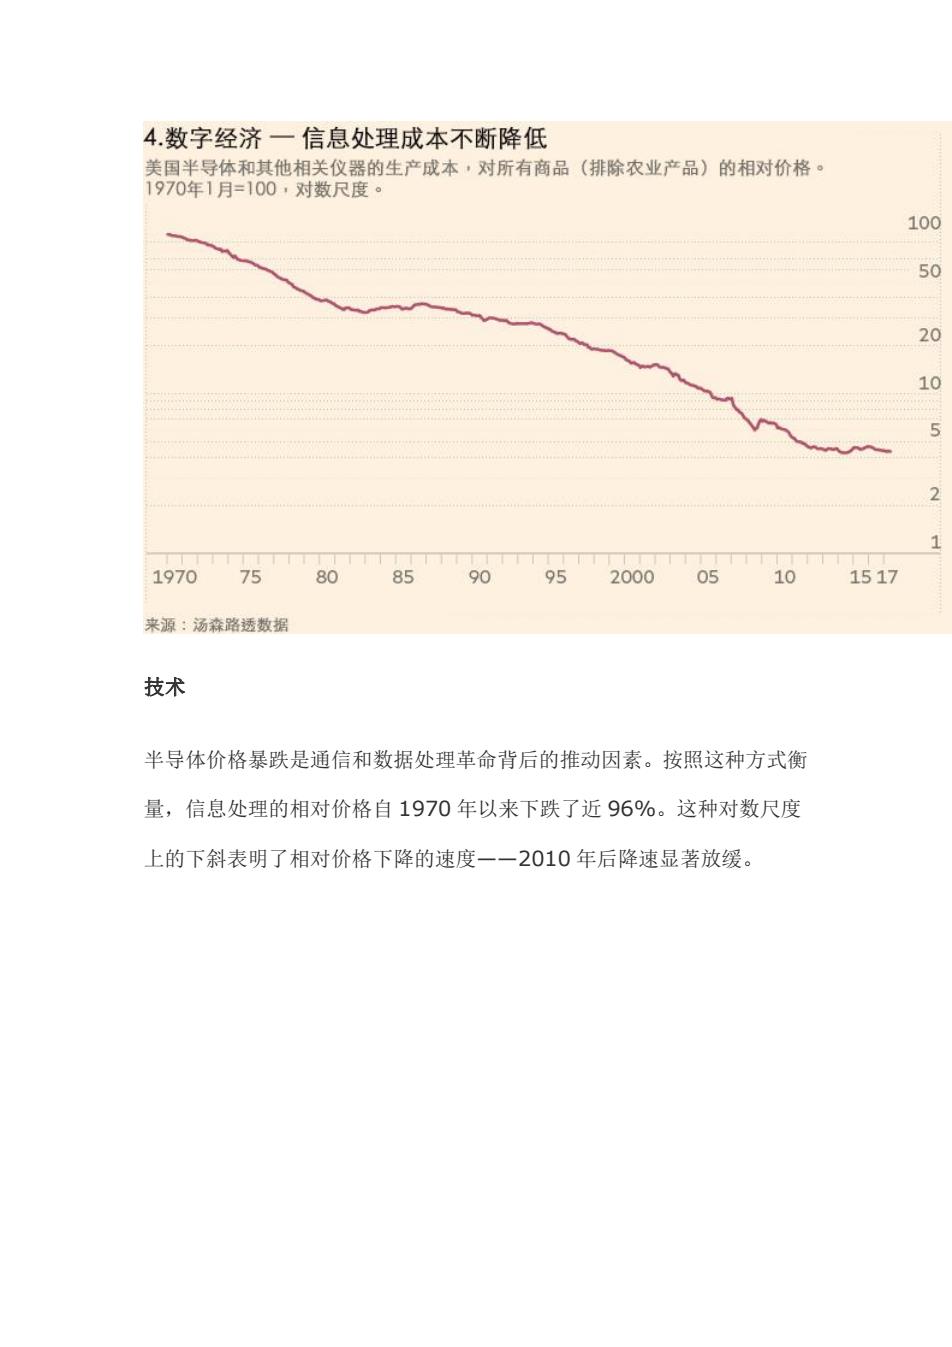
4数字经济一信息处理成本不断降低 美国半导体和其他相关仪器的生产成本·对所有商品(排除农业产品)的相对价格。 1970年1月=100,对数尺度。 100 50 20 10 5 1970 75 80 85 90 95 2000 05 10 1517 来源:汤森路透数据 技术 半导体价格暴跌是通信和数据处理革命背后的推动因素。按照这种方式衡 量,信息处理的相对价格自1970年以来下跌了近96%。这种对数尺度 上的下斜表明了相对价格下降的速度一一2010年后降速显著放缓
技术 半导体价格暴跌是通信和数据处理革命背后的推动因素。按照这种方式衡 量,信息处理的相对价格自 1970 年以来下跌了近 96%。这种对数尺度 上的下斜表明了相对价格下降的速度——2010 年后降速显著放缓

5.生产率增长放缓一大减速 美国全要素生产率的增长率(单位:每年%) 2.0 1.5 1.0 0.5 0 1890-1920 1920-1970 1970-1994 1994-2004 2004-2014 来源:经济学家罗伯特·戈登 生产率 经济学家罗伯特●戈登称,自1970年以来,美国再没有能赶上1920年 至1970年间的生产率表现一一如"全要素生产率"(total factor productivity)的增速所示。全要素生产率衡量的是单位投入的产出的增长 (又称为技术进步率一一译者注)。他还展示了1994年至2014年间美 国生产率又出现爆发式增长,但随后进入了一个生产率增长极慢的时期
生产率 经济学家罗伯特•戈登称,自 1970 年以来,美国再没有能赶上 1920 年 至 1970 年间的生产率表现——如“全要素生产率”(total factor productivity)的增速所示。全要素生产率衡量的是单位投入的产出的增长 (又称为技术进步率——译者注)。他还展示了 1994 年至 2014 年间美 国生产率又出现爆发式增长,但随后进入了一个生产率增长极慢的时期
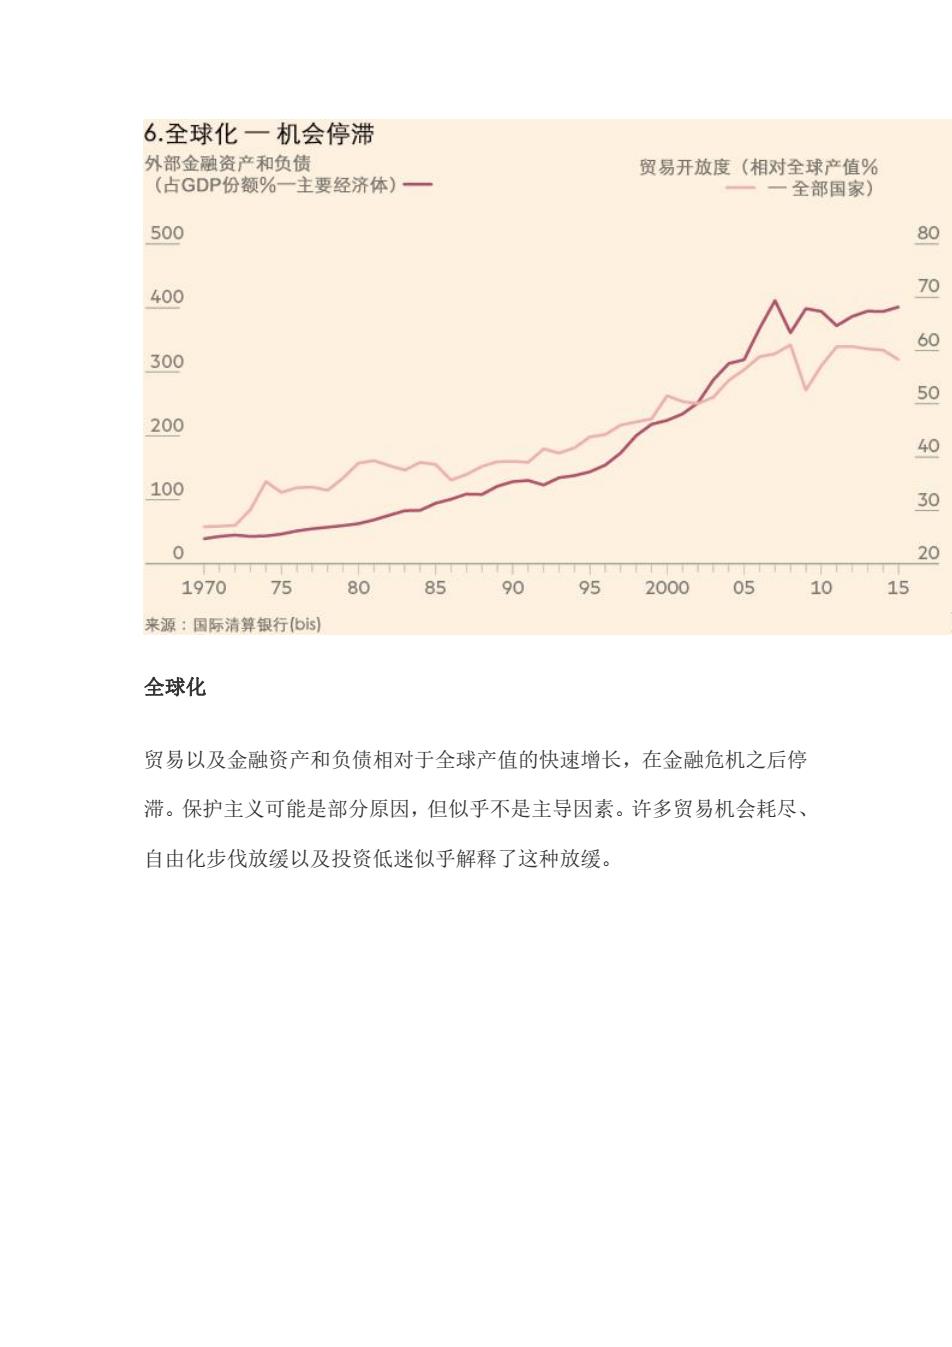
6.全球化一机会停滞 外部金融资产和负债 贸易开放度(相对全球产值% (占GDP份额%一主要经济体)一 一一全部国家) 500 80 400 70 60 300 50 200 40 100 30 0 20 1970 75 80859095 200005 10 15 来源:国际清算银行(bis) 全球化 贸易以及金融资产和负债相对于全球产值的快速增长,在金融危机之后停 滞。保护主义可能是部分原因,但似乎不是主导因素。许多贸易机会耗尽、 自由化步伐放缓以及投资低迷似乎解释了这种放缓
全球化 贸易以及金融资产和负债相对于全球产值的快速增长,在金融危机之后停 滞。保护主义可能是部分原因,但似乎不是主导因素。许多贸易机会耗尽、 自由化步伐放缓以及投资低迷似乎解释了这种放缓
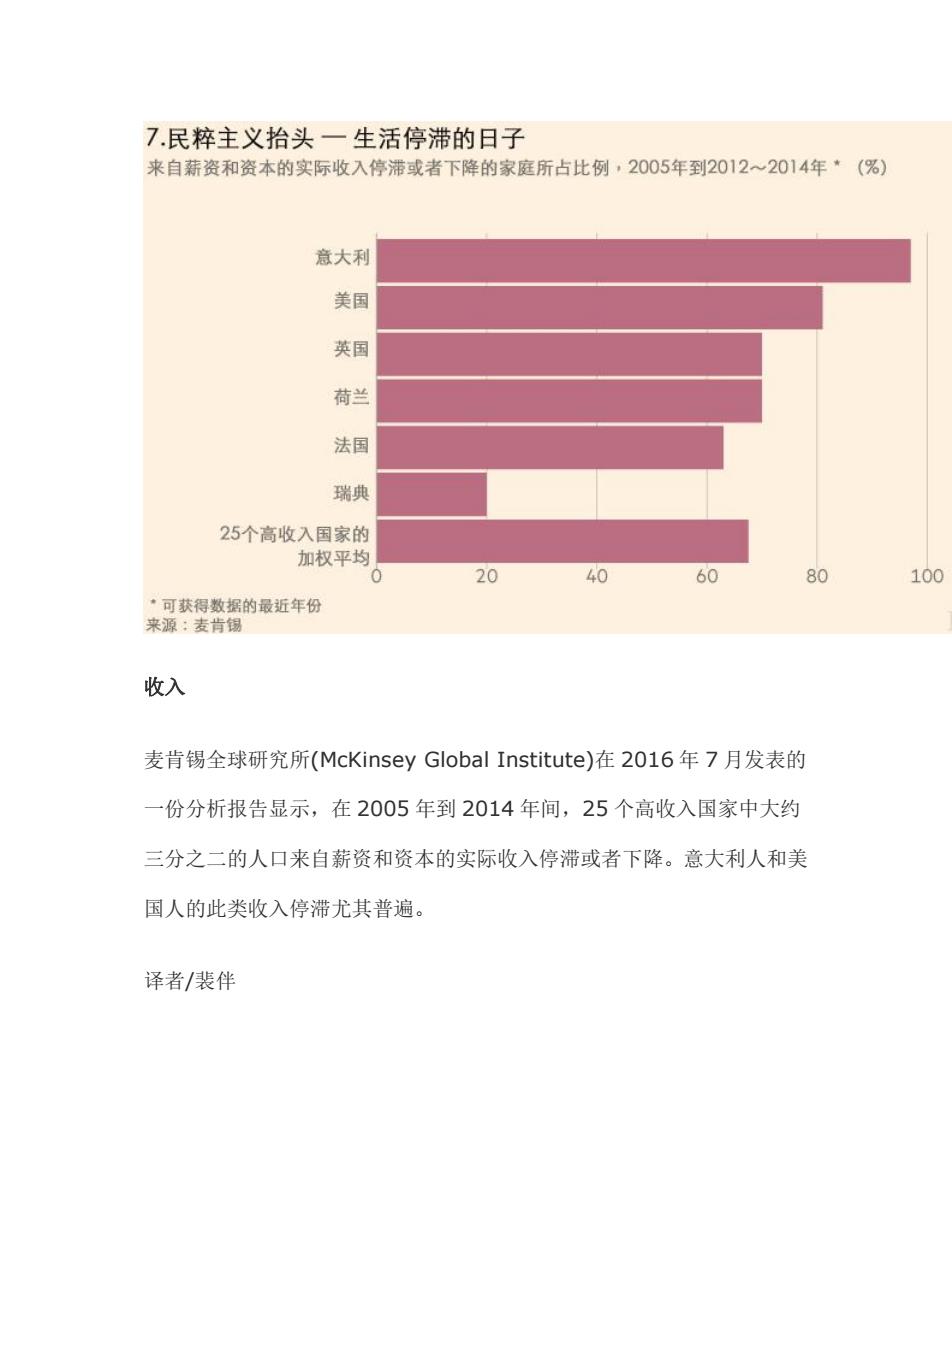
7.民粹主义抬头一生活停滞的日子 来自薪资和资本的实际收入停滞或者下降的家庭所占比例,2005年到2012~2014年*(%) 意大利 美国 英国 荷兰 法国 瑞典 25个高收入国家的 加权平均 0 20 40 60 80 100 ·可获得数据的最近年份 来源:麦肯锡 收入 麦肯锡全球研究所(McKinsey Global Institute))在2016年7月发表的 一份分析报告显示,在2005年到2014年间,25个高收入国家中大约 三分之二的人口来自薪资和资本的实际收入停滞或者下降。意大利人和美 国人的此类收入停滞尤其普遍。 译者/裴伴
收入 麦肯锡全球研究所(McKinsey Global Institute)在 2016 年 7 月发表的 一份分析报告显示,在 2005 年到 2014 年间,25 个高收入国家中大约 三分之二的人口来自薪资和资本的实际收入停滞或者下降。意大利人和美 国人的此类收入停滞尤其普遍。 译者/裴伴