Lecture 2 Foundations of Data Mining
Lecture 2 Foundations of Data Mining

Example 1 Payment prediction Can we predict the salary of one man according to his age,education year and working hours per week? Age Edu.year HoursPerWeek Pay 25 7 40 <50k 38 9 50 ≥50k 28 12 40 ≥50k 24 10 40 <50k 55 4 10 ? Classification
Example 1 Age Edu. year HoursPerWeek Pay 25 7 40 <50k 38 9 50 ≥50k 28 12 40 ≥50k 24 10 40 <50k 55 4 10 ? • Payment prediction – Can we predict the salary of one man according to his age, education year and working hours per week? Classification
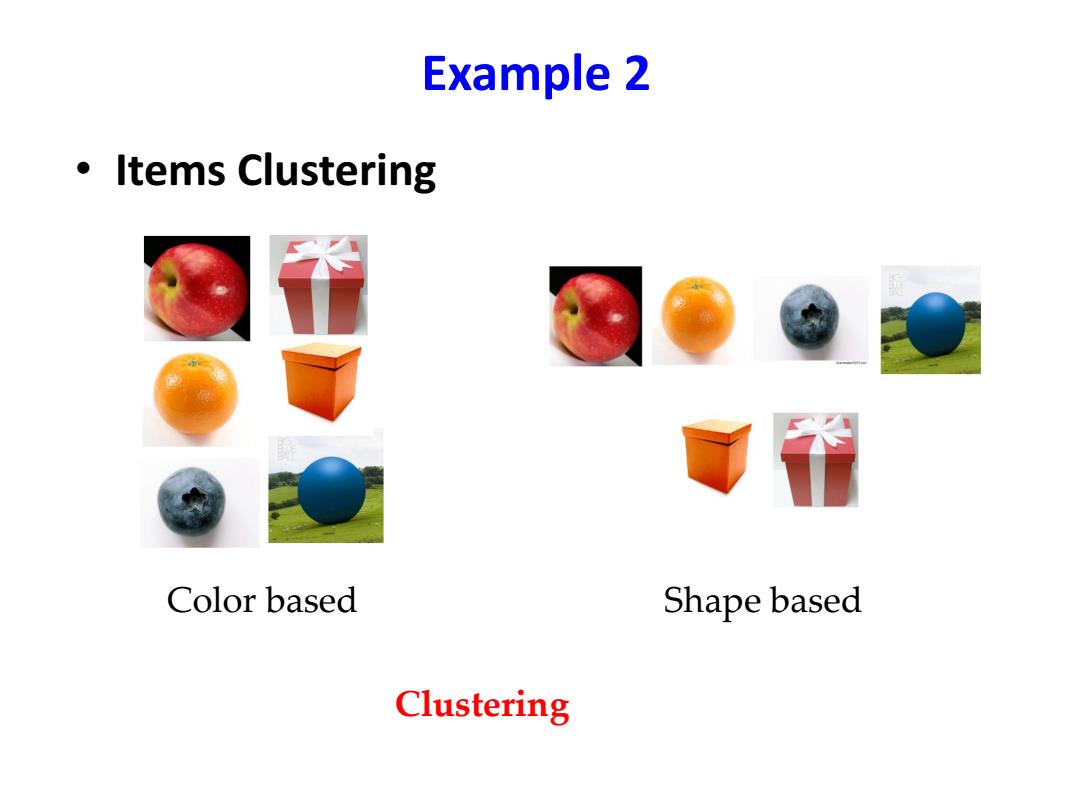
Example 2 。Items Clustering Color based Shape based Clustering
Example 2 • Items Clustering Color based Shape based Clustering
What's tasks in ML? -Supervised learning:targets to learn the mapping function or relationship between the features and the labels based on the labeled data.Namely,Y F(X).(e.g.Classification, Prediction) -Unsupervised learning:aims at learning the intrinsic structure from unlabeled data.(e.g.Clustering,Latent Factor Learning and Frequent Items Mining) -Semi-supervised learning:can be regarded as the unsupervised learning with some constraints on labels,or the supervised learning with additional information on the distribution of data. Classification-Clustering-Association Rule Mining-Outlier Detection
What’s tasks in ML? – Supervised learning: targets to learn the mapping function or relationship between the features and the labels based on the labeled data. Namely, 𝑌 = 𝐹(𝑋|𝜃). (e.g. Classification, Prediction) – Unsupervised learning: aims at learning the intrinsic structure from unlabeled data. (e.g. Clustering, Latent Factor Learning and Frequent Items Mining) – Semi-supervised learning: can be regarded as the unsupervised learning with some constraints on labels, or the supervised learning with additional information on the distribution of data. Classification-Clustering- Association Rule Mining- Outlier Detection

Supervised Learning Given training data ={(x1,y1),(x2,y2),..,(XN,yN)}where yi is the corresponding label of data xi,supervised learning learns the mapping function Y F(X|0),or the posterior distribution P(Y X). Dependent variable:PLAY ·Supervised problems Play Don't Play 5 -Classification OUTLOOK Regression sunny overcast rain Learn to Rank Play 2 Play Play 3 Tagging Don't Play 3 Don't Play 0 Don't Play 2 HUMIDITY WINDY 70 TRUE FALSE Play 2 Play 0 Play 0 Play 3 Don't Play 0 Don't Play 3 Don't Play 2 Don't Play 0
Given training data 𝑋 = x1, y1 , x2, y2 , … , xN, yN where 𝑦𝑖 is the corresponding label of data 𝑥𝑖 , supervised learning learns the mapping function 𝑌 = 𝐹(𝑋|𝜃), or the posterior distribution 𝑃 𝑌 𝑋 . • Supervised problems – Classification – Regression – Learn to Rank – Tagging – …… Supervised Learning

Example:Payment Prediction Revisit o Find the mapping function or model to answer whether one's salary is more than 50k. Age Edu.year HoursPerWeek Pay 25 7 40 <50k 38 9 50 ≥50k 28 12 40 ≥50k 24 10 40 <50k 55 4 10 ?
• Find the mapping function or model to answer whether one’s salary is more than 50k. Example: Payment Prediction Revisit Age Edu. year HoursPerWeek Pay 25 7 40 <50k 38 9 50 ≥50k 28 12 40 ≥50k 24 10 40 <50k 55 4 10 ?
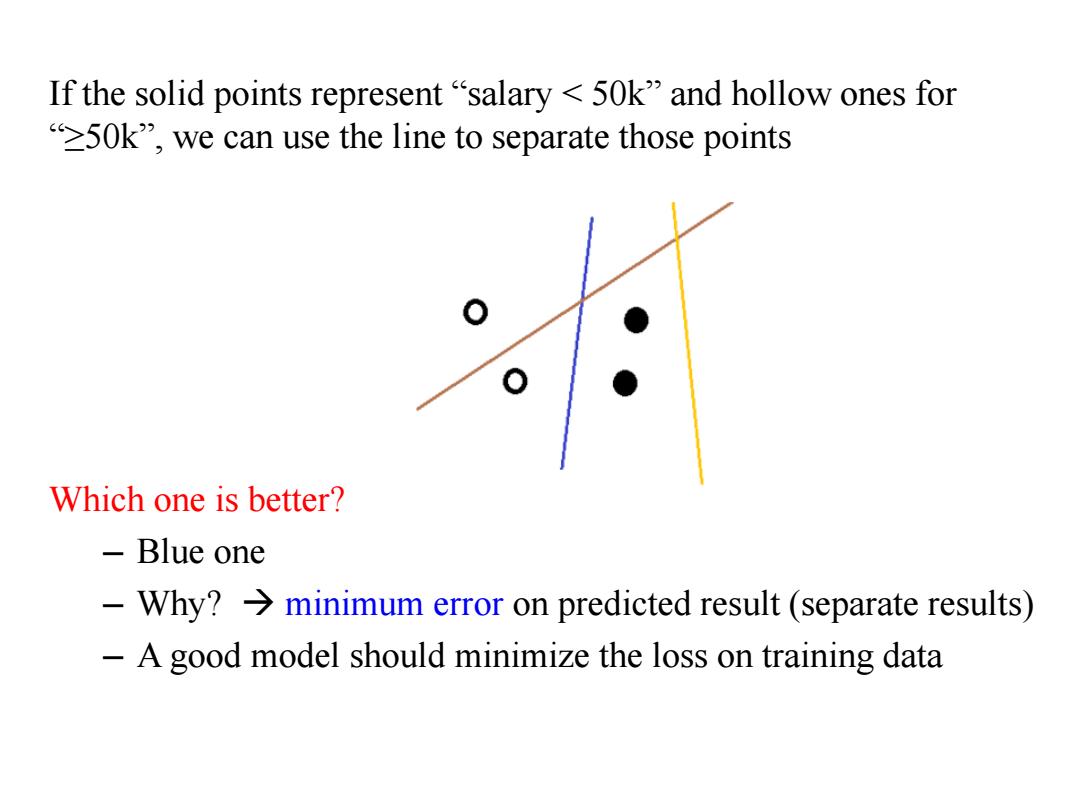
If the solid points represent"salary 50k"and hollow ones for 50k",we can use the line to separate those points Which one is better? Blue one -Why?>minimum error on predicted result(separate results) -A good model should minimize the loss on training data
If the solid points represent “salary < 50k” and hollow ones for “≥50k”, we can use the line to separate those points Which one is better? – Blue one – Why? minimum error on predicted result (separate results) – A good model should minimize the loss on training data
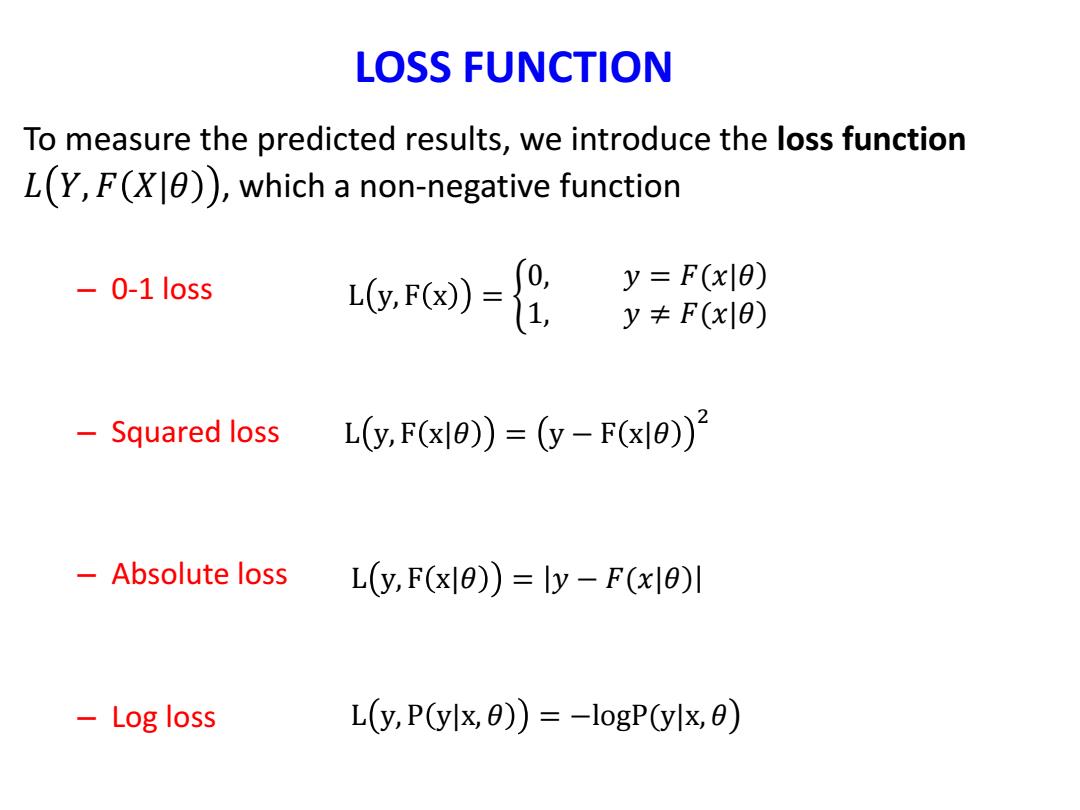
LOSS FUNCTION To measure the predicted results,we introduce the loss function L(Y,F(X)),which a non-negative function -0-1 loss 6,w)- y=F(x|8) y+F(x|0) Squared loss L(y,F(x)=(y-F(x8)1 Absolute loss L(y,F(x10))=ly-F(x10)I Log loss L(y,P(ylx,0))=-logP(ylx,0)
To measure the predicted results, we introduce the loss function 𝐿 𝑌, 𝐹 𝑋|𝜃 , which a non-negative function – 0-1 loss – Squared loss – Absolute loss – Log loss LOSS FUNCTION L y, F x = 0, 𝑦 = 𝐹(𝑥|𝜃) 1, 𝑦 ≠ 𝐹(𝑥|𝜃) L y, F x|𝜃 = y − F x|𝜃 2 L y, F x|𝜃 = 𝑦 − 𝐹(𝑥|𝜃) L y, P y|x, 𝜃 = −logP(y|x, 𝜃
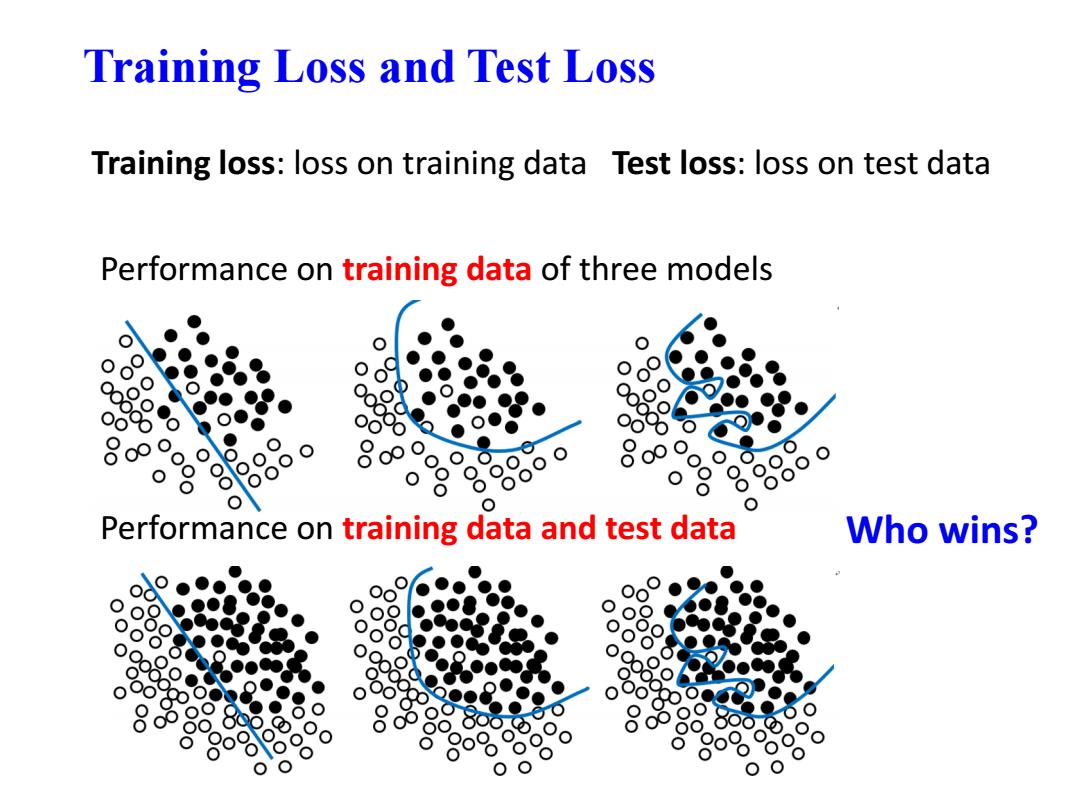
Training Loss and Test Loss Training loss:loss on training data Test loss:loss on test data Performance on training data of three models 8 000 )● Performance on training data and test data Who wins? ●
Performance on training data of three models Performance on training data and test data Training Loss and Test Loss Who wins? Training loss: loss on training data Test loss: loss on test data

Generalization Empirical risk: R回-∑6ox》 Note:A good model cannot only take training loss into account and minimize the empirical risk.Instead,improve the model generalization Model Model Model True function True function True function Samples Samples ●Samples Model Selection:To avoid Underfitting and Overfitting
Empirical risk: Note: A good model cannot only take training loss into account and minimize the empirical risk. Instead, improve the model generalization. Generalization R F = 1 N 𝑖=1 𝑁 L yi , F xi Model Selection: To avoid Underfitting and Overfitting