Algorithms for Clustering Data Anil K.Jain Richard C.Dubes Michigan State University Prentice Hall Englewood Cliffs,New Jersey 07632
Contents PREFACE Xiⅷ 1 INTRODUCTION 1 2 DATA REPRESENTATION 7 2.1 Data Types and Data Scales 8 2.2 Proximity Indices 14 2.3 Normalization 23 2.4 Linear Projections 25 2.5 Nonlinear Projections 37 2.6 Intrinsic Dimensionality 42 2.7 Multidimensional Scaling 46 2.8 Summary 54 3 CLUSTERING METHODS AND ALGORITHMS 55 3.1 General Introduction 55 3.2 Hierarchical Clustering 58 i议

Contents 3.3 Partitional Clustering 89 3.4 Clustering Software 133 3.5 Clustering Methodology 135 3.6 Summary 141 4 CLUSTER VALIDITY 143 4.1 Background 143 4.2 Indices of Cluster Validity 160 4.3 Validity of Hierarchical Structures 165 4.4 Validity of Partitional Structures 172 4.5 Validity of Individual Clusters 188 4.6 Clustering Tendency 201 4.7 Summary 222 5 APPLICATIONS 223 5.1 Image Processing 224 5.2 Image Segmentation by Clustering 225 5.3 Segmentation of Textured Images 227 5.4 Segmentation of Range Images 232 5.5 Segmentation of Multispectral Images 235 5.6 Image Registration 237 5.7 Summary 240 A PATTERN RECOGNITION 241 B DISTRIBUTIONS 246 B.1 The Gaussian Distribution 246 B.2 The Hypergeometric Distribution 249 LINEAR ALGEBRA 252 D SCATTER MATRICES 258 E FACTOR ANALYSIS 260

Contents xi F MULTIVARIATE ANALYSIS OF VARIANCE 264 G GRAPH THEORY 266 G.1 Definitions 266 G.2 Trees 270 G.3 Random Graphs 272 H ALGORITHM FOR GENERATING CLUSTERED DATA 273 BIBLIOGRAPHY 275 AUTHOR INDEX 297 GENERAL INDEX 304
Preface Cluster analysis is an important technique in the rapidly growing field known as exploratory data analysis and is being applied in a variety of engineering and scientific disciplines such as biology,psychology,medicine,marketing,computer vision,and remote sensing.Cluster analysis organizes data by abstracting underly- ing structure either as a grouping of individuals or as a hierarchy of groups.The representation can then be investigated to see if the data group according to precon- ceived ideas or to suggest new experiments.Cluster analysis is a tool for exploring the structure of the data that does not require the assumptions common to most statistical methods.It is called"'unsupervised learning''in the literature of pattern recognition and artificial intelligence. This book will be useful for those in the scientific community who gather data and seek tools for analyzing and interpreting data.It will be a valuable reference for scientists in a variety of disciplines and can serve as a textbook for a graduate course in exploratory data analysis as well as a supplemental text in courses on research methodology,pattern recognition,image processing,and re- mote sensing.The book emphasizes informal algorithms for clustering data,and interpreting results.Graphical procedures and other tools for visually representing data are introduced both to evaluate the results of clustering and to explore data. Mathematical and statistical theory are introduced only when necessary. Most existing books on cluster analysis are written by mathematicians,numer- ical taxonomists,social scientists,and psychologists who emphasize either the methods that lend themselves to mathematical treatment or the applications in their particular area.Our book strives for a sense of completeness and for a balanced xiii
xiv Preface presentation.We bring together many results that are scattered through the literature of several fields.The most unique feature of this book is its thorough,understand- able treatment of cluster validity,or the objective validation of the results of cluster analysis,from the application viewpoint. This book resulted from class notes that the authors have used in a graduate course on clustering and scaling algorithms in the Department of Computer Science at Michigan State University.We owe a debt of gratitude to the many graduate students who have helped develop this book.Special thanks are due to Karl Pettis, Tom Bailey,Neal Wyse,Steve Smith,Gautam Biswas,George Cross,James Coggins,Phil Nagan,Rick Hoffman,Xiaobo Li,Pat Flynn,and C.C.Chen. The prerequisite for this course is probability theory,matrix algebra,computer programming,and data structures.In addition to homework problems and an exam, the students in this course work on a project which can range from the analysis of a real data set to comparative analysis of various algorithms.This course is particularly useful for students who wish to pursue research in pattern recognition, image processing,and artificial intelligence.Interested readers may contact the authors for homework problems for this course. We have a long-standing interest in cluster analysis,especially in the problems of cluster validity and cluster tendency.Our research in this area has been funded by the National Science Foundation.We are grateful to NSF for this support. We also wish to acknowledge the support and the facilities provided by the Depart- ment of Computer Science,Michigan State University,which were essential for the completion of this book. A.K.JAIN R.C.DUBES
二1 Introduction The practice of classifying objects according to perceived similarities is the basis for much of science.Organizing data into sensible groupings is one of the most fundamental modes of understanding and learning.Cluster analysis is the formal study of algorithms and methods for grouping,or classifying,objects.An object is described either by a set of measurements or by relationships between the object and other objects.Cluster analysis does not use category labels that tag objects with prior identifiers.The absence of category labels distinguishes cluster analysis from discriminant analysis (and pattern recognition and decision analysis).The objective of cluster analysis is simply to find a convenient and valid organization of the data,not to establish rules for separating future data into categories.Clustering algorithms are geared toward finding structure in the data. A cluster is comprised of a number of similar objects collected or grouped together.Everitt (1974)documents some of the following definitions of a cluster: 1."A cluster is a set of entities which are alike,and entities from different clusters are not alike.'' 2."A cluster is an aggregation of points in the test space such that the distance between any two points in the cluster is less than the distance between any point in the cluster and any point not in it. 3."'Clusters may be described as connected regions of a multi-dimensional space containing a relatively high density of points,separated from other such regions by a region containing a relatively low density of points." 1
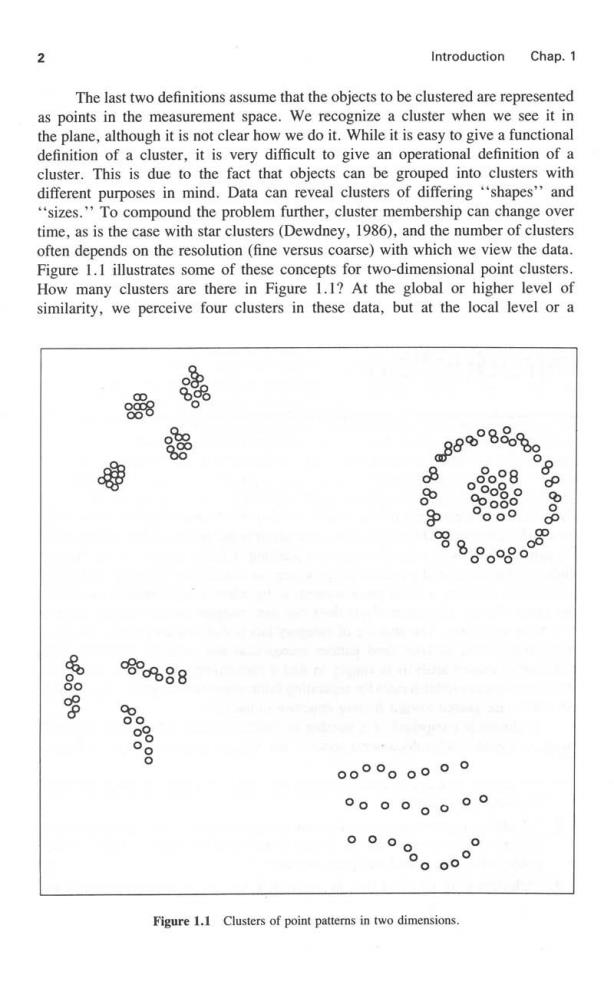
2 Introduction Chap.1 The last two definitions assume that the objects to be clustered are represented as points in the measurement space.We recognize a cluster when we see it in the plane,although it is not clear how we do it.While it is easy to give a functional definition of a cluster,it is very difficult to give an operational definition of a cluster.This is due to the fact that objects can be grouped into clusters with different purposes in mind.Data can reveal clusters of differing"shapes"and "sizes."To compound the problem further,cluster membership can change over time,as is the case with star clusters(Dewdney,1986),and the number of clusters often depends on the resolution (fine versus coarse)with which we view the data. Figure 1.I illustrates some of these concepts for two-dimensional point clusters. How many clusters are there in Figure 1.1?At the global or higher level of similarity,we perceive four clusters in these data,but at the local level or a 88 w89888」 0 o98 oo o 8 8 8 0o0 00 8 8 8 8 85% c8A88 00 8 00°°。000° 00 0 0 Figure 1.1 Clusters of point patterns in two dimensions
Chap.1 Introduction 3 12 lower similarity threshold,we perceive nine clusters.Which answer is correct? Looking at the data at multiple scales may actually help in analyzing its structure. Thus the crucial problem in identifying clusters in data is to specify what proximity is and how to measure it.As is to be expected,the notion of proximity is problem dependent. Clustering techniques offer several advantages over a manual grouping pro- cess.First,a clustering program can apply a specified objective criterion consistently to form the groups.Human beings are excellent cluster seekers in two and often in three dimensions,but different individuals do not always identify the same clusters in data.The proximity measure defining similarity among objects depends on an individual's educational and cultural background.Thus it is quite common for different human subjects to form different groups in the same data,especially when the groups are not well separated.Second,a clustering algorithm can form the groups in a fraction of time required by a manual grouping,particularly if a long list of descriptors or features is associated with each object.The speed, reliability,and consistency of a clustering algorithm in organizing data together constitute an overwhelming reason to use it.A clustering algorithm relieves a scientist or data analyst of the treacherous job of "looking''at a pattern matrix or a similarity matrix to detect clusters.A data analyst's time is better spent in analyzing or interpreting the results provided by a clustering algorithm. Clustering is also useful in implementing the"divide and conquerstrategy to reduce the computational complexity of various decision-making algorithms in pattern recognition.For example,the nearest-neighbor decision rule is a popular technique in pattern recognition (Duda and Hart,1973).However,finding the nearest neighbor of a test pattern can be very time consuming if the number of training patterns or prototypes is large.Fukunaga and Narendra(1975)used the well-known partitional clustering algorithm,ISODATA(Chapter 3),to decompose the patterns,and then in conjunction with the branch-and-bound method obtained an efficient algorithm to compute nearest neighbors.Similarly,Fukunaga and Short (1978)used clustering for problem localization,whereby a simple decision rule can be implemented in local regions or clusters of the pattern space.The applications of clustering continue to grow. Consider the problem of grouping various colleges and universities in the United States to illustrate the factors in clustering problems.Schools can be clustered based on their geographical location,size of the student body,size of the campus, tuition fee,or offerings of various professional graduate programs.The factors depend on the goal of the analysis.The shapes and sizes of the clusters formed will depend on which particular attribute is used in defining the similarity between colleges.Interesting and challenging clustering problems arise when several attri- butes are taken together to construct clusters.One cluster could represent private, midwestern,and primarily liberal arts colleges with fewer than 1000 students and another can represent large state universities.The features or attributes that we have mentioned so far can easily be measured.What about such attributes as quality of education,quality of faculty,and the quality of campus life,which
4 Introduction Chap.1 cannot be measured easily?One can poll alumni or a panel of experts to get either a numerical score (on a scale of,say,I to 10)for these factors or similarity measures for all pairs of universities.These scores or similarities must be averaged over all respondents because individual opinions differ.One can also measure subjective attributes indirectly.For example,faculty excellence in a graduate pro- gram can be estimated from the number of professional papers written and number of Ph.D.degrees awarded. The example above illustrates the difference between decision making and clustering.Suppose that we want to partition computer science graduate programs in the United States into two categories based on such attributes as size of faculty, computing resources,external research support,and faculty publications.In the decision-making paradigm,an"'expert'must first define these two categories by identifying some computer science programs from each of the two categories (these are the training samples in pattern recognition terminology).The attributes of these training samples will be used to construct decision boundaries (or simply thresholds on attribute values)that will separate the two types of programs.Once the decision boundary is available,the remaining computer science programs(those that were not labeled by the expert)will be assigned to one of the two categories. In the clustering paradigm,no expert is available to define the categories.The objective is to determine whether a two-category partition of the data,based on the given attributes,is reasonable,and if so,to determine the memberships of the two clusters.This can be achieved by forming similarities between all pairs of computer science graduate programs based on the given attributes and then constructing groups such that the within-group similarities are larger than the be- tween-group similarities. Cluster analysis is one component of exploratory data analysis,which means sifting through data to make sense out of measurements by whatever means are available.The information gained about a set of data from a cluster analysis should prod one's creativity,suggest new experiments,and provide fresh insight into the subject matter.The modern digital computer makes all this possible. Cluster analysis is a child of the computer revolution and frees the analyst from time-honored statistical models and procedures conceived when the human brain was aided only by pencil and paper.The development of clustering methodol- ogy has been truly interdisciplinary.Researchers in almost every area of science that collects data have contributed,such as taxonomists,psychologists,biologists, statisticians,social scientists,and engineers.I.J.Good (1977)has suggested the new name botryology for the discipline of cluster analysis,from the Greek word for a cluster of grapes. One objective of this book is to encourage communication among disciplines. All too often,the same procedures are developed in different disciplines but are so clothed in the language of the individual disciplines that cross fertilization is severely hindered.A casual scan of the bibliography for this book reveals citations from almost 100 different journals.Only the Journal of Classification,a publication of the Classification Society of North America which first appeared in 1984,is