
上游充通大粤 SHANGHAI JIAO TONG UNIVERSITY 第6 章国际能源物流地理
第 6 章 国际能源物流地理
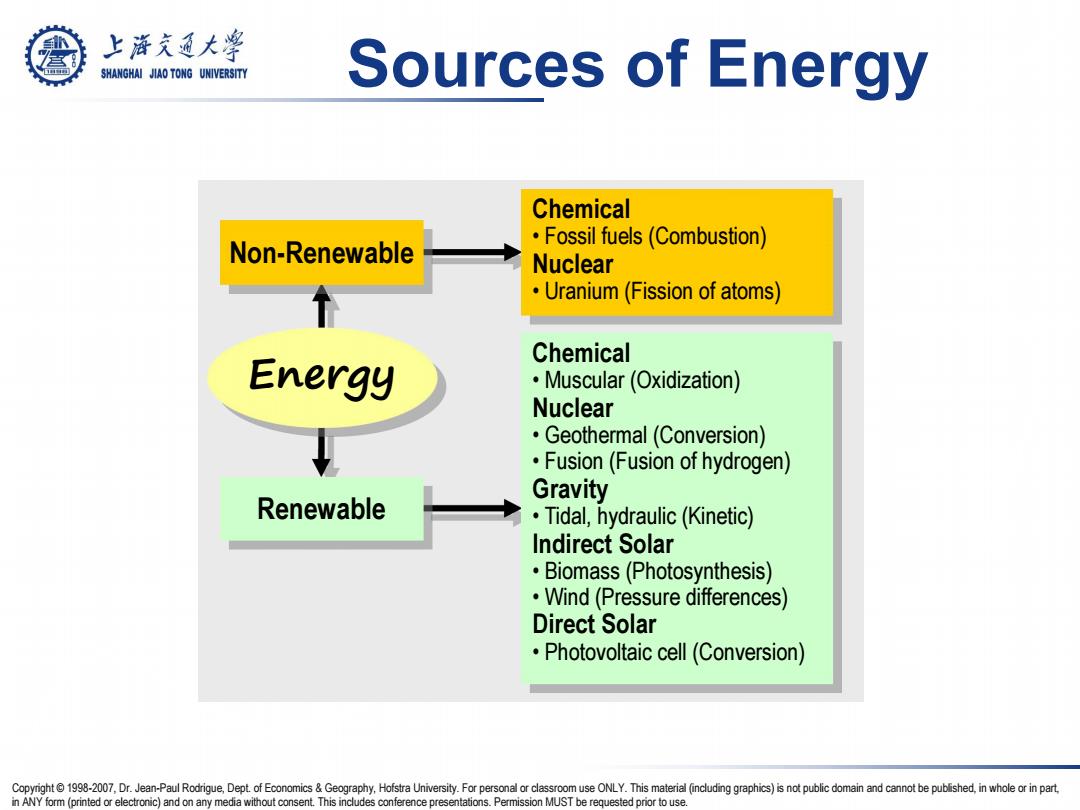
上游充通大兽 SHANGHAI JIAO TONG UNIVERSITY Sources of Energy Chemical Fossil fuels(Combustion) Non-Renewable Nuclear Uranium(Fission of atoms) Chemical Energy Muscular(Oxidization) Nuclear Geothermal(Conversion) Fusion(Fusion of hydrogen) Gravity Renewable Tidal,hydraulic(Kinetic) Indirect Solar Biomass(Photosynthesis) Wind(Pressure differences) Direct Solar Photovoltaic cell (Conversion) Copyright1998-2007,Dr.Jean-Paul Rodrigue,Dept.of Economics&Geography,Hofstra University.For personal or classroom use ONLY.This material (including graphics)is not public domain and cannot be published,in whole or in part. in ANY form (printed or electronic)and on any media without consent.This includes conference presentations.Permission MUST be requested prior to use
Copyright © 1998-2007, Dr. Jean-Paul Rodrigue, Dept. of Economics & Geography, Hofstra University. For personal or classroom use ONLY. This material (including graphics) is not public domain and cannot be published, in whole or in part, in ANY form (printed or electronic) and on any media without consent. This includes conference presentations. Permission MUST be requested prior to use. Sources of Energy Chemical • Fossil fuels (Combustion) Nuclear • Uranium (Fission of atoms) Energy Non-Renewable Renewable Chemical • Muscular (Oxidization) Nuclear • Geothermal (Conversion) • Fusion (Fusion of hydrogen) Gravity • Tidal, hydraulic (Kinetic) Indirect Solar • Biomass (Photosynthesis) • Wind (Pressure differences) Direct Solar • Photovoltaic cell (Conversion)
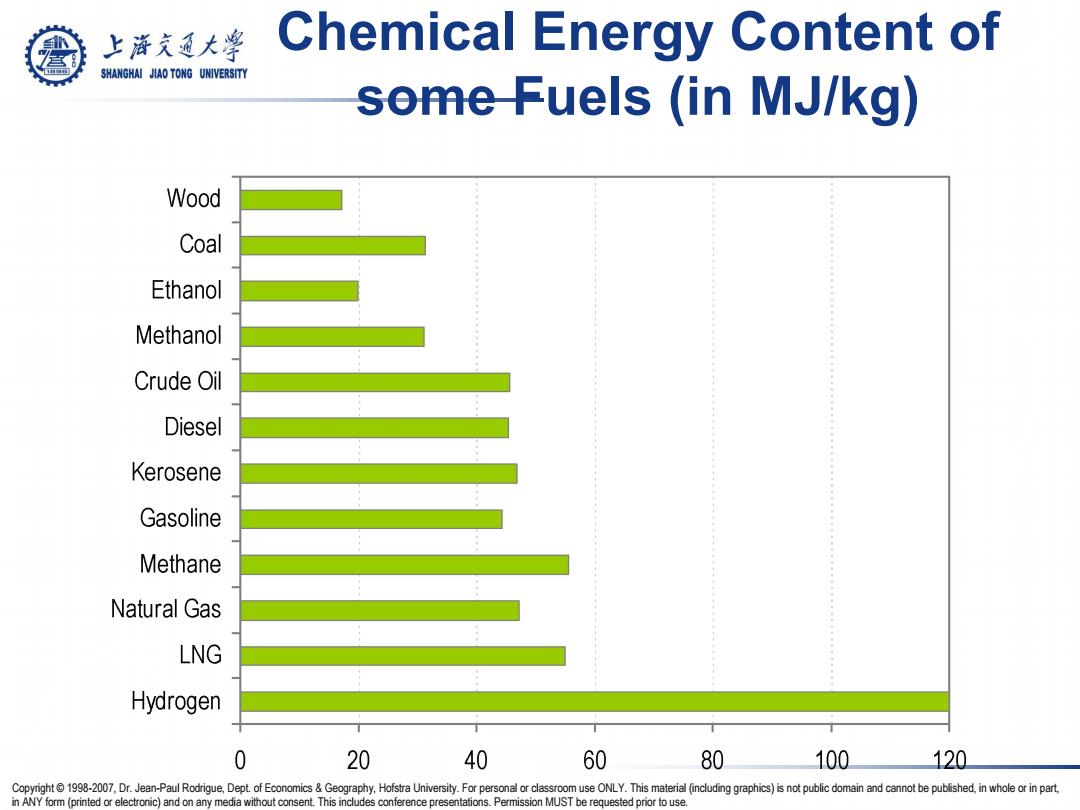
上游究通大学 Chemical Energy Content of SHANGHAI JIAO TONG UNIVERSITY seme Fuels (in MJ/kg) Wood Coal Ethanol Methanol Crude Oil Diesel Kerosene Gasoline Methane Natural Gas LNG Hydrogen 0 20 40 60 80 100 120 Copyright1998-2007,Dr.Jean-Paul Rodrigue,Dept.of Economics&Geography,Hofstra University.For personal or classroom use ONLY.This material (including graphics)is not public domain and cannot be published,in whole or in part. in ANY form (printed or electronic)and on any media without consent.This includes conference presentations.Permission MUST be requested prior to use
Copyright © 1998-2007, Dr. Jean-Paul Rodrigue, Dept. of Economics & Geography, Hofstra University. For personal or classroom use ONLY. This material (including graphics) is not public domain and cannot be published, in whole or in part, in ANY form (printed or electronic) and on any media without consent. This includes conference presentations. Permission MUST be requested prior to use. Chemical Energy Content of some Fuels (in MJ/kg)
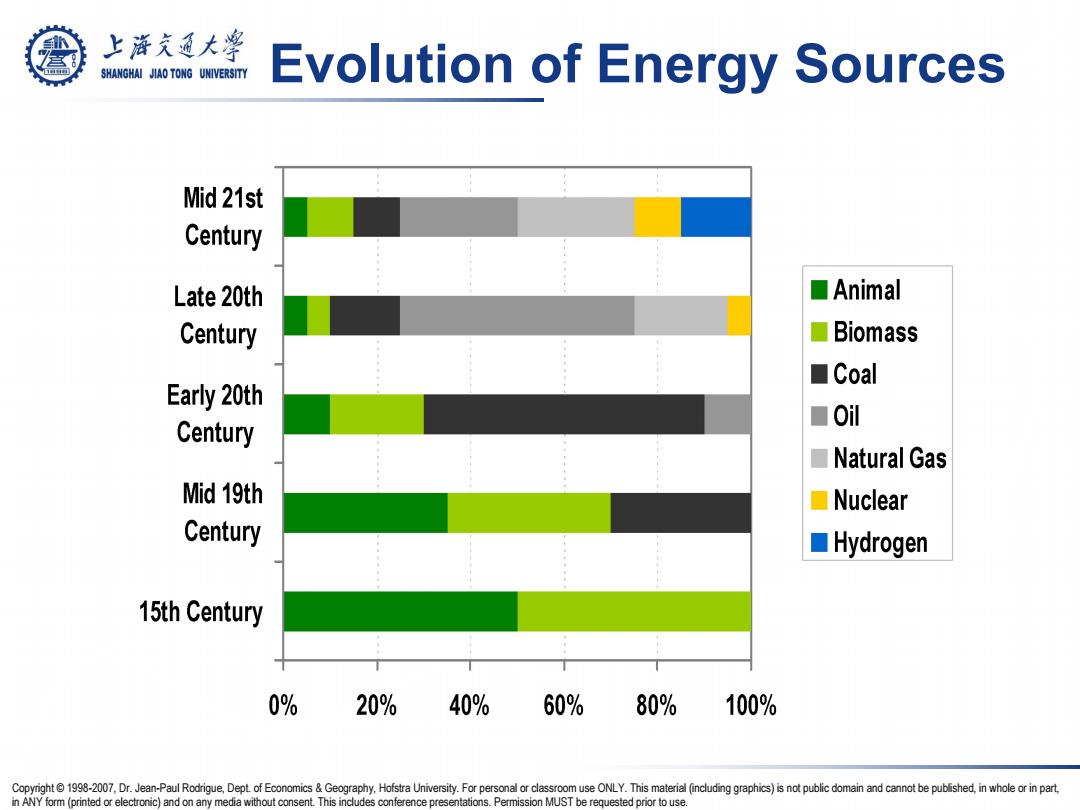
上游充通大兽 SHANGHAI JIAO TONG UNIVERSITY Evolution of Energy Sources Mid 21st Century Late 20th ☐Animal Century ☐Biomass ■Coal Early 20th ■0il Century Natural Gas Mid 19th ☐Nuclear Century ■Hydrogen 15th Century 0% 20% 40% 60% 80% 100% Copyright1998-2007,Dr.Jean-Paul Rodrigue,Dept.of Economics&Geography,Hofstra University.For personal or classroom use ONLY.This material (including graphics)is not public domain and cannot be published,in whole or in part. in ANY form(printed or electronic)and on any media without consent.This includes conference presentations.Permission MUST be requested prior to use
Copyright © 1998-2007, Dr. Jean-Paul Rodrigue, Dept. of Economics & Geography, Hofstra University. For personal or classroom use ONLY. This material (including graphics) is not public domain and cannot be published, in whole or in part, in ANY form (printed or electronic) and on any media without consent. This includes conference presentations. Permission MUST be requested prior to use. Evolution of Energy Sources
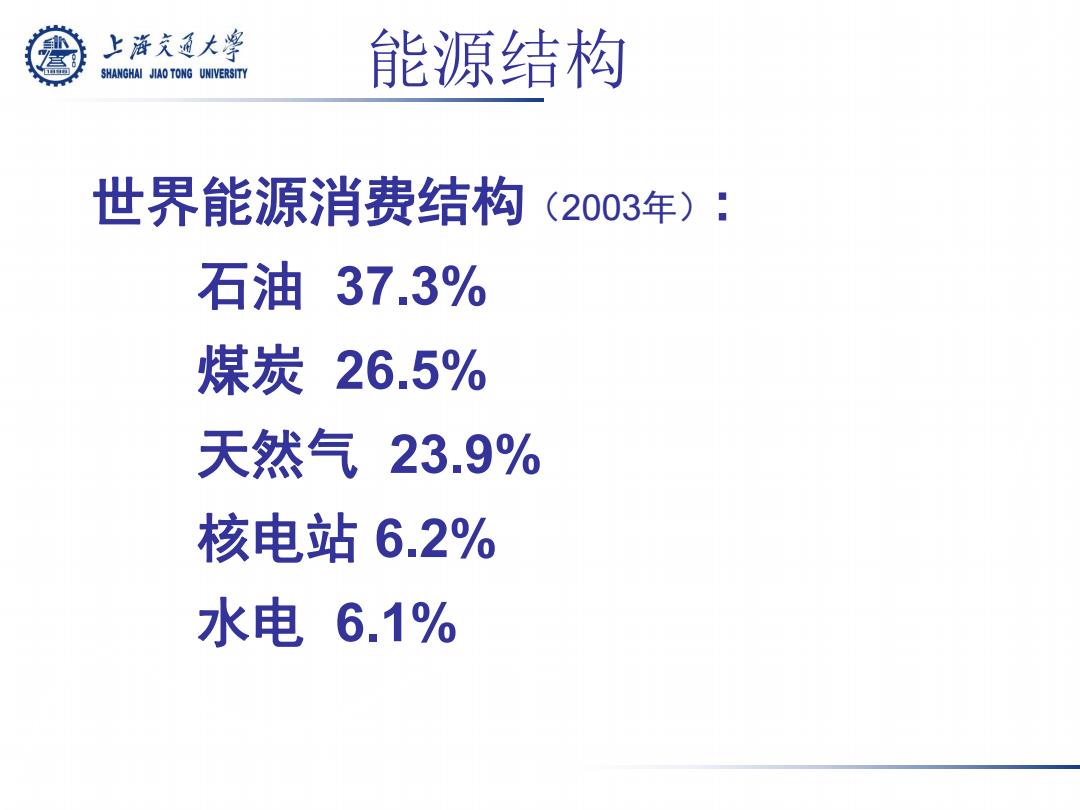
上游充通大学 SHANGHAI JIAO TONG UNIVERSITY 能源结构 世界能源消费结构(2003年): 石油37.3% 煤炭26.5% 天然气23.9% 核电站6.2% 水电6.1%
能源结构 世界能源消费结构(2003年): 石油 37.3% 煤炭 26.5% 天然气 23.9% 核电站 6.2% 水电 6.1%
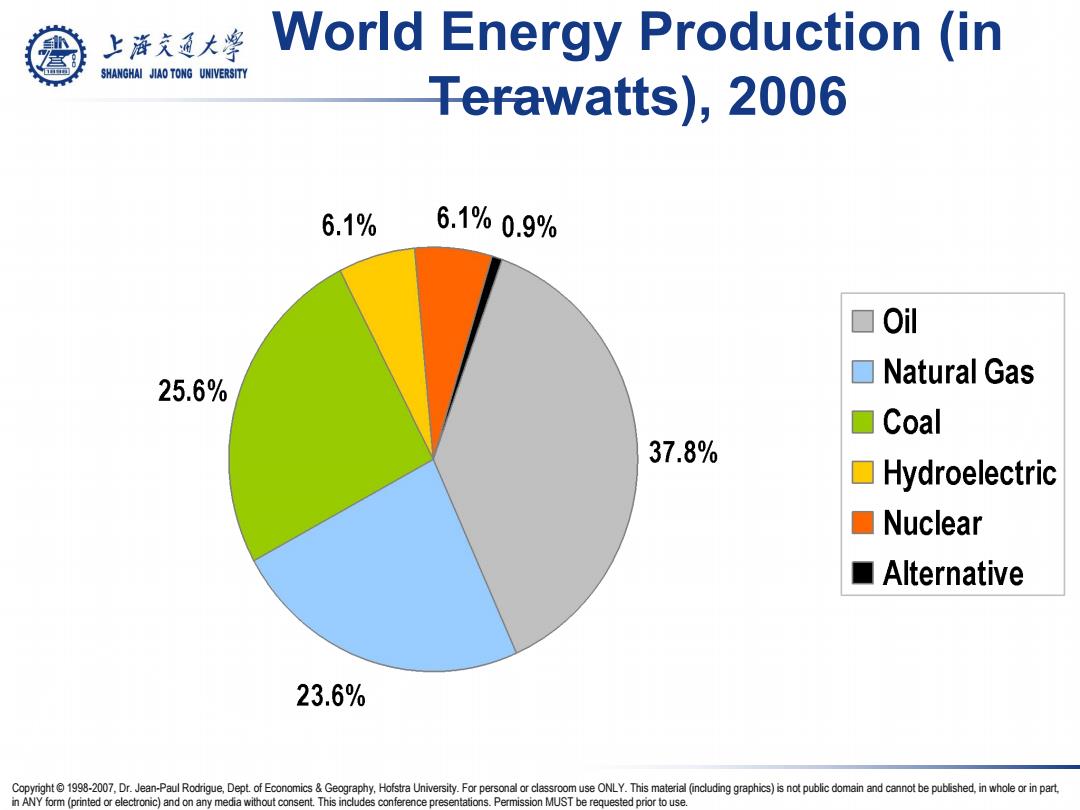
上游充通大¥ World Energy Production (in SHANGHAI JIAO TONG UNIVERSITY Terawatts),2006 6.1% 6.1%0.9% Oil ▣Natural Gas 25.6% □Coal 37.8% ▣Hydroelectric ☐Nuclear ■Alternative 23.6% Copyright1998-2007,Dr.Jean-Paul Rodrigue,Dept.of Economics&Geography,Hofstra University.For personal or classroom use ONLY.This material (including graphics)is not public domain and cannot be published,in whole or in part. in ANY form (printed or electronic)and on any media without consent.This includes conference presentations.Permission MUST be requested prior to use
Copyright © 1998-2007, Dr. Jean-Paul Rodrigue, Dept. of Economics & Geography, Hofstra University. For personal or classroom use ONLY. This material (including graphics) is not public domain and cannot be published, in whole or in part, in ANY form (printed or electronic) and on any media without consent. This includes conference presentations. Permission MUST be requested prior to use. World Energy Production (in Terawatts), 2006
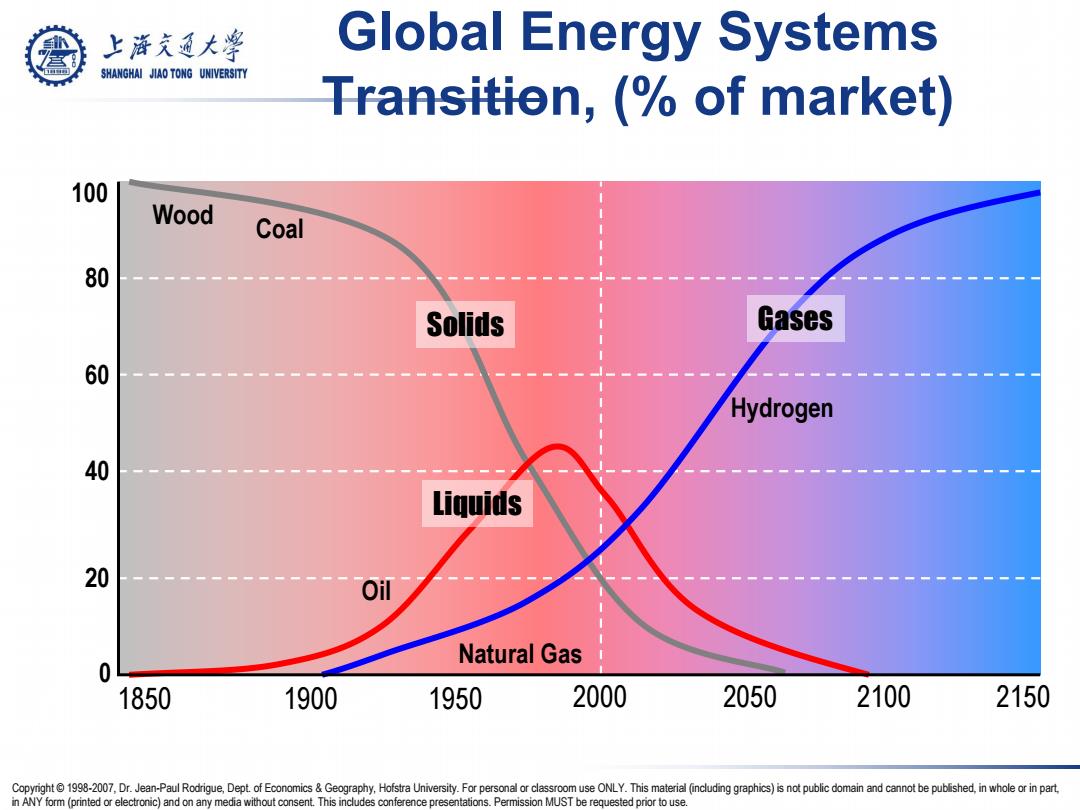
上游究通大学 Global Energy Systems SHANGHAI JIAO TONG UNIVERSITY Transition,(of market) 100 Wood Coal 80 Solids Gases 60 Hydrogen 40 Liquids 20 Oil Natural Gas 0 1850 1900 1950 2000 2050 2100 2150 Copyright1998-2007,Dr.Jean-Paul Rodrigue,Dept.of Economics&Geography,Hofstra University.For personal or classroom use ONLY.This material (including graphics)is not public domain and cannot be published,in whole or in part. in ANY form(printed or electronic)and on any media without consent.This includes conference presentations.Permission MUST be requested prior to use
Copyright © 1998-2007, Dr. Jean-Paul Rodrigue, Dept. of Economics & Geography, Hofstra University. For personal or classroom use ONLY. This material (including graphics) is not public domain and cannot be published, in whole or in part, in ANY form (printed or electronic) and on any media without consent. This includes conference presentations. Permission MUST be requested prior to use. Global Energy Systems Transition, (% of market) 1850 1900 1950 2000 2050 2100 2150 100 80 60 40 20 0 Solids Liquids Gases Wood Coal Oil Natural Gas Hydrogen
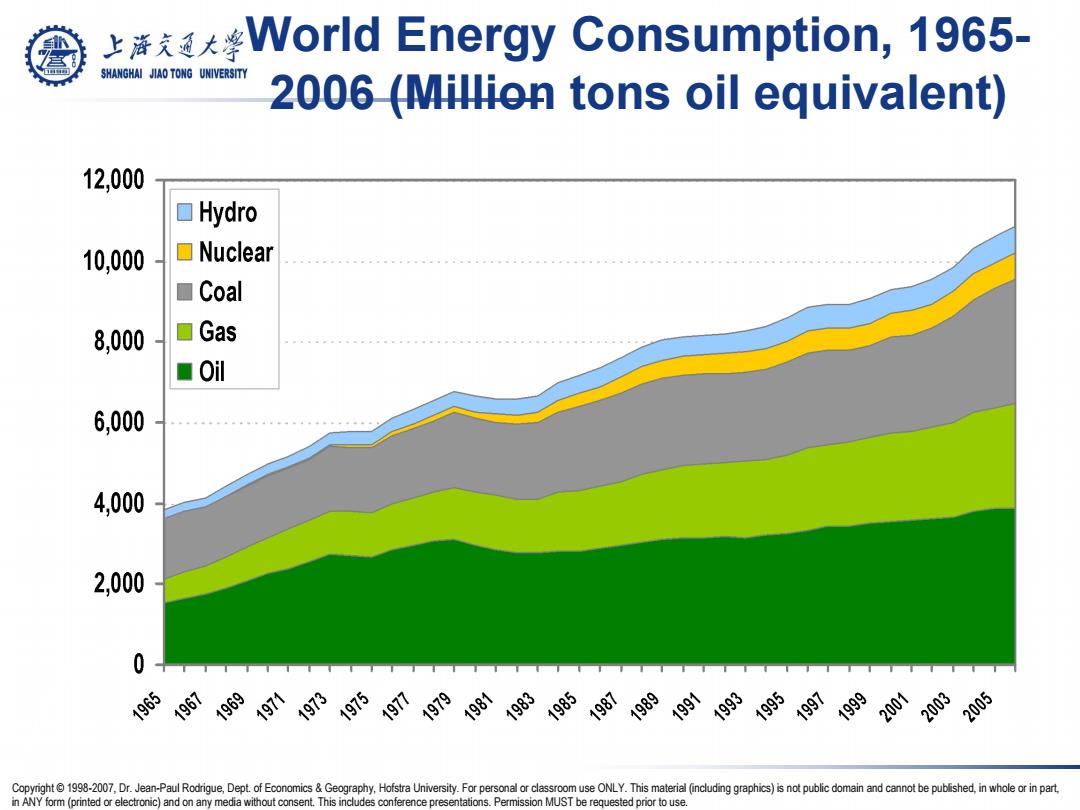
上游文通大 World Energy Consumption,1965- SHANGHAI JIAO TONG UNIVERSITY 2006 (Million tons oil equivalent) 12,000 Hydro 10,000 Nuclear ■Coal 8,000 Gas ■Oil 6,000 4,000 2,000 0、 Copyright1998-2007,Dr.Jean-Paul Rodrigue,Dept.of Economics&Geography,Hofstra University.For personal or classroom use ONLY.This material (including graphics)is not public domain and cannot be published,in whole or in part. in ANY form(printed or electronic)and on any media without consent.This includes conference presentations.Permission MUST be requested prior to use
Copyright © 1998-2007, Dr. Jean-Paul Rodrigue, Dept. of Economics & Geography, Hofstra University. For personal or classroom use ONLY. This material (including graphics) is not public domain and cannot be published, in whole or in part, in ANY form (printed or electronic) and on any media without consent. This includes conference presentations. Permission MUST be requested prior to use. World Energy Consumption, 1965- 2006 (Million tons oil equivalent)
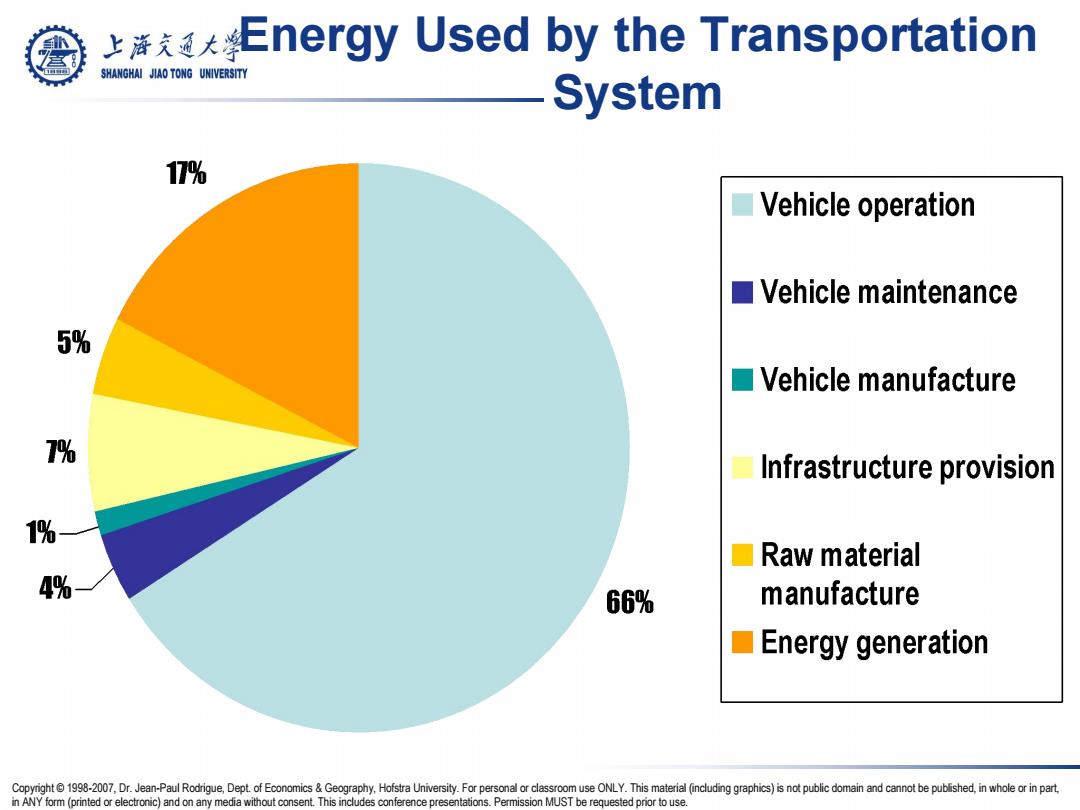
上大Energy Used by the Transportation SHANGHAI JIAO TONG UNIVERSITY System 17% Vehicle operation ■Vehicle maintenance 5% ■Vehicle manufacture % Infrastructure provision 1%- ☐Raw material 4% 66% manufacture Energy generation Copyright1998-2007,Dr.Jean-Paul Rodrigue,Dept.of Economics&Geography,Hofstra University.For personal or classroom use ONLY.This material (including graphics)is not public domain and cannot be published,in whole or in part. in ANY form (printed or electronic)and on any media without consent.This includes conference presentations.Permission MUST be requested prior to use
Copyright © 1998-2007, Dr. Jean-Paul Rodrigue, Dept. of Economics & Geography, Hofstra University. For personal or classroom use ONLY. This material (including graphics) is not public domain and cannot be published, in whole or in part, in ANY form (printed or electronic) and on any media without consent. This includes conference presentations. Permission MUST be requested prior to use. Energy Used by the Transportation System
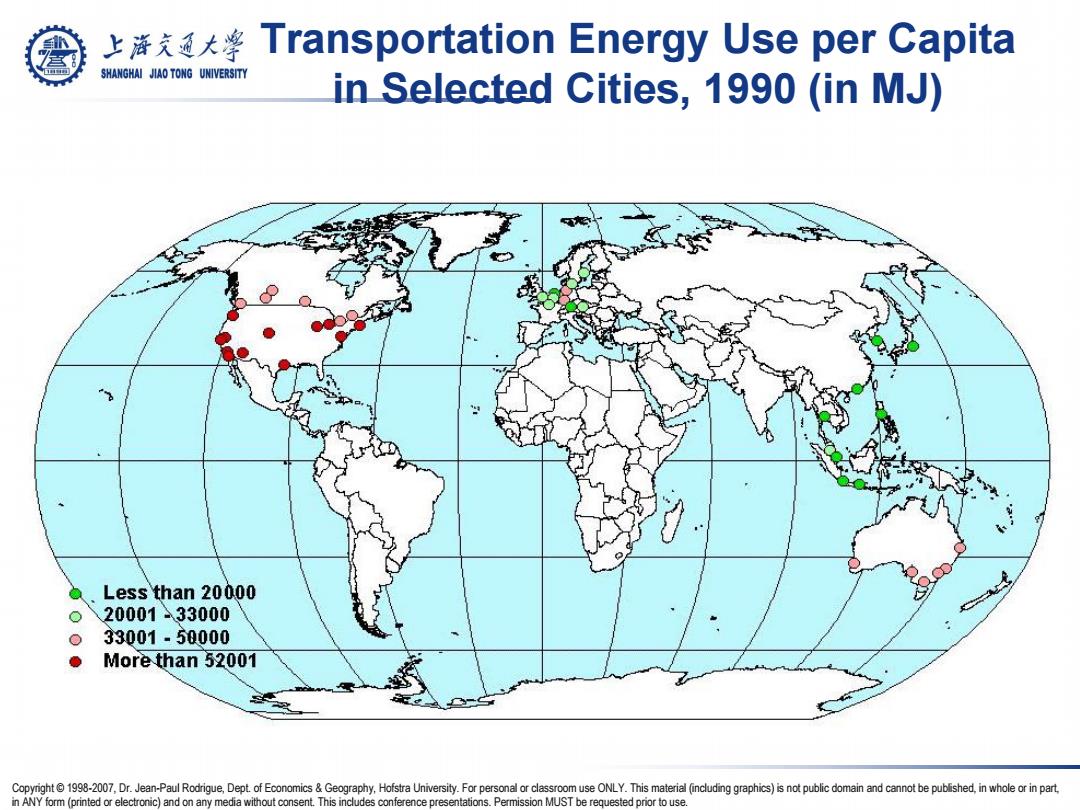
上游充通大学 Transportation Energy Use per Capita SHANGHAI JIAO TONG UNIVERSITY in Selected Cities,1990 (in MJ) Less than 20000 2000133000 33001-50000 More than 52001 Copyright1998-2007,Dr.Jean-Paul Rodrigue,Dept.of Economics&Geography,Hofstra University.For personal or classroom use ONLY.This material (including graphics)is not public domain and cannot be published,in whole or in part. in ANY form(printed or electronic)and on any media without consent.This includes conference presentations.Permission MUST be requested prior to use
Copyright © 1998-2007, Dr. Jean-Paul Rodrigue, Dept. of Economics & Geography, Hofstra University. For personal or classroom use ONLY. This material (including graphics) is not public domain and cannot be published, in whole or in part, in ANY form (printed or electronic) and on any media without consent. This includes conference presentations. Permission MUST be requested prior to use. Transportation Energy Use per Capita in Selected Cities, 1990 (in MJ)