Chapter 3: Receptor Theory and Pharmacodynamics (2) Prof.R.D.Ye 2012-09-19
Chapter 3: Receptor Theory and Pharmacodynamics (2) Prof. R.D. Ye 2012-09-19
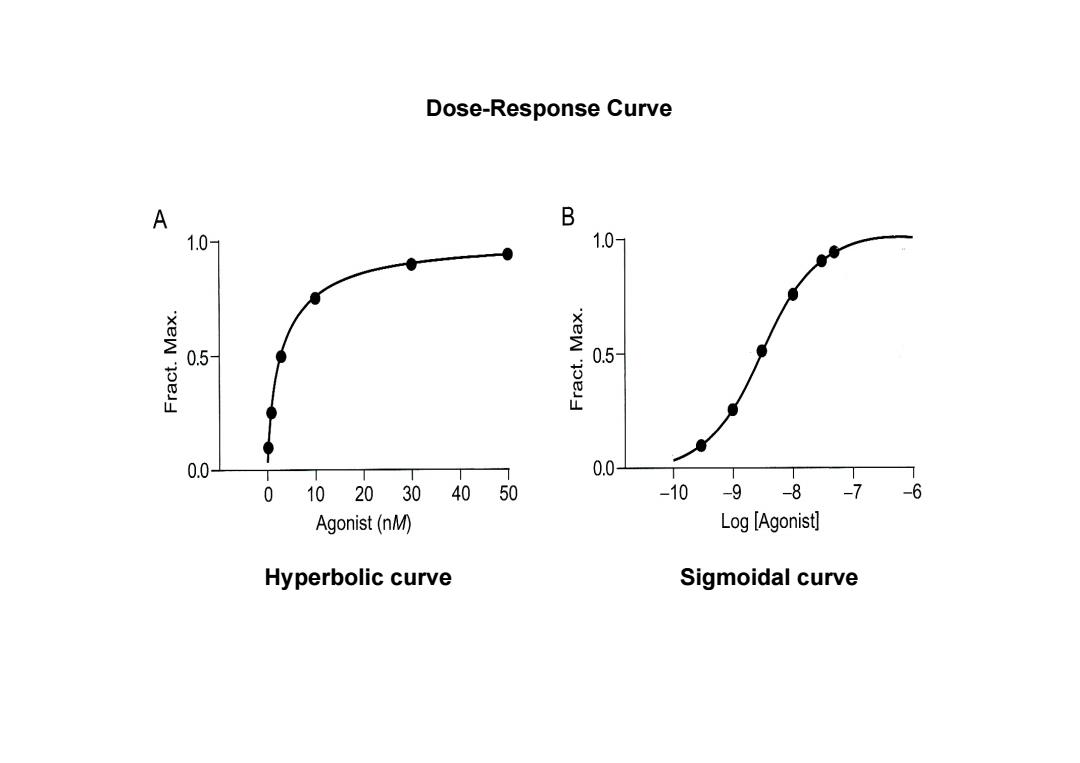
Dose-Response Curve A B 1.0- 1.0- 0.5- 0.5 0.0- 0.0- 0 102030 40 50 -10 8-76 -9 Agonist(nM) Log [Agonist] Hyperbolic curve Sigmoidal curve
Dose-Response Curve Hyperbolic curve Sigmoidal curve
Dose-response relationship The relationship between the concentration of a drug at the receptor site and the magnitude of the response is called the dose- response relationship.Depending on the purpose of the studies,this relationship can be described in terms of a graded (continuous) response or a quantal (all-or-none)response
Dose‐response relationship • The relationship between the concentration of a drug at the receptor site and the magnitude of the response is called the dose‐ response relationship. Depending on the purpose of the studies, this relationship can be described in terms of a graded (continuous) response or a quantal (all‐or‐none) response

Efficacy and Potency of Dose-Response Curve. Drug A is more potent than Drug B,but both show Drug C shows same efficacy. lower potency and lower efficacy than Drug A or B. 100 50 Drug A Drug B Drug C Log drug concentration ↑ 1 foB8 O A fOr Di积gB Figure 2.7 Typical dose response curve for drugs showing differences in potency and efficacy.EDso drug dose that shows 50%of maximal response
Efficacy and Potency of Dose-Response Curve
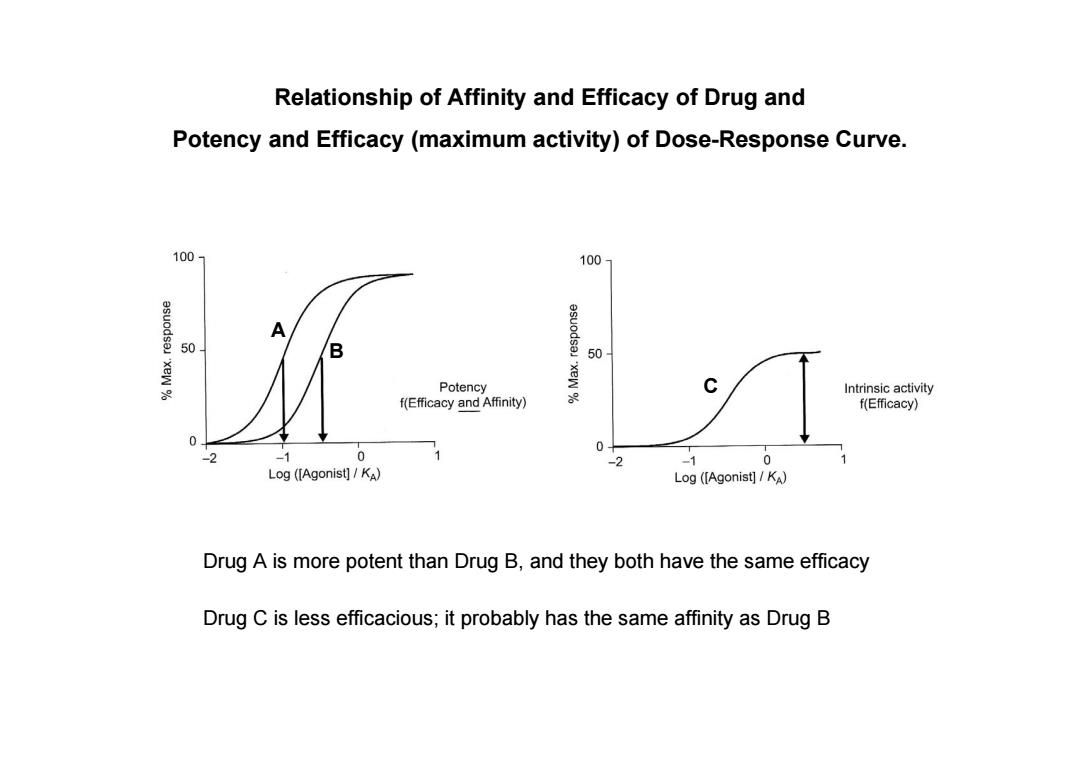
Relationship of Affinity and Efficacy of Drug and Potency and Efficacy(maximum activity)of Dose-Response Curve. 100- 1007 A 50 B 50 Potency xeW 88 Intrinsic activity f(Efficacy and Affinity) f(Efficacy) 0 2 -1 0 -1 0 Log ([Agonist]/KA) Log ([Agonist]KA) Drug A is more potent than Drug B,and they both have the same efficacy Drug C is less efficacious;it probably has the same affinity as Drug B
Relationship of Affinity and Efficacy of Drug and Potency and Efficacy (maximum activity) of Dose-Response Curve. Drug A is more potent than Drug B, and they both have the same efficacy A B C Drug C is less efficacious; it probably has the same affinity as Drug B
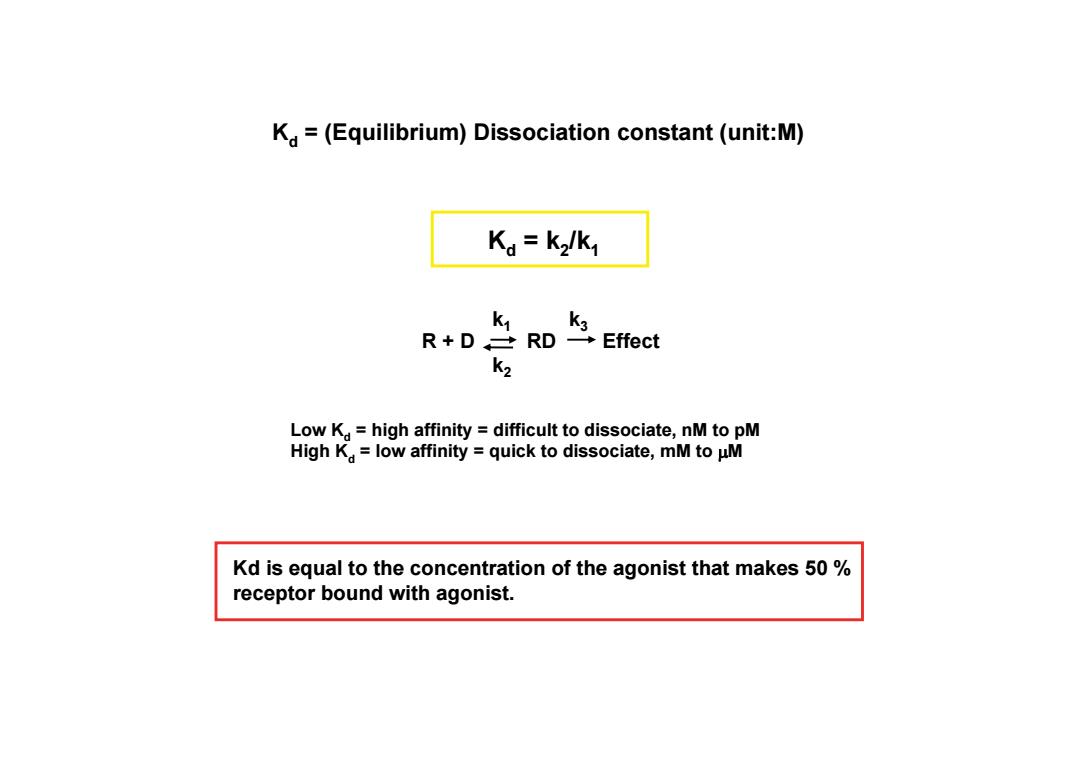
K =(Equilibrium)Dissociation constant(unit:M) Kd=k2/k1 K1 K3 R+D士RD→Effect K2 Low K=high affinity difficult to dissociate,nM to pM High K=low affinity quick to dissociate,mM to uM Kd is equal to the concentration of the agonist that makes 50% receptor bound with agonist
Kd = (Equilibrium) Dissociation constant (unit:M) Low Kd = high affinity = difficult to dissociate, nM to pM High Kd = low affinity = quick to dissociate, mM to M R + D RD Effect k1 k2 k3 Kd = k2/k1 Kd is equal to the concentration of the agonist that makes 50 % receptor bound with agonist
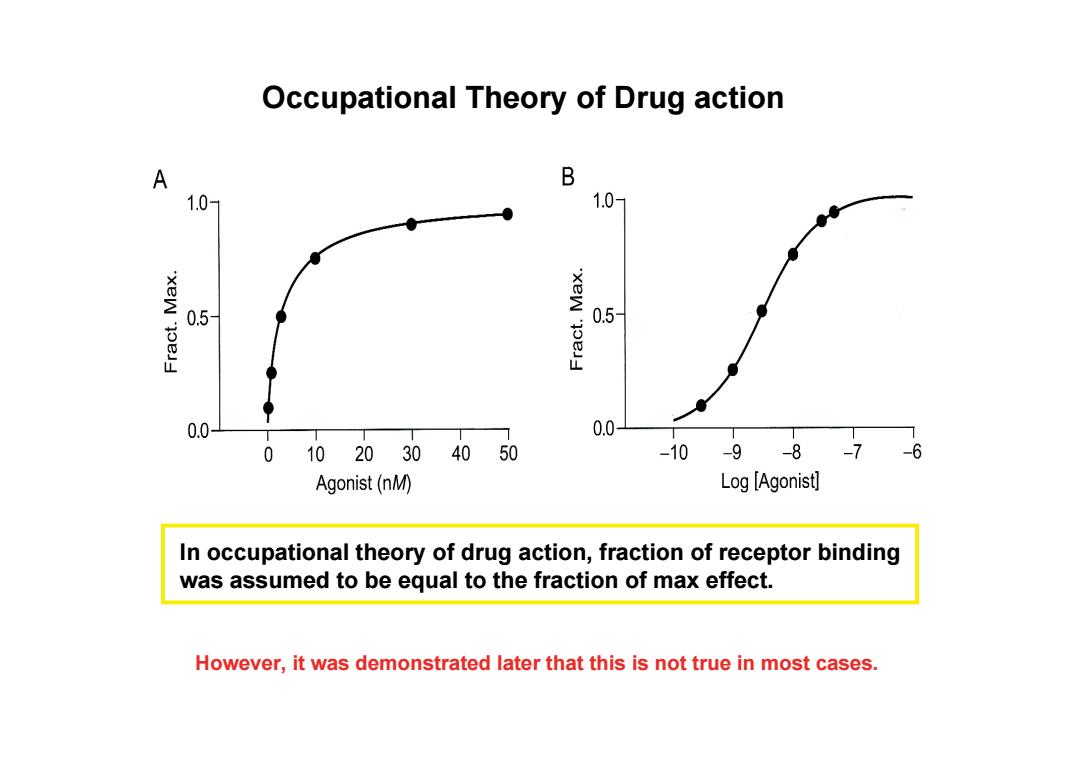
Occupational Theory of Drug action A B 1.0- 1.0- xeW 0.5- 0.5- 0.0- 0.0- 0 102030 40 50 -10 -9 -8-7 -6 Agonist(nM) Log [Agonist] In occupational theory of drug action,fraction of receptor binding was assumed to be equal to the fraction of max effect. However,it was demonstrated later that this is not true in most cases
Occupational Theory of Drug action In occupational theory of drug action, fraction of receptor binding was assumed to be equal to the fraction of max effect. However, it was demonstrated later that this is not true in most cases
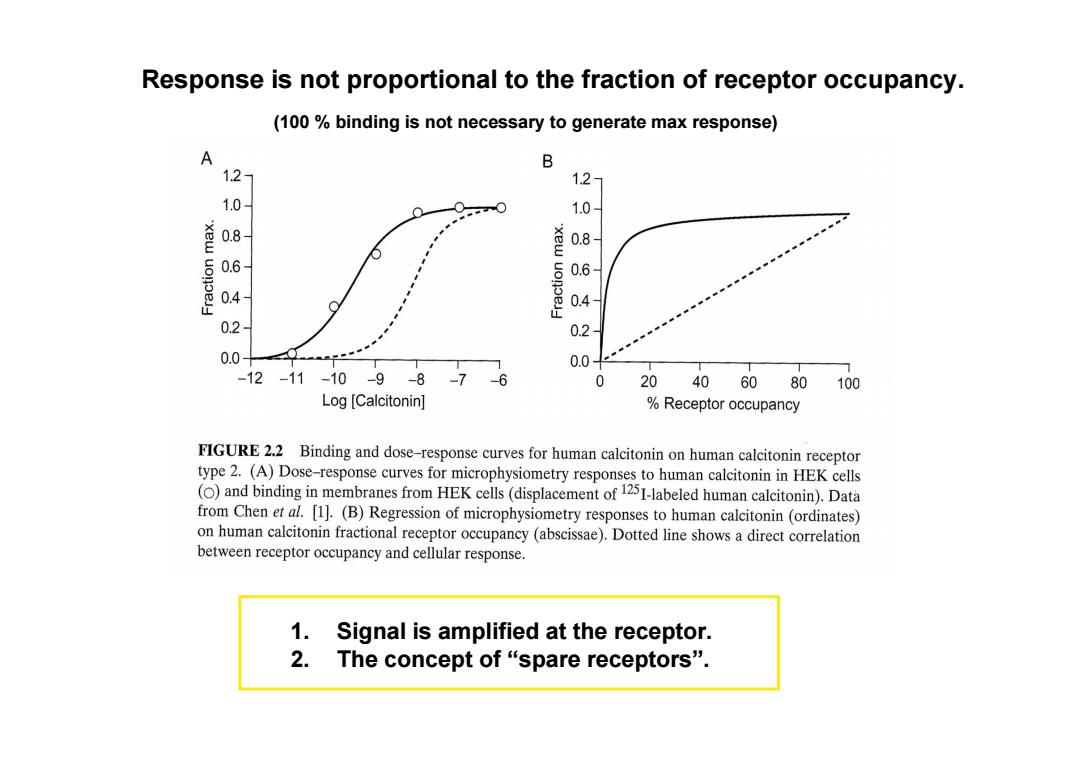
Response is not proportional to the fraction of receptor occupancy. (100%binding is not necessary to generate max response) A B 1.2- 1.2- 1.0- 1.0- 0.8- xew 0.8- 06 0.6- 0.4- 0.4 0.2- 0.2 0.0+ 0.0 -12-11-10-9 -8 -7 -6 20 40 60 80 100 Log [Calcitonin] Receptor occupancy FIGURE 2.2 Binding and dose-response curves for human calcitonin on human calcitonin receptor type 2.(A)Dose-response curves for microphysiometry responses to human calcitonin in HEK cells ()and binding in membranes from HEK cells(displacement of 125I-labeled human calcitonin).Data from Chen et al.[1].(B)Regression of microphysiometry responses to human calcitonin (ordinates) on human calcitonin fractional receptor occupancy (abscissae).Dotted line shows a direct correlation between receptor occupancy and cellular response. 1.Signal is amplified at the receptor. 2. The concept of“spare receptors
Response is not proportional to the fraction of receptor occupancy. 1. Signal is amplified at the receptor. 2. The concept of “spare receptors”. (100 % binding is not necessary to generate max response)
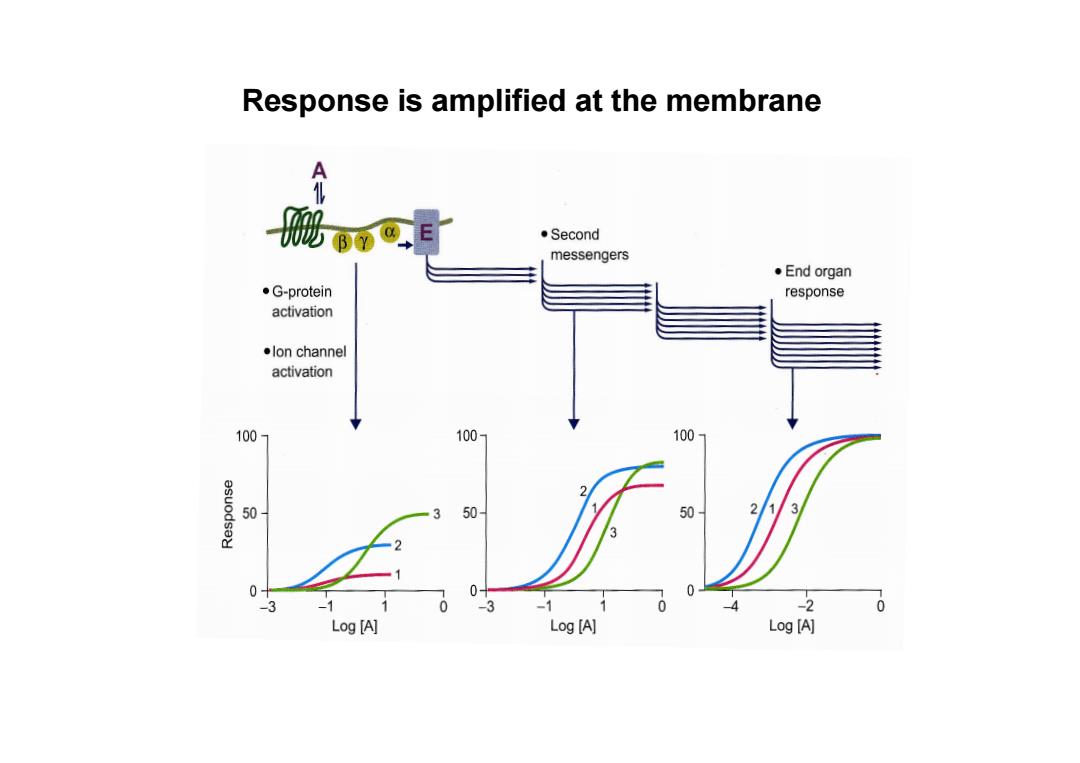
Response is amplified at the membrane d- ·Second messengers ◆End organ ●G-protein response activation ●lon channel activation 100- 100- 100 2 50 3 50- 50 2 2 0 0+ -1 1 0 -3 -1 0 -2 0 Log [A] Log [A] Log [A]
Response is amplified at the membrane
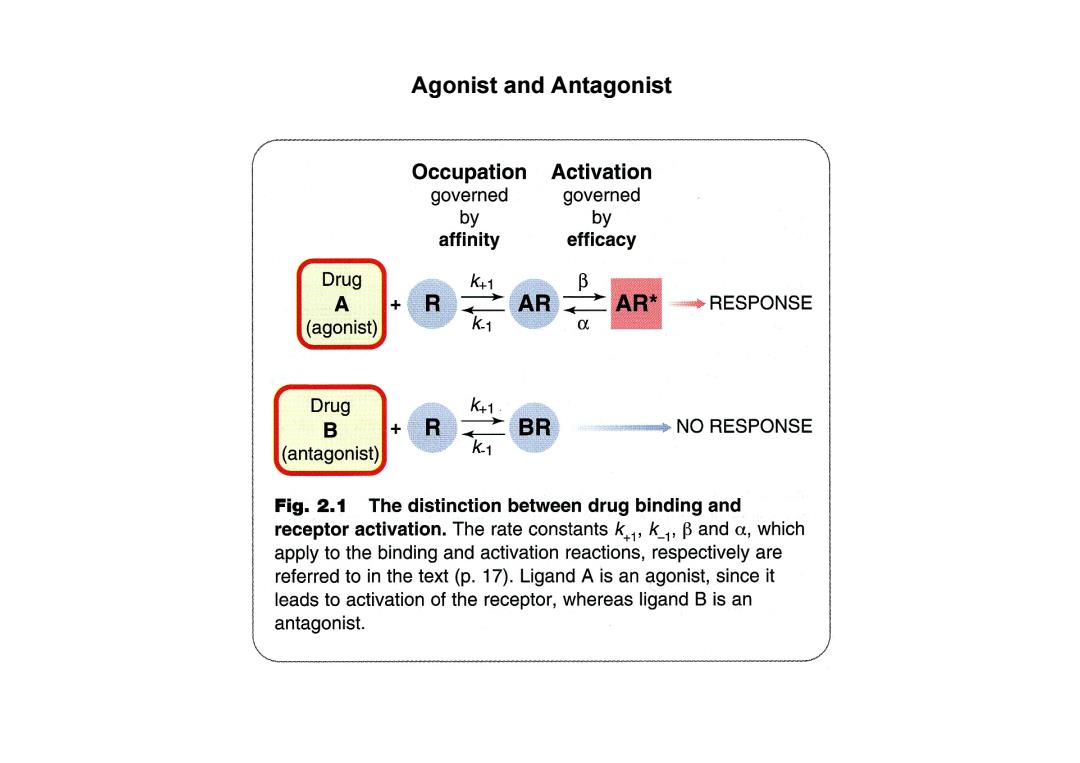
Agonist and Antagonist Occupation Activation governed governed by by affinity efficacy Dr K+1 B A AR AR* ◆RESPONSE (agonist) K1 Drug K+1 B BR ◆NO RESPONSE (antagonist) Fig.2.1 The distinction between drug binding and receptor activation.The rate constantsk,k,B and a,which apply to the binding and activation reactions,respectively are referred to in the text(p.17).Ligand A is an agonist,since it leads to activation of the receptor,whereas ligand B is an antagonist
Agonist and Antagonist