對酥竹贸易本孝 1951 Chapter 3 Managing Noninterest Income and Noninterest Expense
Chapter 3 Chapter 3 Managing Managing Noninterest Noninterest Income and Income and Noninterest Noninterest Expense Expense

Trend of Non-interest income A common view among bank managers and analysts is that banks must rely less on net interest income and more on noninterest income to be more successful. The highest earning banks will be those that generate an increasing share of operating revenue from noninterest sources. The fundamental issue among managers is to determine the appropriate customer mix and business mix to grow profits at high rates, with a strong focus on fee-based revenues. 麓行贺影≠考
Trend of Non Trend of Non-interest income interest income A common view among bank managers and analysts is that banks must rely less on net interest income and more on noninterest income to be more successful. The highest earning banks will be those that generate an increasing share of operating revenue from noninterest sources. The fundamental issue among managers is to determine the appropriate customer mix and business mix to grow profits at high rates, with a strong focus on fee-based revenues
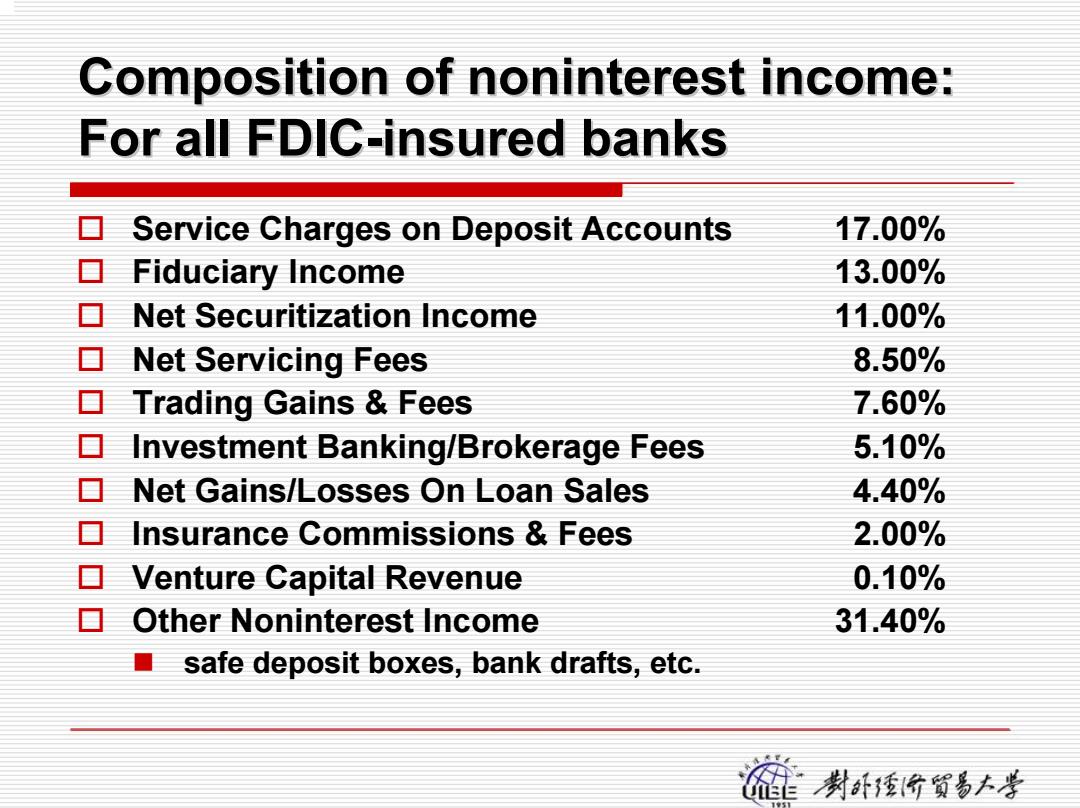
Composition of noninterest income: For all FDIC-insured banks Service Charges on Deposit Accounts 17.00% ▣Fiduciary Income 13.00% Net Securitization Income 11.00% ▣Net Servicing Fees 8.50% ▣Trading Gains&Fees 7.60% Investment Banking/Brokerage Fees 5.10% Net Gains/Losses On Loan Sales 4.40% Insurance Commissions Fees 2.00% Venture Capital Revenue 0.10% Other Noninterest Income 31.40% safe deposit boxes,bank drafts,etc. 碰喇酥价贸易大孝
Composition of Composition of noninterest noninterest income: income: For all FDIC For all FDIC -insured banks insured banks Service Charges on Deposit Accounts 17.00% Fiduciary Income 13.00% Net Securitization Income 11.00% Net Servicing Fees 8.50% Trading Gains & Fees 7.60% Investment Banking/Brokerage Fees 5.10% Net Gains/Losses On Loan Sales 4.40% Insurance Commissions & Fees 2.00% Venture Capital Revenue 0.10% Other Noninterest Income 31.40% safe deposit boxes, bank drafts, etc
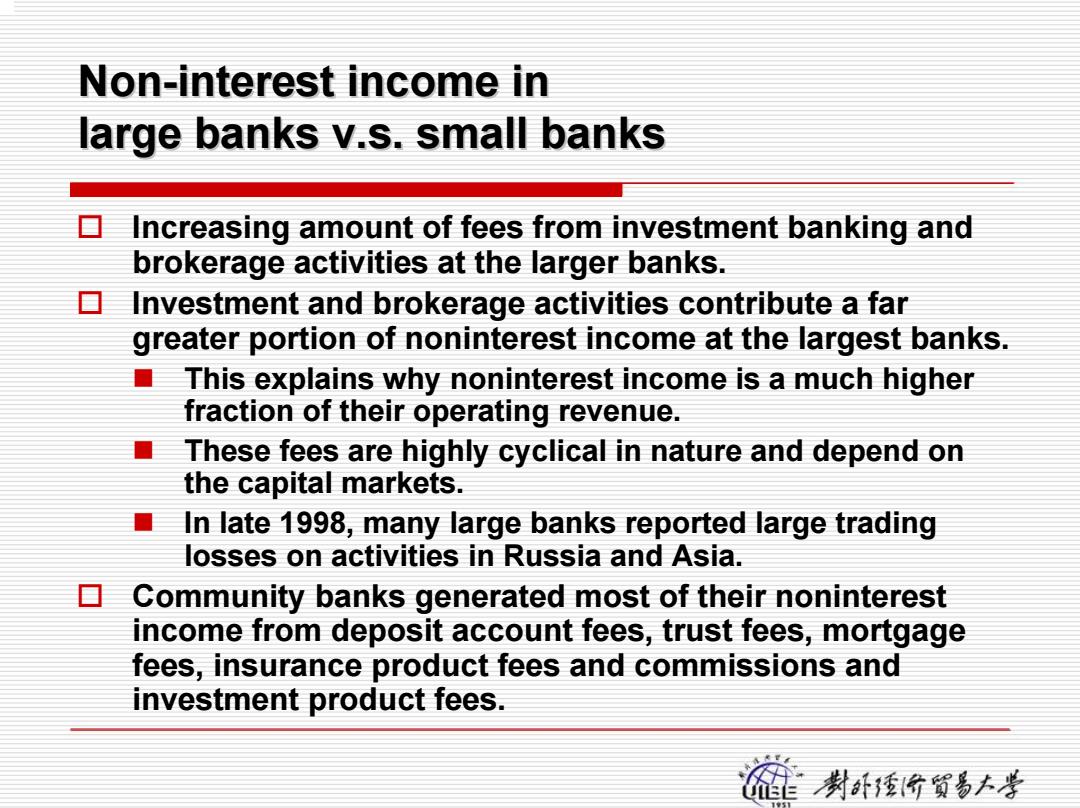
Non-interest income in large banks v.s.small banks Increasing amount of fees from investment banking and brokerage activities at the larger banks. Investment and brokerage activities contribute a far greater portion of noninterest income at the largest banks. ■ This explains why noninterest income is a much higher fraction of their operating revenue. These fees are highly cyclical in nature and depend on the capital markets. In late 1998,many large banks reported large trading losses on activities in Russia and Asia. Community banks generated most of their noninterest income from deposit account fees,trust fees,mortgage fees,insurance product fees and commissions and investment product fees. 制酥价贸号大孝
Non-interest income in interest income in large banks v.s. small banks large banks v.s. small banks Increasing amount of fees from investment banking and brokerage activities at the larger banks. Investment and brokerage activities contribute a far greater portion of noninterest income at the largest banks. This explains why noninterest income is a much higher fraction of their operating revenue. These fees are highly cyclical in nature and depend on the capital markets. In late 1998, many large banks reported large trading losses on activities in Russia and Asia. Community banks generated most of their noninterest income from deposit account fees, trust fees, mortgage fees, insurance product fees and commissions and investment product fees
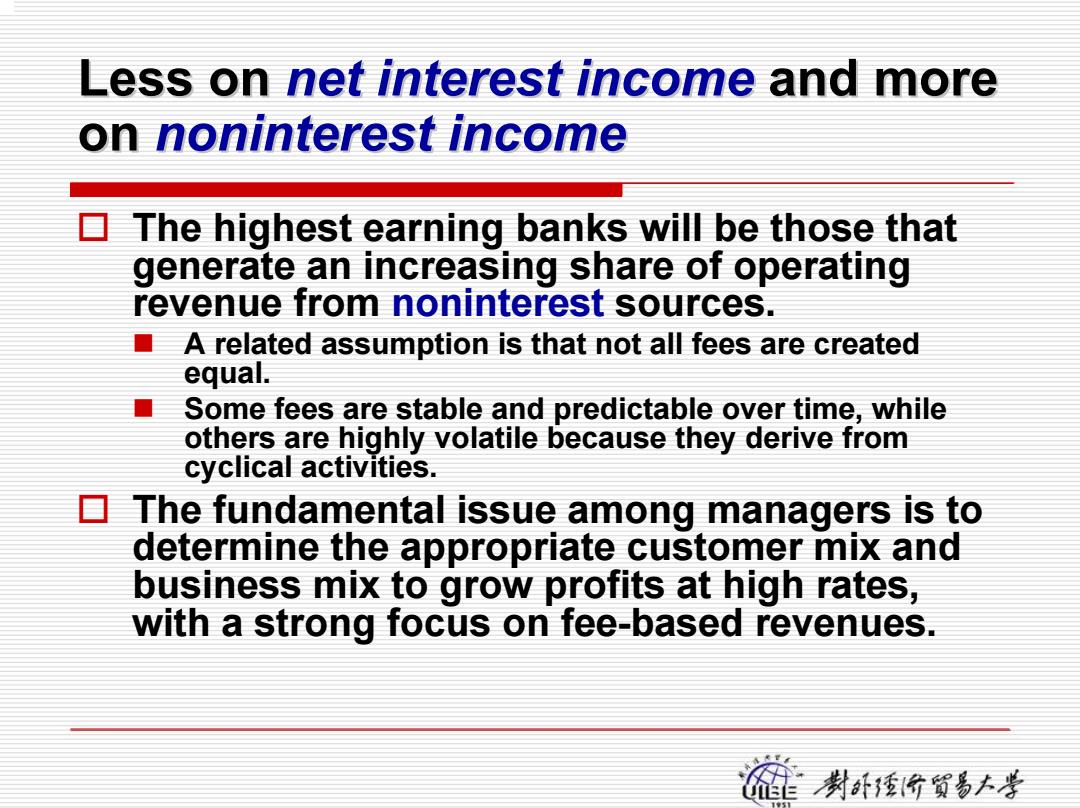
Less on net interest income and more on noninterest income 目 The highest earning banks will be those that generate an increasing share of operating revenue from noninterest sources. A related assumption is that not all fees are created equal. Some fees are stable and predictable over time,while others are highly volatile because they derive from cyclical activities. 目 The fundamental issue among managers is to determine the appropriate customer mix and business mix to grow profits at high rates, with a strong focus on fee-based revenues. 碰封酥价贸易大孝
Less on Less on net interest income net interest income and more and more on noninterest noninterest income The highest earning banks will be those that generate an increasing share of operating revenue from noninterest sources. A related assumption is that not all fees are created equal. Some fees are stable and predictable over time, while others are highly volatile because they derive from cyclical activities. The fundamental issue among managers is to determine the appropriate customer mix and business mix to grow profits at high rates, with a strong focus on fee-based revenues
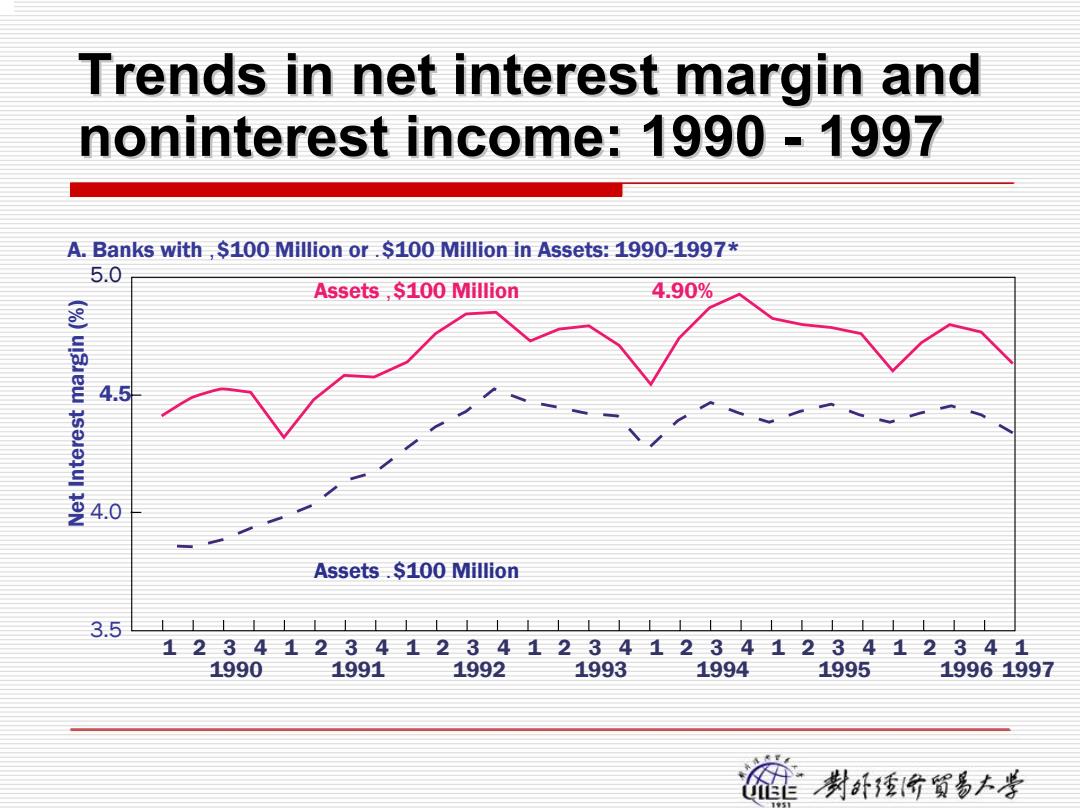
Trends in net interest margin and noninterest income:1990 -1997 A.Banks with,$100 Million or.$100 Million in Assets:1990-1997* 5.0 Assets,$100 Million 4.90% 4.5 4.0 Assets.$100 Million 3.5 ⊥1111上⊥1上11⊥1 12341234123412341234123412341 1990 1991 1992 1993 1994 1995 19961997 猫行贺影小号
Trends in net interest margin and Trends in net interest margin and noninterest noninterest income: 1990 income: 1990 - 1997 1 3.5 4.0 4.5 5.0 1990 1991 1992 1993 1994 1995 1996 1997 Assets ,$100 Million Assets .$100 Million 4.90% Net Interest margin (%) A. Banks with ,$100 Million or .$100 Million in Assets: 1990-1997* 234123412341234 1234123412341
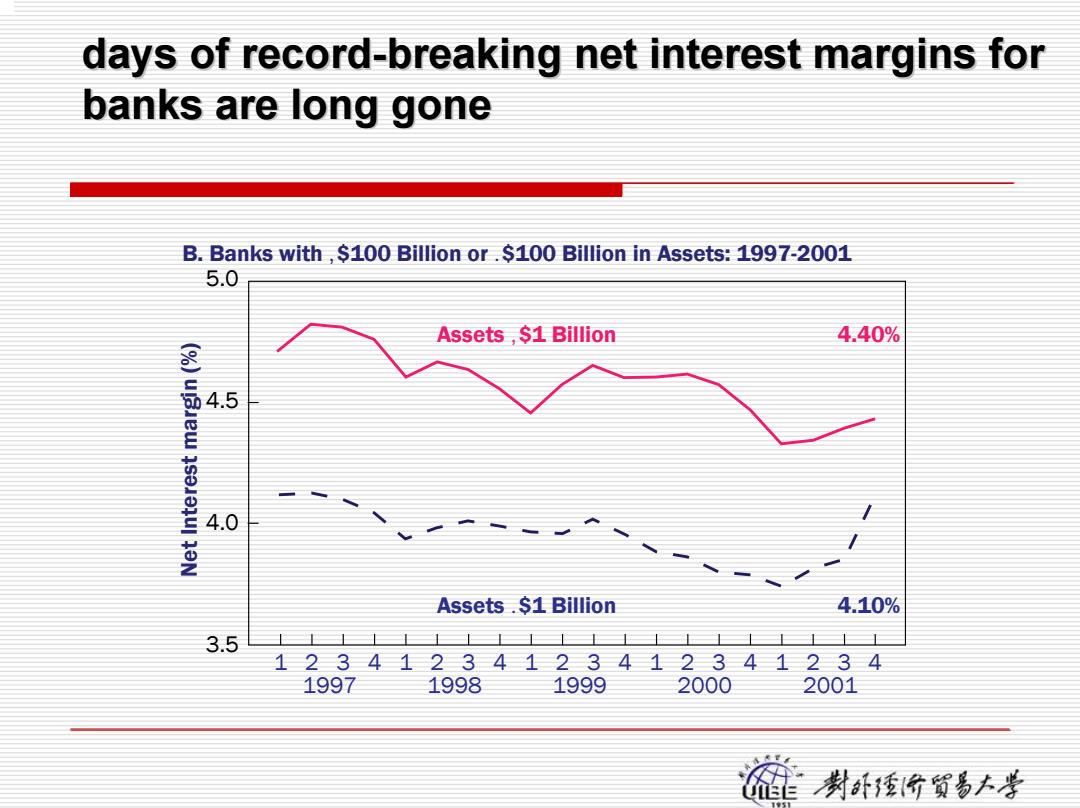
days of record-breaking net interest margins for banks are long gone B.Banks with,$100 Billion or.$100 Billion in Assets:1997-2001 5.0 Assets $1 Billion 4.40% 4.5 4.0 Assets.$1 Billion 4.10% 3.5 12341234123412341234 1997 1998 1999 2000 2001 麓竹贺影小号
days of record days of record-breaking net interest margins for breaking net interest margins for banks are long gone banks are long gone 1 3.5 4.0 4.5 5.0 1997 1998 1999 2000 2001 Assets ,$1 Billion Assets .$1 Billion 4.40% 4.10% Net Interest margin (%) B. Banks with ,$100 Billion or .$100 Billion in Assets: 1997-2001 234123412341234 123 4
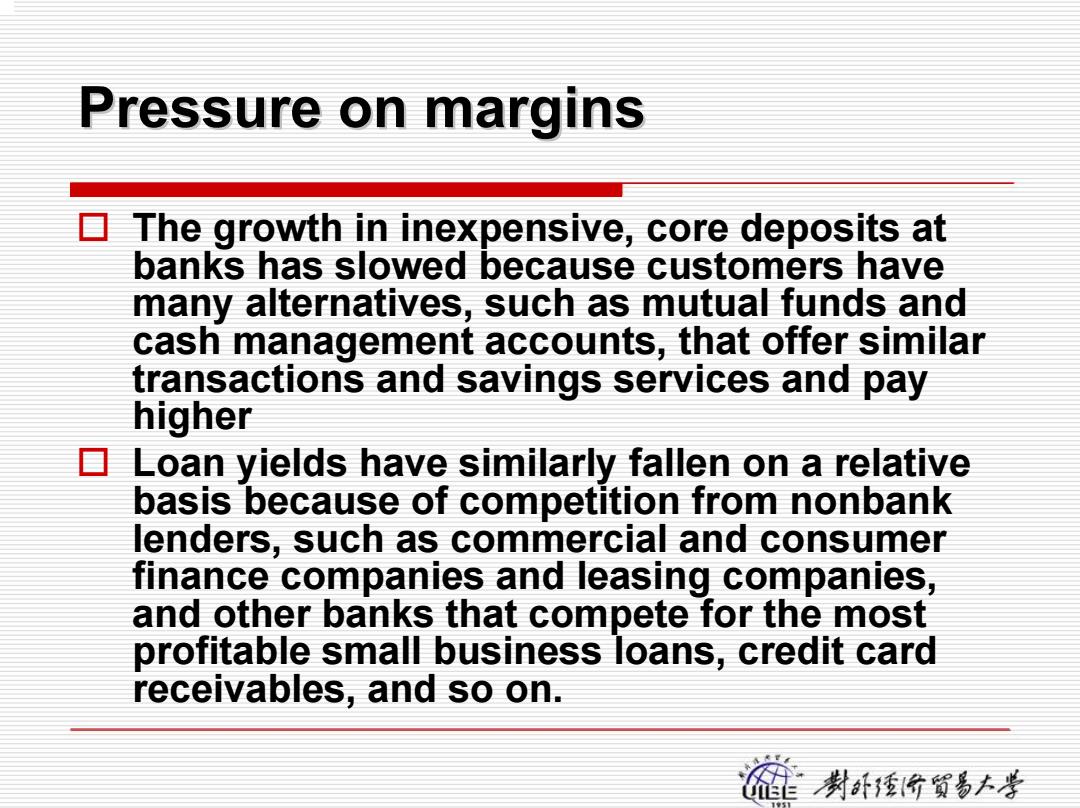
Pressure on margins 目 The growth in inexpensive,core deposits at banks has slowed because customers have many alternatives,such as mutual funds and cash management accounts,that offer similar transactions and savings services and pay higher Loan yields have similarly fallen on a relative basis because of competition from nonbank lenders,such as commercial and consumer finance companies and leasing companies, and other banks that compete for the most profitable small business loans,credit card receivables,and so on. 的资5土号
Pressure on margins Pressure on margins The growth in inexpensive, core deposits at banks has slowed because customers have many alternatives, such as mutual funds and cash management accounts, that offer similar transactions and savings services and pay higher Loan yields have similarly fallen on a relative basis because of competition from nonbank lenders, such as commercial and consumer finance companies and leasing companies, and other banks that compete for the most profitable small business loans, credit card receivables, and so on
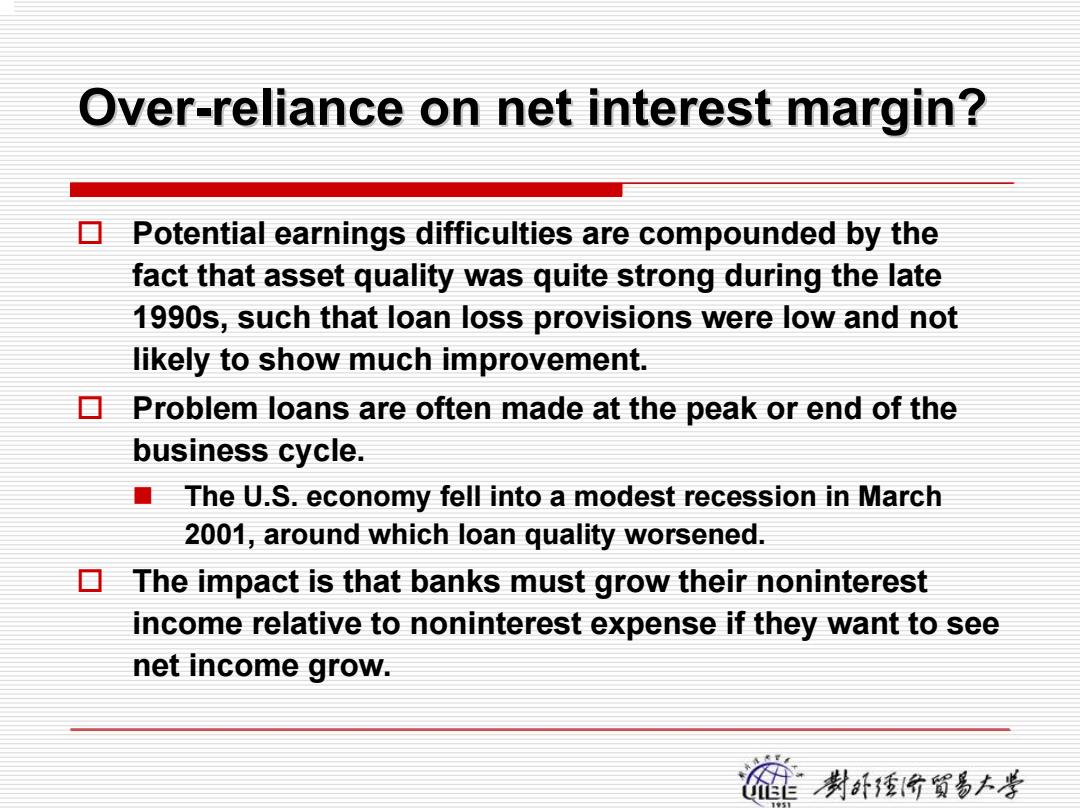
Over-reliance on net interest margin? Potential earnings difficulties are compounded by the fact that asset quality was quite strong during the late 1990s,such that loan loss provisions were low and not likely to show much improvement. Problem loans are often made at the peak or end of the business cycle. ■ The U.S.economy fell into a modest recession in March 2001,around which loan quality worsened. The impact is that banks must grow their noninterest income relative to noninterest expense if they want to see net income grow. 爸封强的黄香+孝
Over-reliance on net interest margin? reliance on net interest margin? Potential earnings difficulties are compounded by the fact that asset quality was quite strong during the late 1990s, such that loan loss provisions were low and not likely to show much improvement. Problem loans are often made at the peak or end of the business cycle. The U.S. economy fell into a modest recession in March 2001, around which loan quality worsened. The impact is that banks must grow their noninterest income relative to noninterest expense if they want to see net income grow
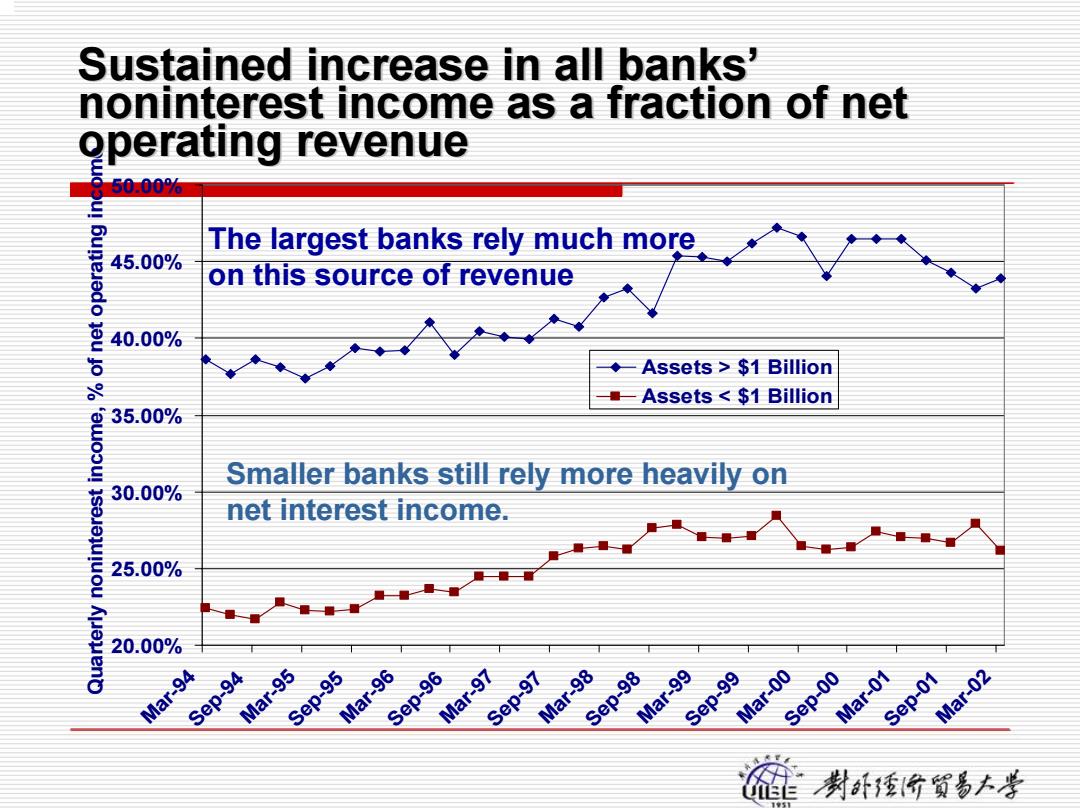
Sustained increase in all banks' noninterest income as a fraction of net operating revenue 50.00% 50% The largest banks rely much more on this source of revenue 40.0% ◆-Assets>$1 Billion 8 一 Assets $1 Billion 350 Smaller banks still rely more heavily on 30.00% net interest income. 25.00% 20.00% Mar-94 Sep-94 Mar-95 Sep-95 Mar-96 Sep-96 Mar-97 Sep-97 Mar-98 Sep-98 Mar-99 Sep-99 Mar-00 Sep-00 Mar-01 Sep-01 Mar-02
20.00% 25.00% 30.00% 35.00% 40.00% 45.00% 50.00% Mar-94 Sep-94 Mar-95 Sep-95 Mar-96 Sep-96 Mar-97 Sep-97 Mar-98 Sep-98 Mar-99 Sep-99 Mar-00 Sep-00 Mar-01 Sep-01 Mar Q -02 uarterly noninterest income, % of net operating income Assets > $1 Billion Assets < $1 Billion Sustained increase in all banks Sustained increase in all banks’ noninterest noninterest income as a fraction of net income as a fraction of net operating revenue operating revenue The largest banks rely much more on this source of revenu e Smaller banks still rely more heavily on net interest income