ARMY RESEARCH LABORATORY 凡 Binomial Distribution:Hypothesis Testing,Confidence Intervals (CI,and Reliability with Implementation in S-PLUS by Joseph C.Collins ARL-TR-5214 June 2010 Approved for public release;distribution unlimited
Binomial Distribution: Hypothesis Testing, Confidence Intervals (CI), and Reliability with Implementation in S-PLUS by Joseph C. Collins ARL-TR-5214 June 2010 Approved for public release; distribution unlimited

NOTICES Disclaimers The findings in this report are not to be construed as an official Department of the Army position unless so designated by other authorized documents. Citation of manufacturer's or trade names does not constitute an official endorsement or approval of the use thereof. Destroy this report when it is no longer needed.Do not return it to the originator
NOTICES Disclaimers The findings in this report are not to be construed as an official Department of the Army position unless so designated by other authorized documents. Citation of manufacturer’s or trade names does not constitute an official endorsement or approval of the use thereof. Destroy this report when it is no longer needed. Do not return it to the originator
Army Research Laboratory Aberdeen Proving Ground,MD 21005 ARL-TR-5214 June 2010 Binomial Distribution:Hypothesis Testing,Confidence Intervals(CD,and Reliability with Implementation in S-PLUS Joseph C.Collins Survivability/Lethality Analysis Directorate,ARL Approved for public release;distribution unlimited
Army Research Laboratory Aberdeen Proving Ground, MD 21005 ARL-TR-5214 June 2010 Binomial Distribution: Hypothesis Testing, Confidence Intervals (CI), and Reliability with Implementation in S-PLUS Joseph C. Collins Survivability/Lethality Analysis Directorate, ARL Approved for public release; distribution unlimited
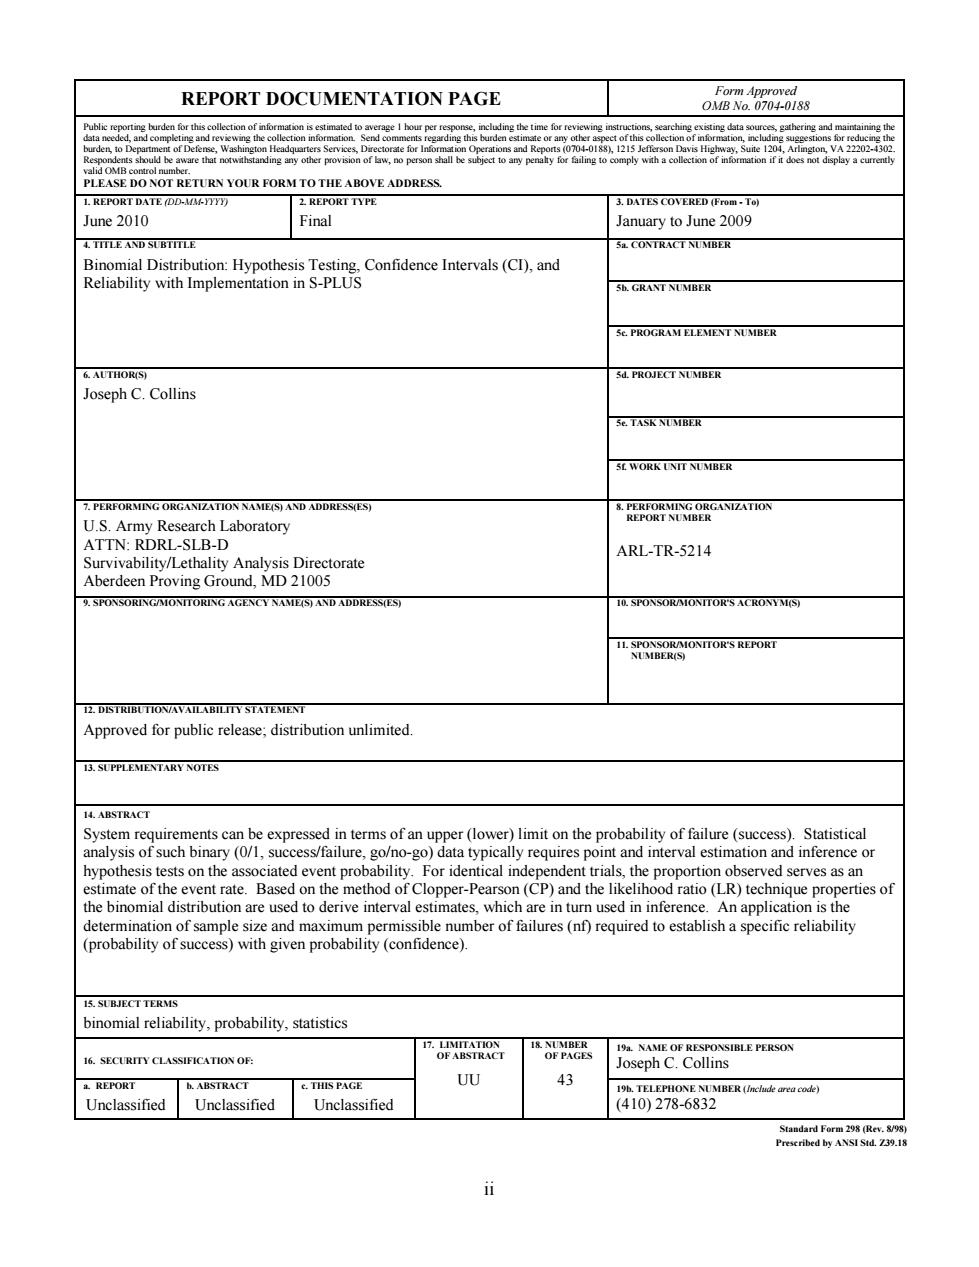
REPORT DOCUMENTATION PAGE Form Approved OMB No..0704-0188 Public reporting burden for this collection of information is estimated to average I hour per response,including the time for reviewing instructions,searching existing data sources,gathering and maintaining the data needed,and completing and reviewing the collection information.Send comments regarding this burden estimate or any other aspect of this collection of information,including suggestions for reducing the burden,to Department of Defense,Washington Headquarters Services,Directorate for Information Operations and Reports (0704-0188),1215 Jefferson Davis Highway,Suite 1204,Arlington,VA 22202-4302. Respondents should be aware that notwithstanding any other provision of law,no person shall be subject to any penaly for failing to comply with a collection of information if it does not display a currently valid OMB control number. PLEASE DO NOT RETURN YOUR FORM TO THE ABOVE ADDRESS. 1.REPORT DATE (DD-MM-YYYY) 2.REPORT TYPE 3.DATES COVERED (From-To) June 2010 Final January to June 2009 4.TITLE AND SUBTITLE 5 CONTRACT NUMBER Binomial Distribution:Hypothesis Testing,Confidence Intervals(CI),and Reliability with Implementation in S-PLUS 5b.GRANT NUMBER 5e.PROGRAM ELEMENT NUMBER 6.AUTHOR(S) 5d.PROJECT NUMBER Joseph C.Collins 5e.TASK NUMBER SE WORK UNIT NUMBER 7.PERFORMING ORGANIZATION NAME(S)AND ADDRESS(ES) 8.PERFORMING ORGANIZATION U.S.Army Research Laboratory REPORT NUMBER ATTN:RDRL-SLB-D ARL-TR-5214 Survivability/Lethality Analysis Directorate Aberdeen Proving Ground,MD 21005 9.SPONSORING/MONITORING AGENCY NAME(S)AND ADDRESS(ES) 10.SPONSOR/MONITOR'S ACRONYM(S) 11.SPONSOR/MONITOR'S REPORT NUMBER(S) 12.DISTRIBUTION/AVAILABILITY STATEMENT Approved for public release;distribution unlimited. 13.SUPPLEMENTARY NOTES 14.ABSTRACT System requirements can be expressed in terms of an upper(lower)limit on the probability of failure(success).Statistical analysis of such binary(0/1,success/failure,go/no-go)data typically requires point and interval estimation and inference or hypothesis tests on the associated event probability.For identical independent trials,the proportion observed serves as an estimate of the event rate.Based on the method of Clopper-Pearson(CP)and the likelihood ratio(LR)technique properties of the binomial distribution are used to derive interval estimates,which are in turn used in inference.An application is the determination of sample size and maximum permissible number of failures(nf)required to establish a specific reliability (probability of success)with given probability (confidence). 15.SUBJECT TERMS binomial reliability,probability,statistics 17.LIMITATION 18 NUMBER 19a.NAME OF RESPONSIBLE PERSON 16.SECURITY CLASSIFICATION OF: OF ABSTRACT OF PAGES Joseph C.Collins a.REPORT b.ABSTRACT e.THIS PAGE UU 43 19b.TELEPHONE NUMBER (Include area code) Unclassified Unclassified Unclassified (410)278-6832 Standard Form 298(Rev.8/98) Prescribed by ANSI Std.Z39.18 i
ii REPORT DOCUMENTATION PAGE Form Approved OMB No. 0704-0188 Public reporting burden for this collection of information is estimated to average 1 hour per response, including the time for reviewing instructions, searching existing data sources, gathering and maintaining the data needed, and completing and reviewing the collection information. Send comments regarding this burden estimate or any other aspect of this collection of information, including suggestions for reducing the burden, to Department of Defense, Washington Headquarters Services, Directorate for Information Operations and Reports (0704-0188), 1215 Jefferson Davis Highway, Suite 1204, Arlington, VA 22202-4302. Respondents should be aware that notwithstanding any other provision of law, no person shall be subject to any penalty for failing to comply with a collection of information if it does not display a currently valid OMB control number. PLEASE DO NOT RETURN YOUR FORM TO THE ABOVE ADDRESS. 1. REPORT DATE (DD-MM-YYYY) June 2010 2. REPORT TYPE Final 3. DATES COVERED (From - To) January to June 2009 4. TITLE AND SUBTITLE Binomial Distribution: Hypothesis Testing, Confidence Intervals (CI), and Reliability with Implementation in S-PLUS 5a. CONTRACT NUMBER 5b. GRANT NUMBER 5c. PROGRAM ELEMENT NUMBER 6. AUTHOR(S) Joseph C. Collins 5d. PROJECT NUMBER 5e. TASK NUMBER 5f. WORK UNIT NUMBER 7. PERFORMING ORGANIZATION NAME(S) AND ADDRESS(ES) U.S. Army Research Laboratory ATTN: RDRL-SLB-D Survivability/Lethality Analysis Directorate Aberdeen Proving Ground, MD 21005 8. PERFORMING ORGANIZATION REPORT NUMBER ARL-TR-5214 9. SPONSORING/MONITORING AGENCY NAME(S) AND ADDRESS(ES) 10. SPONSOR/MONITOR'S ACRONYM(S) 11. SPONSOR/MONITOR'S REPORT NUMBER(S) 12. DISTRIBUTION/AVAILABILITY STATEMENT Approved for public release; distribution unlimited. 13. SUPPLEMENTARY NOTES 14. ABSTRACT System requirements can be expressed in terms of an upper (lower) limit on the probability of failure (success). Statistical analysis of such binary (0/1, success/failure, go/no-go) data typically requires point and interval estimation and inference or hypothesis tests on the associated event probability. For identical independent trials, the proportion observed serves as an estimate of the event rate. Based on the method of Clopper-Pearson (CP) and the likelihood ratio (LR) technique properties of the binomial distribution are used to derive interval estimates, which are in turn used in inference. An application is the determination of sample size and maximum permissible number of failures (nf) required to establish a specific reliability (probability of success) with given probability (confidence). 15. SUBJECT TERMS binomial reliability, probability, statistics 16. SECURITY CLASSIFICATION OF: 17. LIMITATION OF ABSTRACT UU 18. NUMBER OF PAGES 43 19a. NAME OF RESPONSIBLE PERSON Joseph C. Collins a. REPORT Unclassified b. ABSTRACT Unclassified c. THIS PAGE Unclassified 19b. TELEPHONE NUMBER (Include area code) (410) 278-6832 Standard Form 298 (Rev. 8/98) Prescribed by ANSI Std. Z39.18
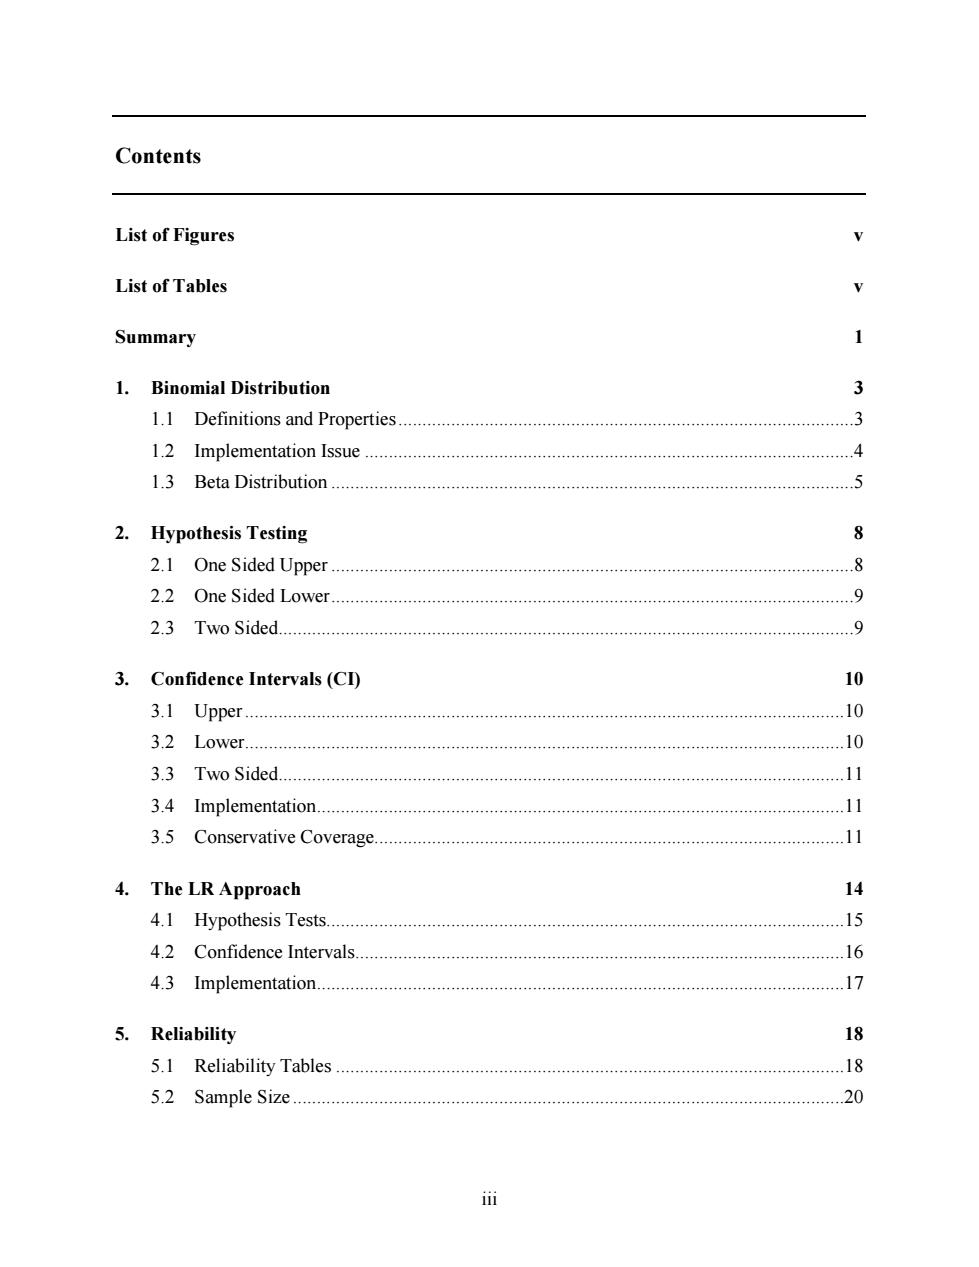
Contents List of Figures List of Tables Summary 1.Binomial Distribution 3 1.1 Definitions and Properties................. .3 1.2 Implementation Issue.............. 4 1.3 Beta Distribution............. 5 2.Hypothesis Testing 8 2.1 One Sided Upper............. .8 2.2 One Sided Lower.......... 2.3 Two Sided..... …9 3.Confidence Intervals(CI) 10 3.1 Upper.… 10 3.2 Lower.... 10 3.3 Two Sided. 11 3.4 Implementation.… 11 3.5 Conservative Coverage 11 4.The LR Approach 14 4.1 Hypothesis Tests....... 15 4.2 Confidence Intervals... 16 4.3 Implementation.… 17 5.Reliability 18 5.1 Reliability Tables............... .18 5.2 Sample Size.......... .20 iii
iii Contents List of Figures v List of Tables v Summary 1 1. Binomial Distribution 3 1.1 Definitions and Properties ...............................................................................................3 1.2 Implementation Issue ......................................................................................................4 1.3 Beta Distribution .............................................................................................................5 2. Hypothesis Testing 8 2.1 One Sided Upper .............................................................................................................8 2.2 One Sided Lower .............................................................................................................9 2.3 Two Sided........................................................................................................................9 3. Confidence Intervals (CI) 10 3.1 Upper .............................................................................................................................10 3.2 Lower.............................................................................................................................10 3.3 Two Sided......................................................................................................................11 3.4 Implementation ..............................................................................................................11 3.5 Conservative Coverage..................................................................................................11 4. The LR Approach 14 4.1 Hypothesis Tests............................................................................................................15 4.2 Confidence Intervals......................................................................................................16 4.3 Implementation ..............................................................................................................17 5. Reliability 18 5.1 Reliability Tables ..........................................................................................................18 5.2 Sample Size ...................................................................................................................20
6.References 22 Appendix A.S-PLUS Code 23 A.1 Library Functions. 23 A.2 Upper-Tail Binomial Probabilities 23 A.3 Binomial Parameter Confidence Interval:CP 24 A.4 Binomial Reliability Table. 24 A.5 Binomial Reliability Sample Size 24 A.6 Binomial LR............ 25 A.7 Binomial LR cdf Table 25 A.8 Binomial LR cdf Evaluation....... 26 A.9 Binomial LR Hypothesis Test 26 A.10 Binomial Parameter Confidence Interval:LR 26 Appendix B.Reliability Table 29 List of Symbols,Abbreviations,and Acronyms 34 Distribution List 35 iv
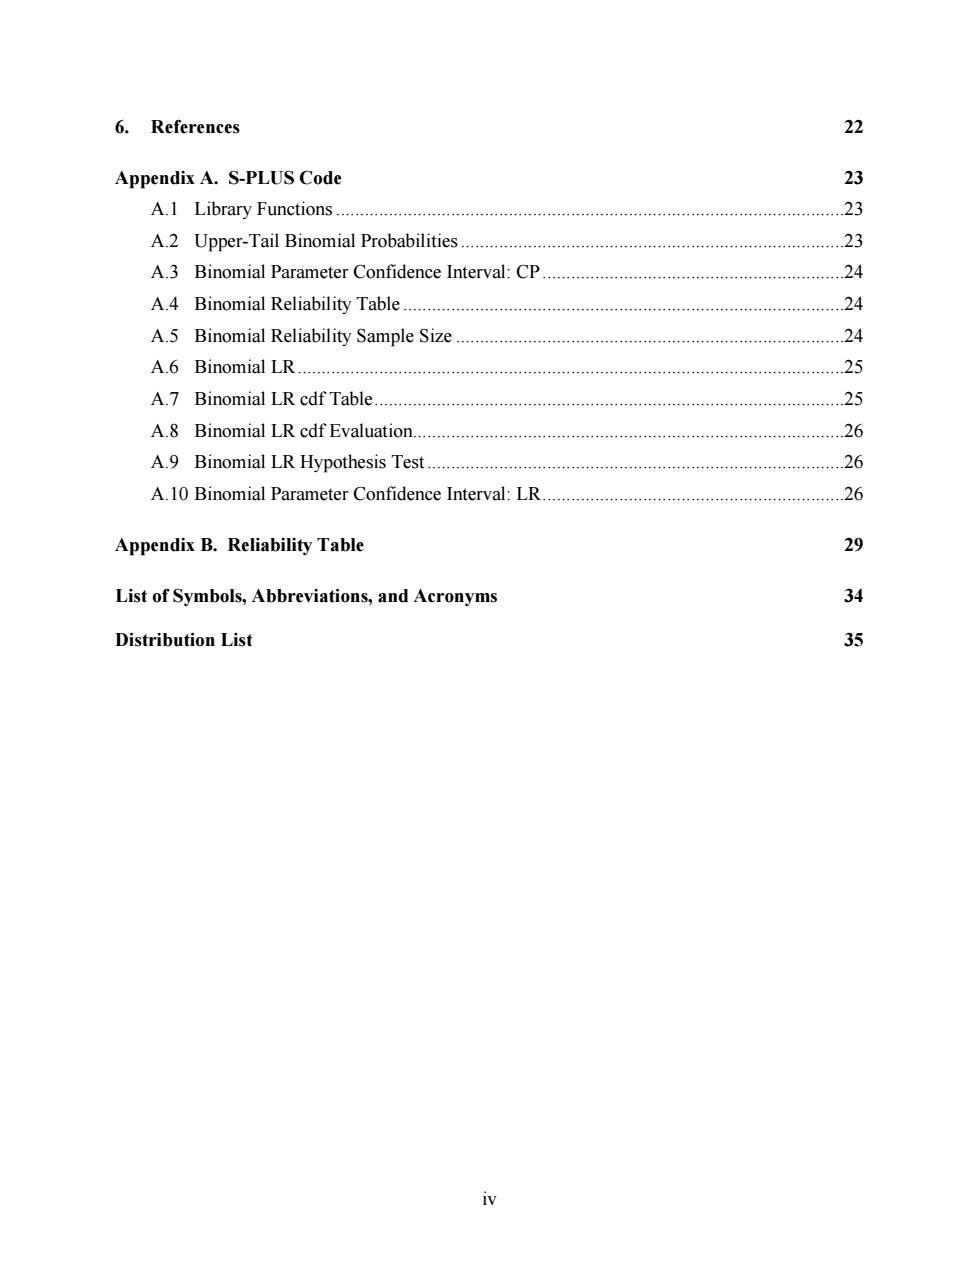
iv 6. References 22 Appendix A. S-PLUS Code 23 A.1 Library Functions ..........................................................................................................23 A.2 Upper-Tail Binomial Probabilities ................................................................................23 A.3 Binomial Parameter Confidence Interval: CP ...............................................................24 A.4 Binomial Reliability Table ............................................................................................24 A.5 Binomial Reliability Sample Size .................................................................................24 A.6 Binomial LR ..................................................................................................................25 A.7 Binomial LR cdf Table ..................................................................................................25 A.8 Binomial LR cdf Evaluation..........................................................................................26 A.9 Binomial LR Hypothesis Test .......................................................................................26 A.10 Binomial Parameter Confidence Interval: LR ...............................................................26 Appendix B. Reliability Table 29 List of Symbols, Abbreviations, and Acronyms 34 Distribution List 35
List of Figures Figure 1.Binomial cdf and quantile function(qf)examples with continuous interpolation.........7 Figure 2.Upper CI coverage.. 12 Figure 3.Lower CI coverage. .13 Figure 4.Two-sided cp CI coverage.. .14 Figure 5.Two-sided LR CI coverage. 17 Figure 6.Two-sided CI coverage comparison............... 17 List of Tables Table 1.LR cdf. 16 Table2.CP cdf.… …16
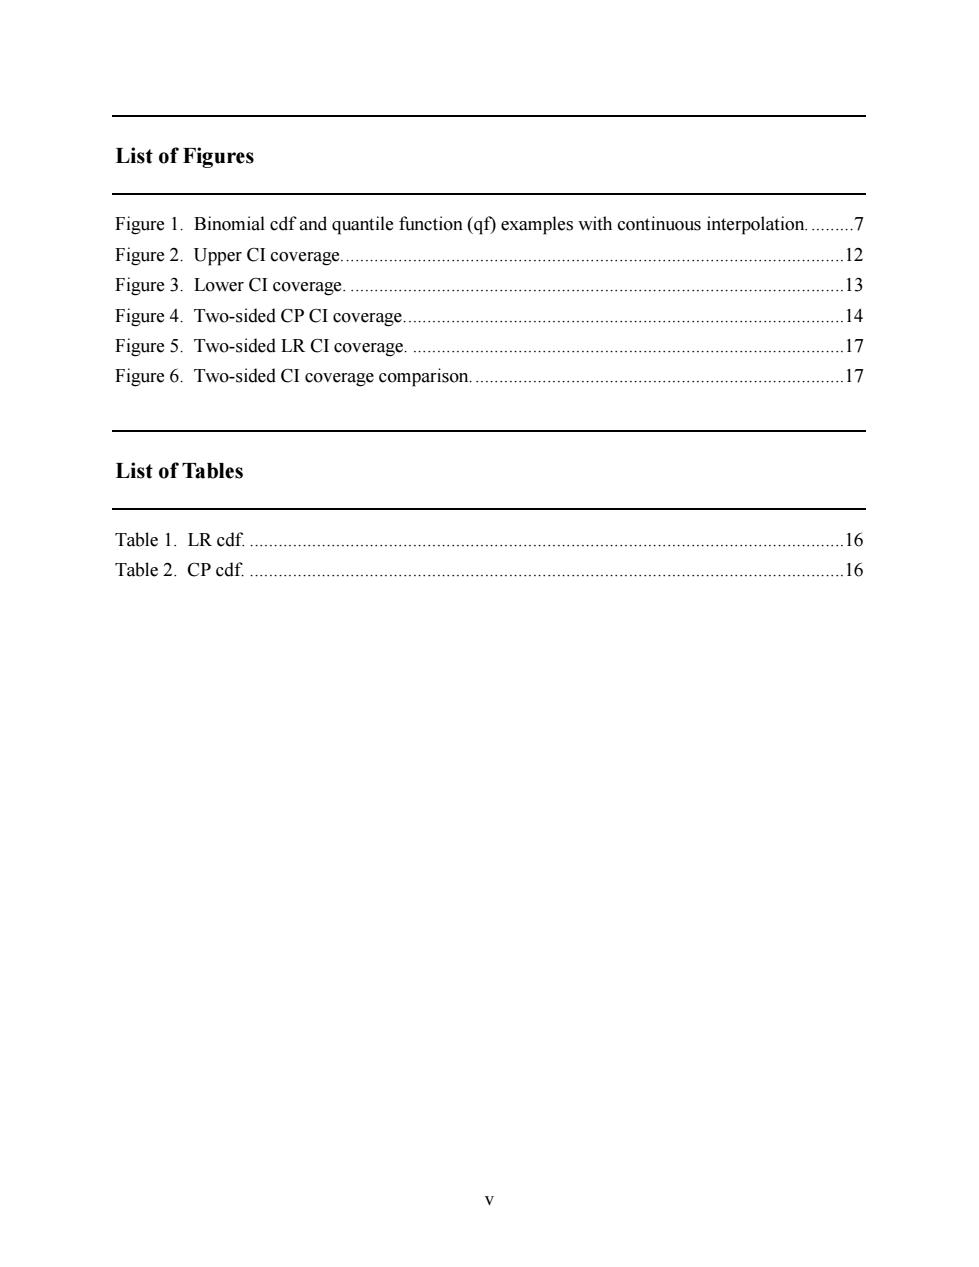
v List of Figures Figure 1. Binomial cdf and quantile function (qf) examples with continuous interpolation. .........7 Figure 2. Upper CI coverage. ........................................................................................................12 Figure 3. Lower CI coverage. .......................................................................................................13 Figure 4. Two-sided CP CI coverage. ...........................................................................................14 Figure 5. Two-sided LR CI coverage. ..........................................................................................17 Figure 6. Two-sided CI coverage comparison. .............................................................................17 List of Tables Table 1. LR cdf. ............................................................................................................................16 Table 2. CP cdf. ............................................................................................................................16

INTENTIONALLY LEFT BLANK. 与
vi INTENTIONALLY LEFT BLANK
Summary The purpose of this report is to provide statisticians with the tools to solve certain reliability problems that arise in consultations with clients. Statisticians often encounter clients seeking answers to questions such as,"I did an experiment 6 times with 3 successes and 3 failures,so the success rate is 50%,right?"A reasonable,useful, and informative response from the statistician would be,"yes,the estimate of success is 50%,but you can only state with 90%confidence that the true success rate lies between 15%and 85%.If you want to tighten that up,you need a larger sample."The client asks,"how large?"and the conversation proceeds from there. A client may pose a problem such as,"I need 90%confidence on 95%reliability.Can I do this with 10 runs?"The statistician can truthfully answer,no.You need 29 with no failures or 46 with 1 failure to assert 95%reliability with 90%confidence."The client may respond,"well, what can I get with I failure in 20?"and so the consultation continues. In fact,the solutions to both of these problems exploit properties of the binomial distribution. System requirements can be expressed in terms of an upper(lower)limit on the probability of failure(success).Statistical analysis of such binary (0/1,success/failure,go/no-go)data typically requires point and interval estimation and inference or hypothesis tests on the associated event probability.For identical independent trials,the proportion observed serves as an estimate of the event rate.Based on the method of Clopper-Pearson(CP)and the likelihood ratio(LR)technique properties of the binomial distribution are used to derive interval estimates, which are in turn used in inference.An application is the determination of sample size and maximum permissible number of failures(nf)required to establish a specific reliability (probability of success)with given probability(confidence). The statistician needs to address such issues and answer these questions in real time.This report provides the necessary technology expressed in the S-PLUS/S/R statistical computing environment language family,implementations of which are available as both commercial and free open-source software 1
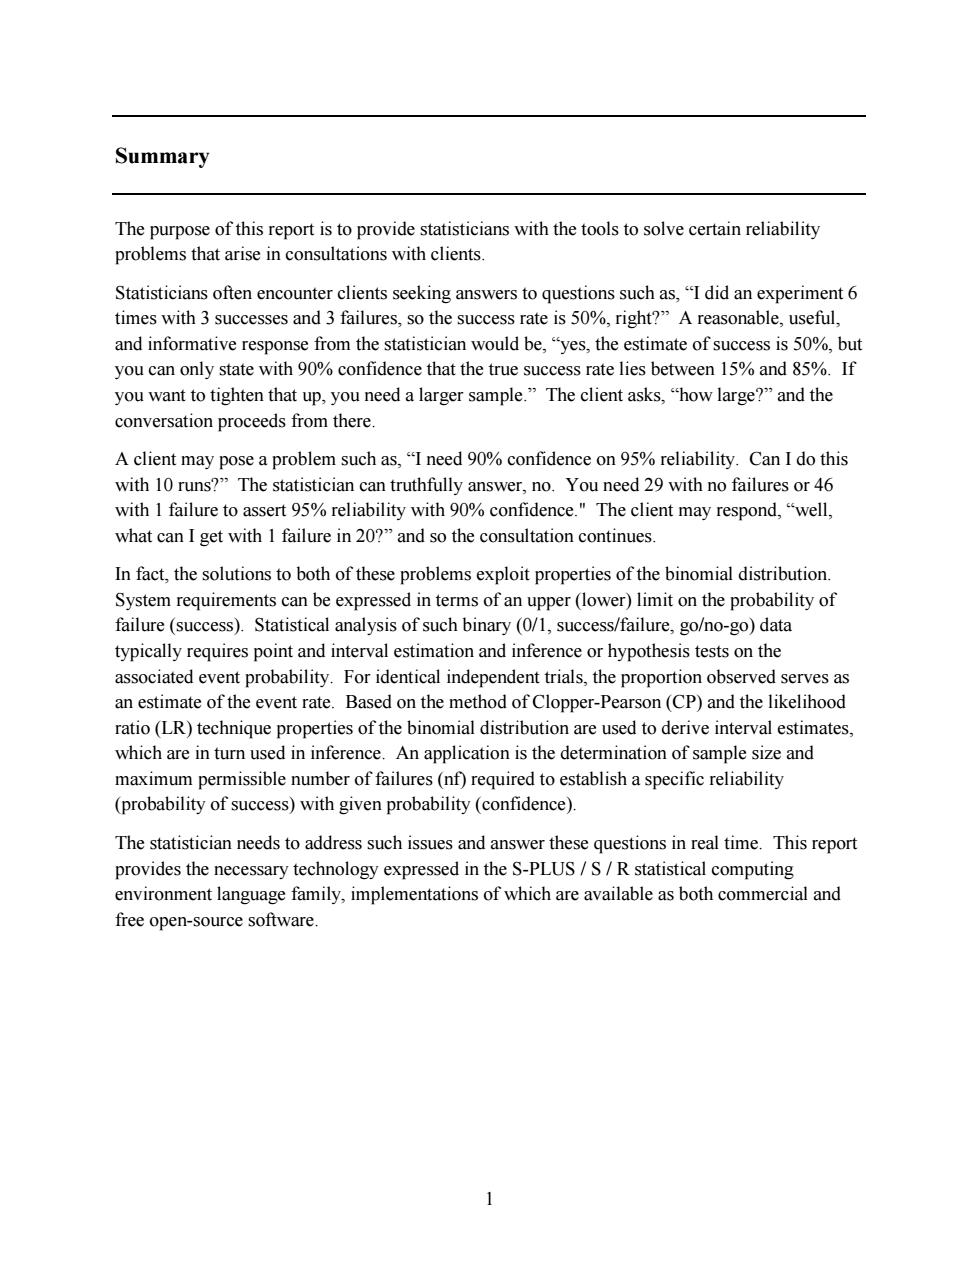
1 Summary The purpose of this report is to provide statisticians with the tools to solve certain reliability problems that arise in consultations with clients. Statisticians often encounter clients seeking answers to questions such as, “I did an experiment 6 times with 3 successes and 3 failures, so the success rate is 50%, right?” A reasonable, useful, and informative response from the statistician would be, “yes, the estimate of success is 50%, but you can only state with 90% confidence that the true success rate lies between 15% and 85%. If you want to tighten that up, you need a larger sample.” The client asks, “how large?” and the conversation proceeds from there. A client may pose a problem such as, “I need 90% confidence on 95% reliability. Can I do this with 10 runs?” The statistician can truthfully answer, no. You need 29 with no failures or 46 with 1 failure to assert 95% reliability with 90% confidence." The client may respond, “well, what can I get with 1 failure in 20?” and so the consultation continues. In fact, the solutions to both of these problems exploit properties of the binomial distribution. System requirements can be expressed in terms of an upper (lower) limit on the probability of failure (success). Statistical analysis of such binary (0/1, success/failure, go/no-go) data typically requires point and interval estimation and inference or hypothesis tests on the associated event probability. For identical independent trials, the proportion observed serves as an estimate of the event rate. Based on the method of Clopper-Pearson (CP) and the likelihood ratio (LR) technique properties of the binomial distribution are used to derive interval estimates, which are in turn used in inference. An application is the determination of sample size and maximum permissible number of failures (nf) required to establish a specific reliability (probability of success) with given probability (confidence). The statistician needs to address such issues and answer these questions in real time. This report provides the necessary technology expressed in the S-PLUS / S / R statistical computing environment language family, implementations of which are available as both commercial and free open-source software

INTENTIONALLY LEFT BLANK. 2
2 INTENTIONALLY LEFT BLANK