autumn bone colorcube cool copper flag gray hot hsv jet lines pink prism spring summer white winter 图P-1 MATLAB中预定义的17种不同的颜色图案(定义在13.6节的表13-2中)。使用的命令有: colormap、pcolor和subplot。注意,命令contrast也可以针对某 幅图创建一个用户自定义颜色图案 图P-2这个卡通几何物体可以用命令sphere、mesh、light、view,axis和图形句柄来创建
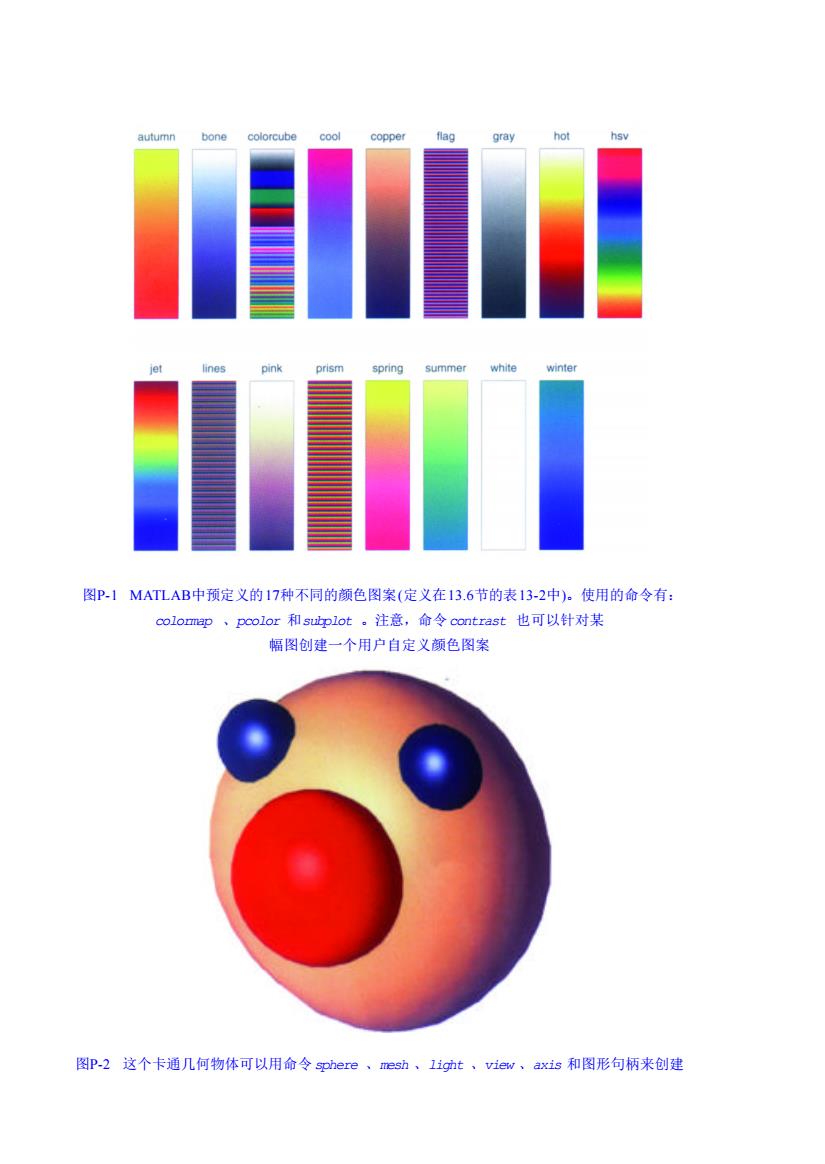
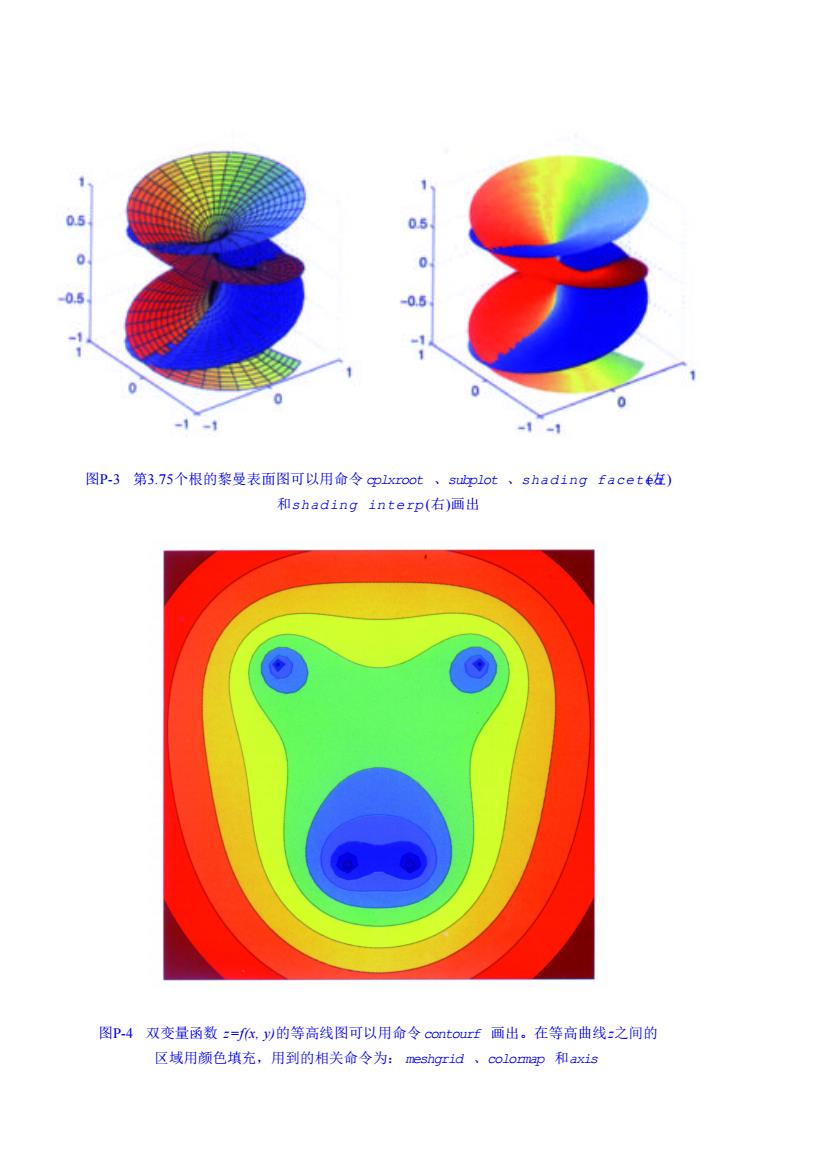
图P-1 MAT L A B中预定义的1 7种不同的颜色图案(定义在1 3 . 6节的表1 3 - 2中)。使用的命令有: c o l o r m a p 、p c o l o r 和s u b p l o t 。注意,命令c o n t r a s t 也可以针对某 幅图创建一个用户自定义颜色图案 图P-2 这个卡通几何物体可以用命令s p h e r e 、m e s h 、l i g h t 、v i e w 、a x i s 和图形句柄来创建

0.5 05 0.5 -0.5 0 0 -1 -4-1 图P-3第3.75个根的黎曼表面图可以用命令cplxroot、subplot、shading facet枉) 和shading interp(右)画出 图P.4双变量函数=f低,以的等高线图可以用命令contourf画出。在等高曲线:之间的 区域用颜色填充,用到的相关命令为:meshgrid、colormap和axis
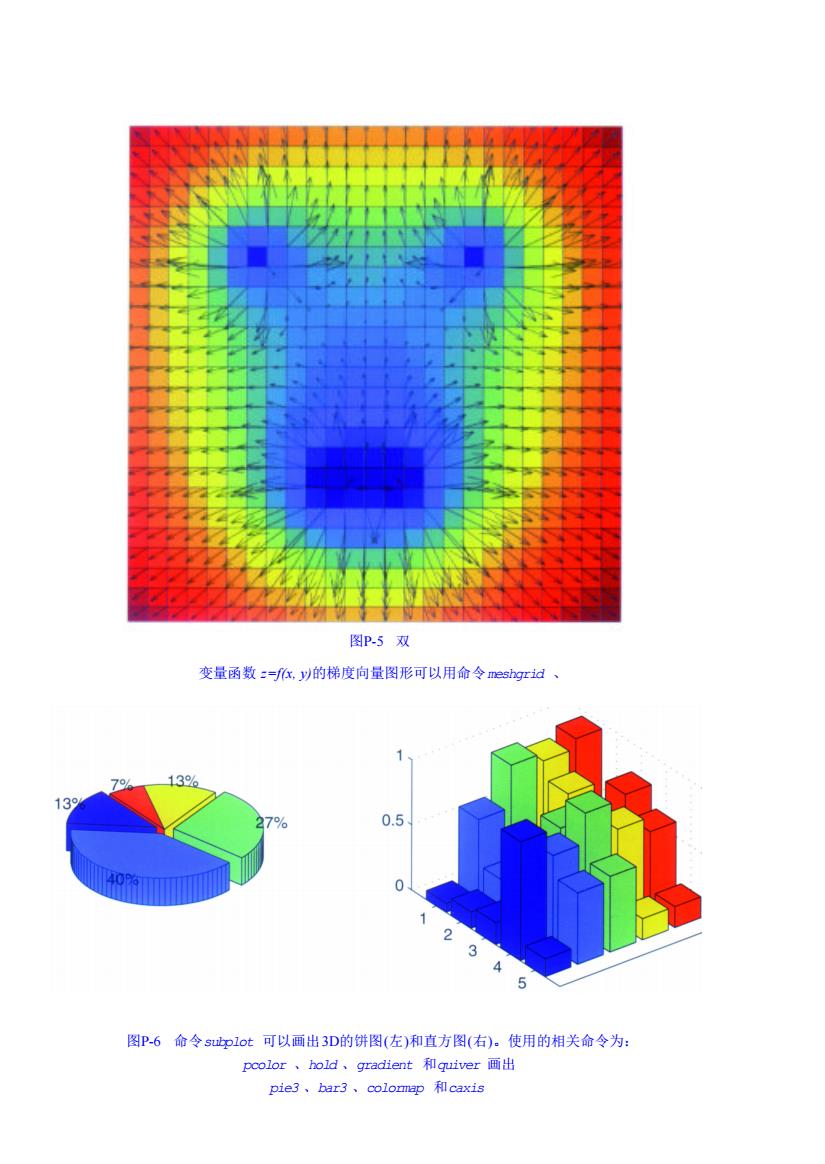
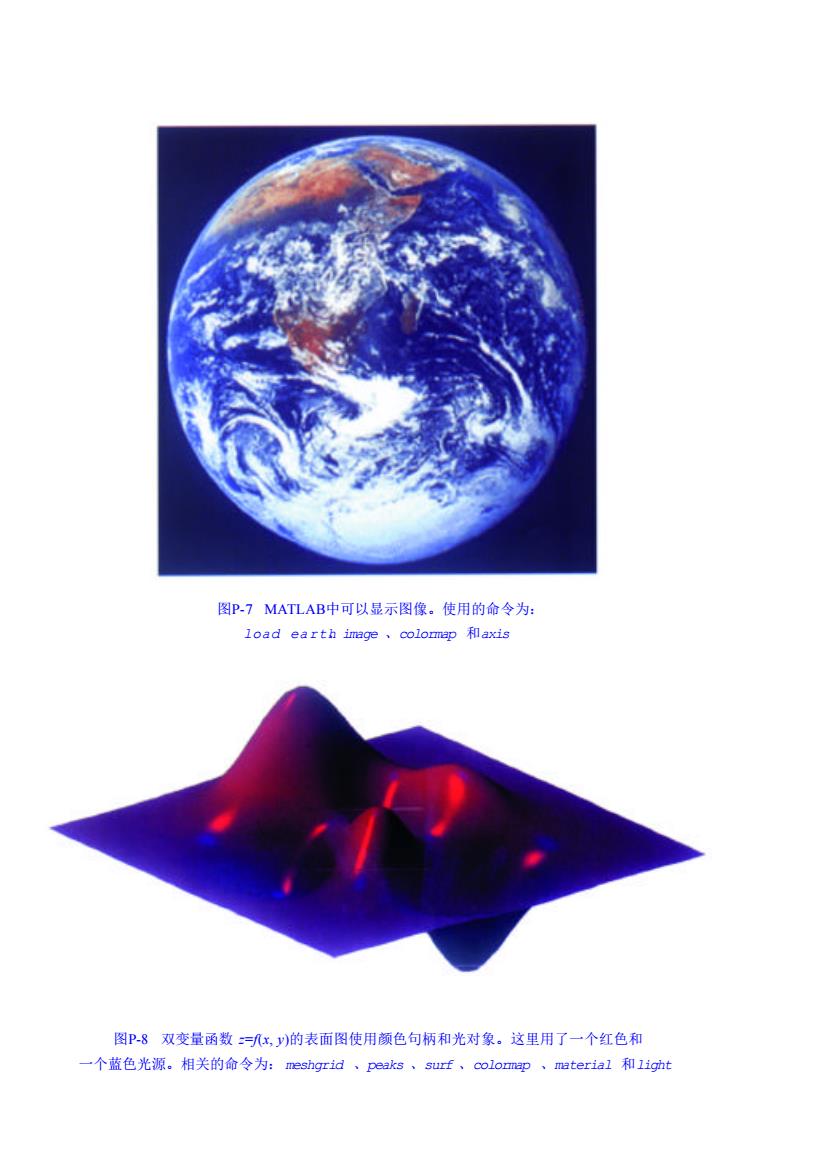
图P-3 第3 . 7 5个根的黎曼表面图可以用命令 c p l x r o o t 、s u b p l o t 、shading faceted(左) 和shading interp (右)画出 图P-4 双变量函数 z=f(x, y)的等高线图可以用命令c o n t o u r f 画出。在等高曲线z之间的 区域用颜色填充,用到的相关命令为: m e s h g r i d 、c o l o r m a p 和a x i s

图P5双 变量函数=f低,以的梯度向量图形可以用命令meshgrid、 72 13% 13 27% 0.5 0 24 5 图P-6命令subplot可以画出3D的饼图(左)和直方图(右)。使用的相关命令为: pcolor、hold、gradient和quiver画出 pie3、bar3、colormap和caxis
图P-5 双 变量函数 z=f(x, y)的梯度向量图形可以用命令m e s h g r i d 、 图P-6 命令s u b p l o t 可以画出3 D的饼图(左)和直方图(右)。使用的相关命令为: p c o l o r 、h o l d 、g r a d i e n t 和q u i v e r 画出 p i e 3 、b a r 3 、c o l o r m a p 和c a x i s

图P7 MATLAB中可以显示图像。使用的命令为: load earth image、colormap和axis 图P-8双变量函数=x,y)的表面图使用颜色句柄和光对象。这里用了一个红色和 一个蓝色光源。相关的命令为:meshgrid、peaks、surf、colorap、material和light
图P-7 MAT L A B中可以显示图像。使用的命令为: load earth、i m a g e 、c o l o r m a p 和a x i s 图P-8 双变量函数 z=f(x, y)的表面图使用颜色句柄和光对象。这里用了一个红色和 一个蓝色光源。相关的命令为: m e s h g r i d 、p e a k s 、s u r f 、c o l o r m a p 、m a t e r i a l 和l i g h t