Chapter 10,part B Classification of Microorganisms
Copyright © 2004 Pearson Education, Inc., publishing as Benjamin Cummings B.E Pruitt & Jane J. Stein Chapter 10, part B Classification of Microorganisms
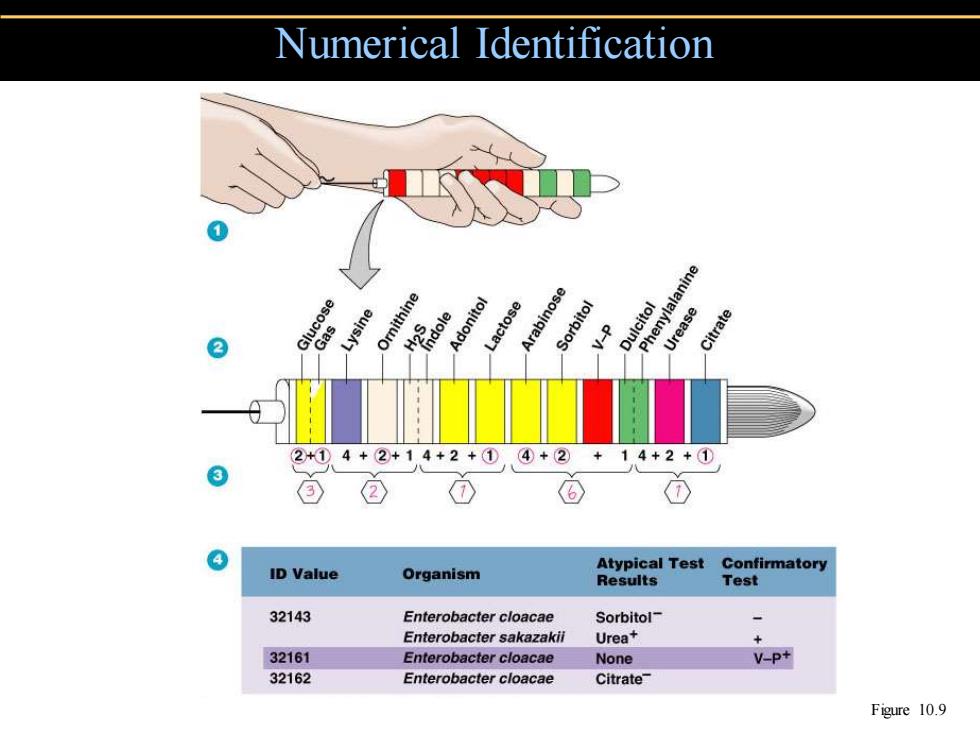
Numerical Identification ose Lysine Ornithine Adonitol ctose rabinose V enylalanine Dulcitol 2 Urease Citrate 2+①4+②+14+2+① ④+② 14+2+① ② ID Value Atypical Test Confirmatory Organism Results Test 32143 Enterobacter cloacae Sorbitol- Enterobacter sakazakii Urea+ + 32161 Enterobacter cloacae None V-P+ 32162 Enterobacter cloacae Citrate Figure 10.9
Numerical Identification Figure 10.9
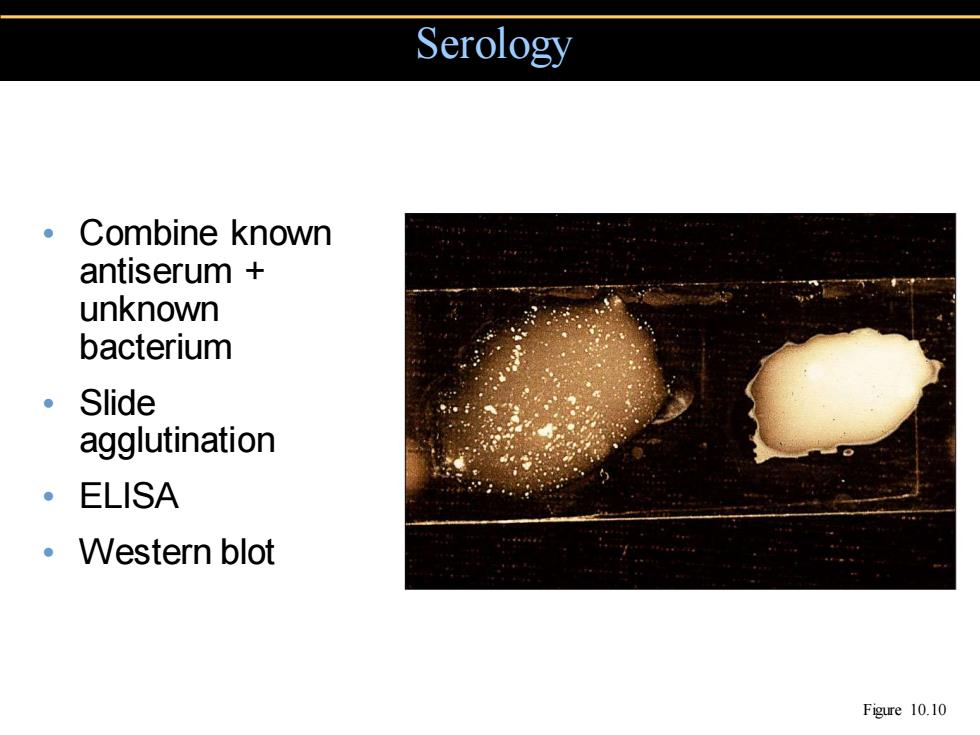
Serology 。Combine known antiserum unknown bacterium 。Slide agglutination 。ELISA Western blot Figure 10.10
• Combine known antiserum + unknown bacterium • Slide agglutination • ELISA • Western blot Serology Figure 10.10
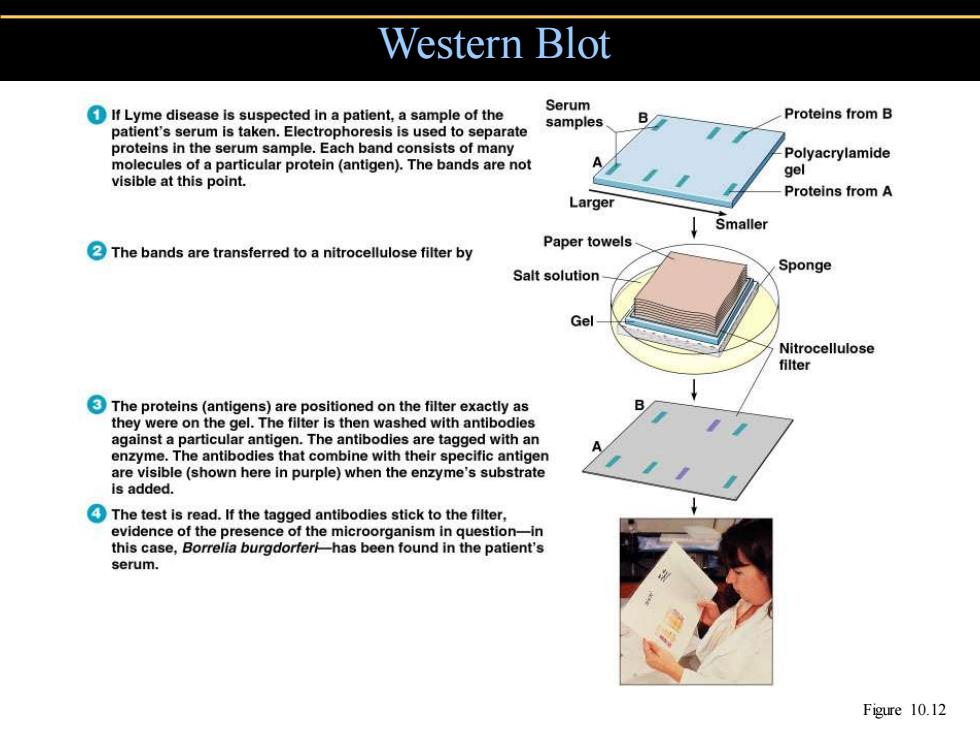
Western Blot If Lyme disease is suspected in a patient,a sample of the Serum Proteins from B samples patient's serum is taken.Electrophoresis is used to separate B/ proteins in the serum sample.Each band consists of many -Polyacrylamide molecules of a particular protein (antigen).The bands are not A 9e1 visible at this point. Proteins from A Larger Smaller The bands are transferred to a nitrocellulose filter by Paper towels- Salt solution Sponge Gel Nitrocellulose filter The proteins(antigens)are positioned on the filter exactly as they were on the gel.The filter is then washed with antibodies against a particular antigen.The antibodies are tagged with an enzyme.The antibodies that combine with their specific antigen are visible(shown here in purple)when the enzyme's substrate is added. The test is read.If the tagged antibodies stick to the filter, evidence of the presence of the microorganism in question-in this case,Borrelia burgdorferi-has been found in the patient's serum. Figure 10.12
Western Blot Figure 10.12
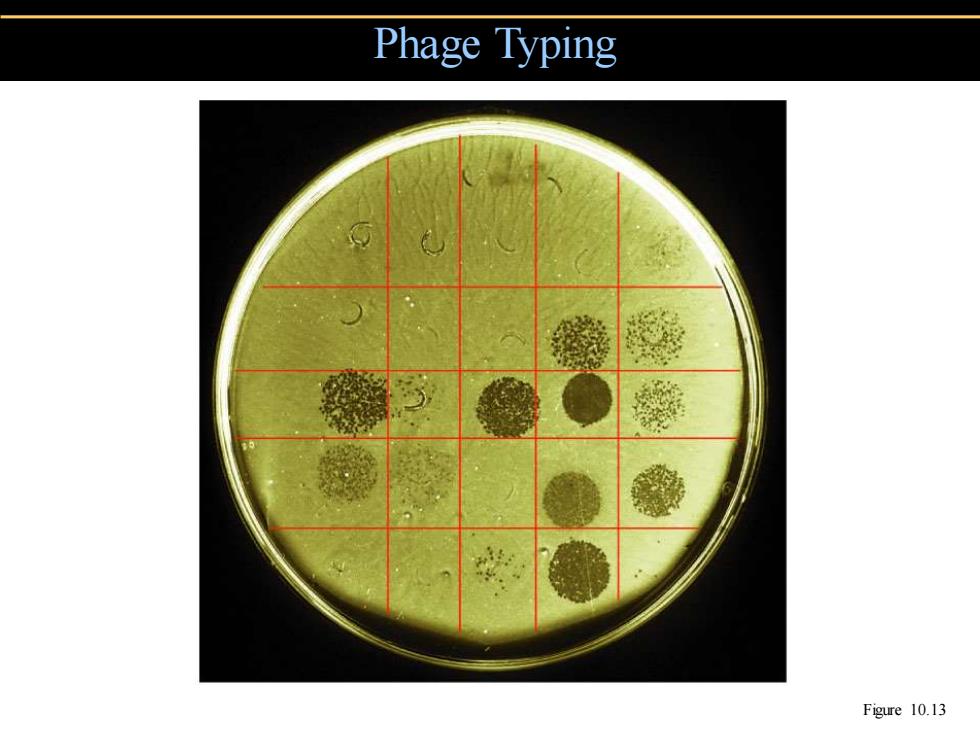
Phage Typing Figure 10.13
Phage Typing Figure 10.13
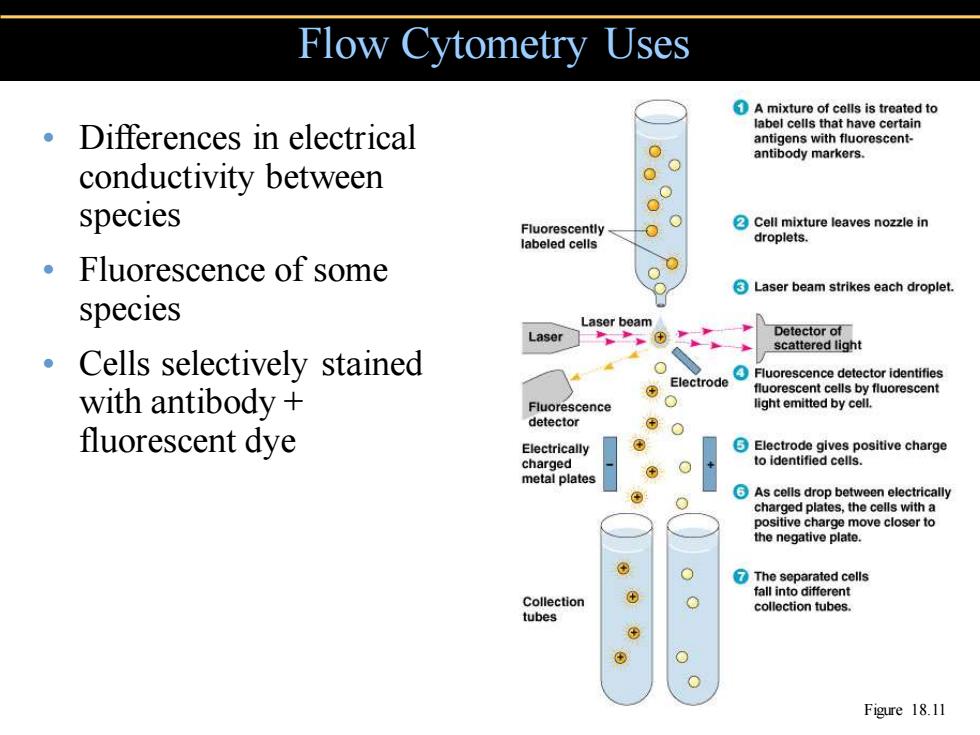
Flow Cytometry Uses A mixture of cells is treated to Differences in electrical label cells that have certain 0 antigens with fluorescent- antibody markers. conductivity between species 00 Fluorescently Cell mixture leaves nozzle in labeled cells droplets. 。Fluorescence of some Laser beam strikes each droplet. species Laser beam Laser Detector of scattered light Cells selectively stained Electrode Fluorescence detector identifies with antibody fluorescent cells by fluorescent Fluorescence light emitted by cell detector fluorescent dye Electrically Electrode gives positive charge to identified cells. As cells drop between electrically charged plates,the cells with a positive charge move closer to the negative plate. ⑦The separated cells fall into different Collection collection tubes. tubes Figure 18.11
• Differences in electrical conductivity between species • Fluorescence of some species • Cells selectively stained with antibody + fluorescent dye Flow Cytometry Uses Figure 18.11
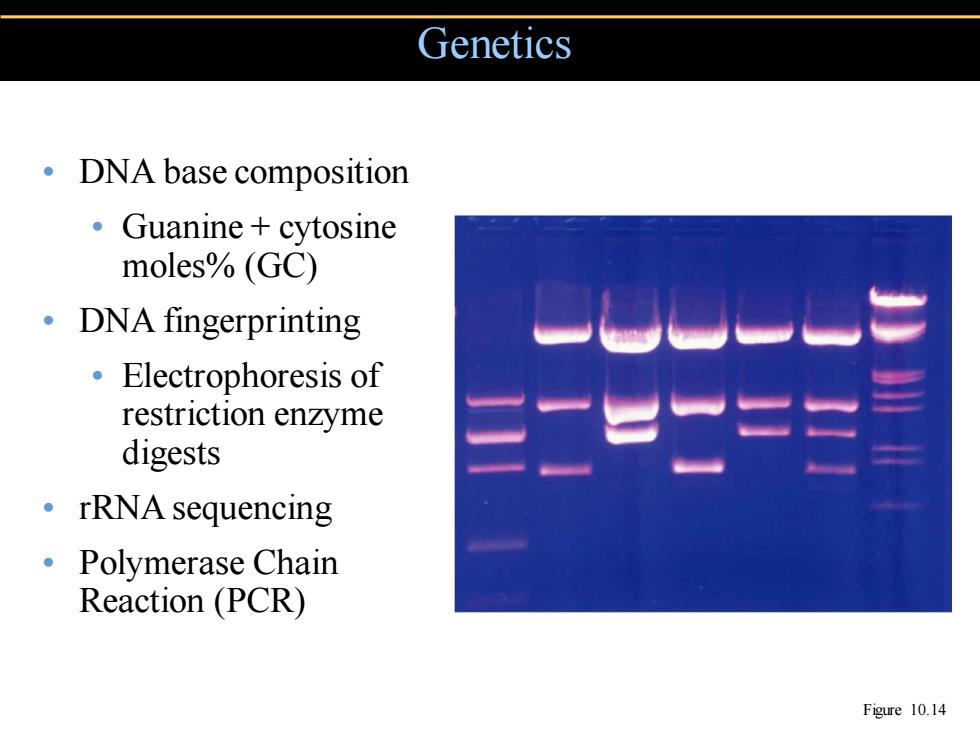
Genetics 。DNA base composition 。Guanine+cytosine moles%(GC) 。DNA fingerprinting 。Electrophoresis of restriction en:☑yme digests 三二二二二 。rRNA sequencing 。Polymerase Chain Reaction (PCR) Figure 10.14
• DNA base composition • Guanine + cytosine moles% (GC) • DNA fingerprinting • Electrophoresis of restriction enzyme digests • rRNA sequencing • Polymerase Chain Reaction (PCR) Genetics Figure 10.14
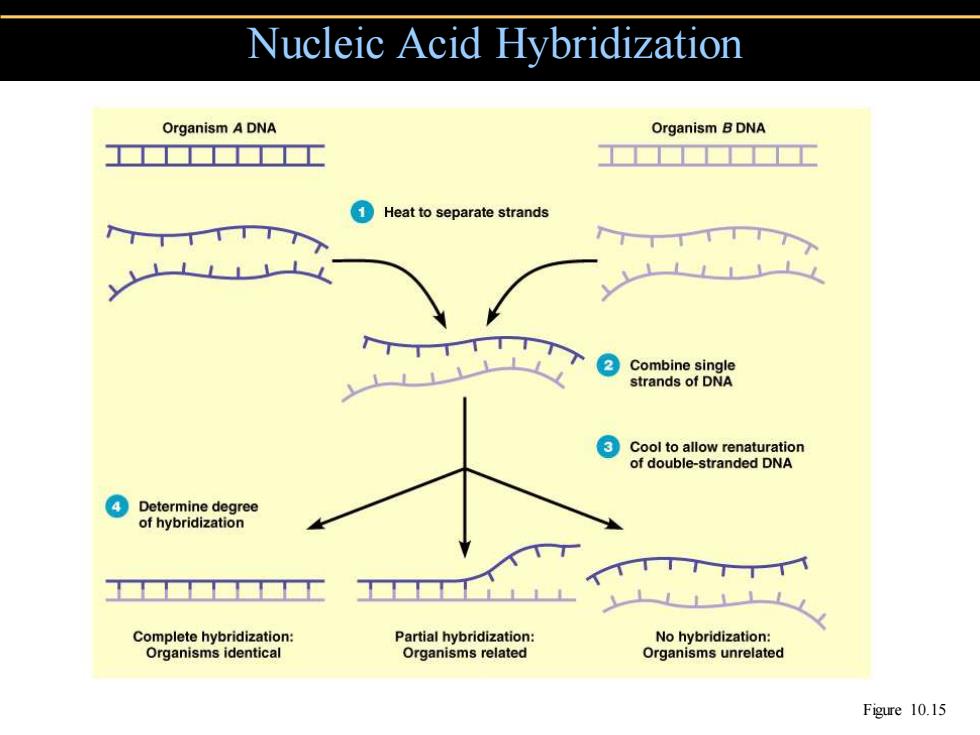
Nucleic Acid Hybridization Organism A DNA Organism B DNA ■■■工 ■■■■ 1Heat to separate strands Combine single strands of DNA Cool to allow renaturation of double-stranded DNA ④Determine degree of hybridization Complete hybridization: Partial hybridization: No hybridization: Organisms identical Organisms related Organisms unrelated Figure 10.15
Nucleic Acid Hybridization Figure 10.15
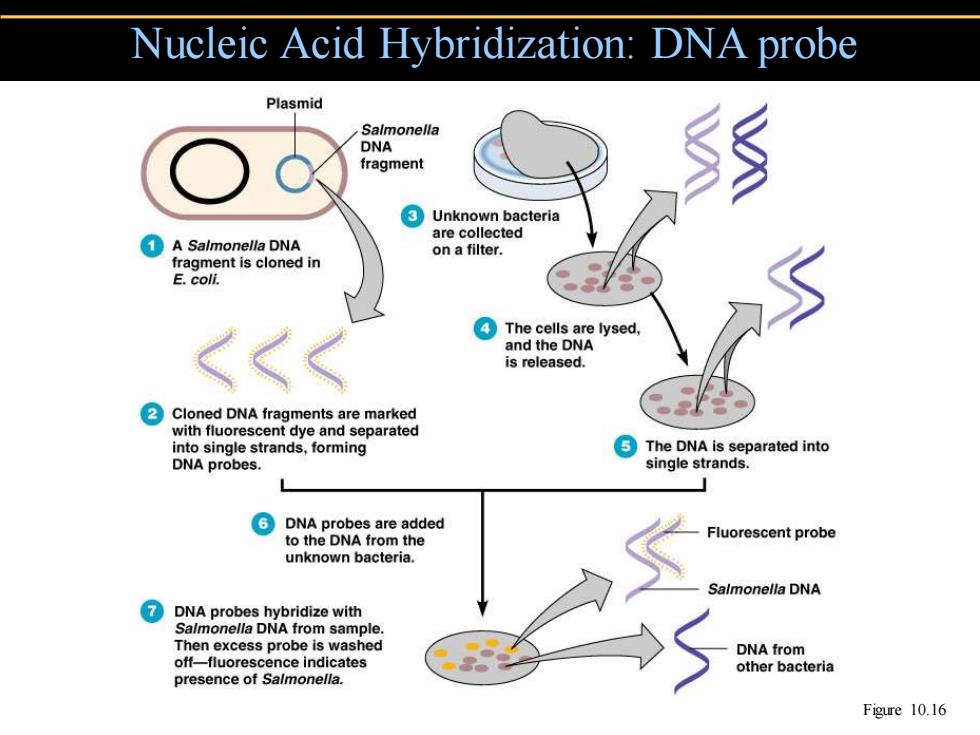
Nucleic Acid Hybridization:DNA probe Plasmid Salmonella DNA fragment ③Unknown bacteria are collected ①A Salmonella DNA on a filter. fragment is cloned in E.coli. ④The cells are lysed, and the DNA is released. Cloned DNA fragments are marked with fluorescent dye and separated into single strands,forming The DNA is separated into DNA probes. single strands. L DNA probes are added to the DNA from the Fluorescent probe unknown bacteria. Salmonella DNA ⑦ DNA probes hybridize with Salmonella DNA from sample. Then excess probe is washed DNA from off-fluorescence indicates other bacteria presence of Salmonella. Figure 10.16
Nucleic Acid Hybridization: DNA probe Figure 10.16
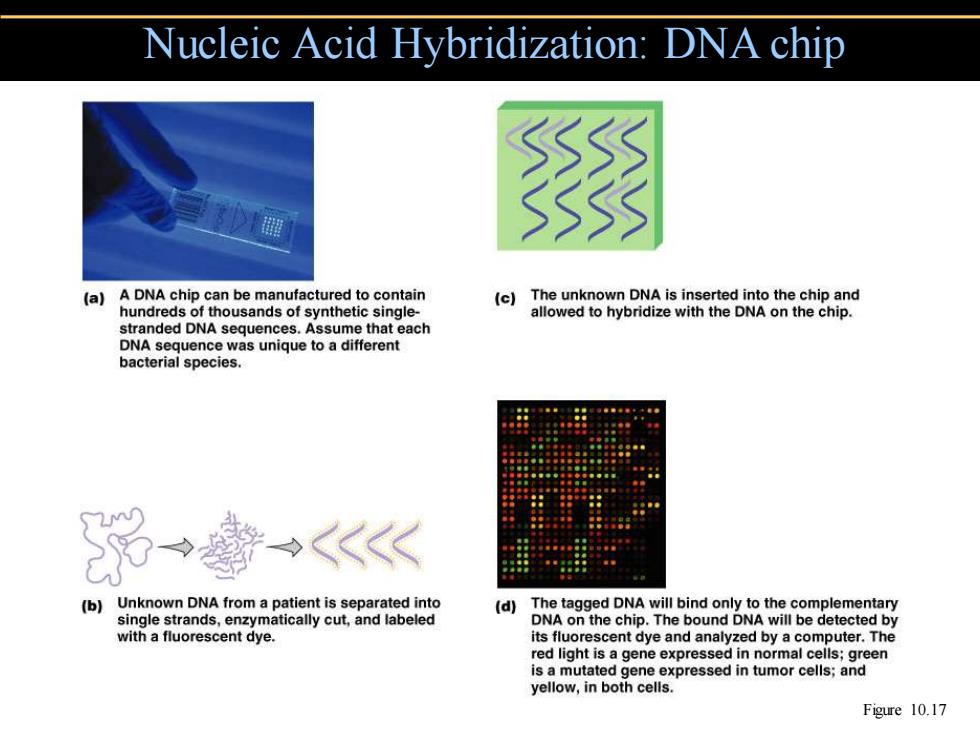
Nucleic Acid Hybridization:DNA chip (a)A DNA chip can be manufactured to contain (c)The unknown DNA is inserted into the chip and hundreds of thousands of synthetic single- allowed to hybridize with the DNA on the chip. stranded DNA sequences.Assume that each DNA sequence was unique to a different bacterial species. →<《 (b)Unknown DNA from a patient is separated into (d) The tagged DNA will bind only to the complementary single strands,enzymatically cut,and labeled DNA on the chip.The bound DNA will be detected by with a fluorescent dye. its fluorescent dye and analyzed by a computer.The red light is a gene expressed in normal cells;green is a mutated gene expressed in tumor cells;and yellow,in both cells. Figure 10.17
Nucleic Acid Hybridization: DNA chip Figure 10.17