SERS (surface enhanced Raman spectroscopy)
(surface enhanced Raman spectroscopy) SERS
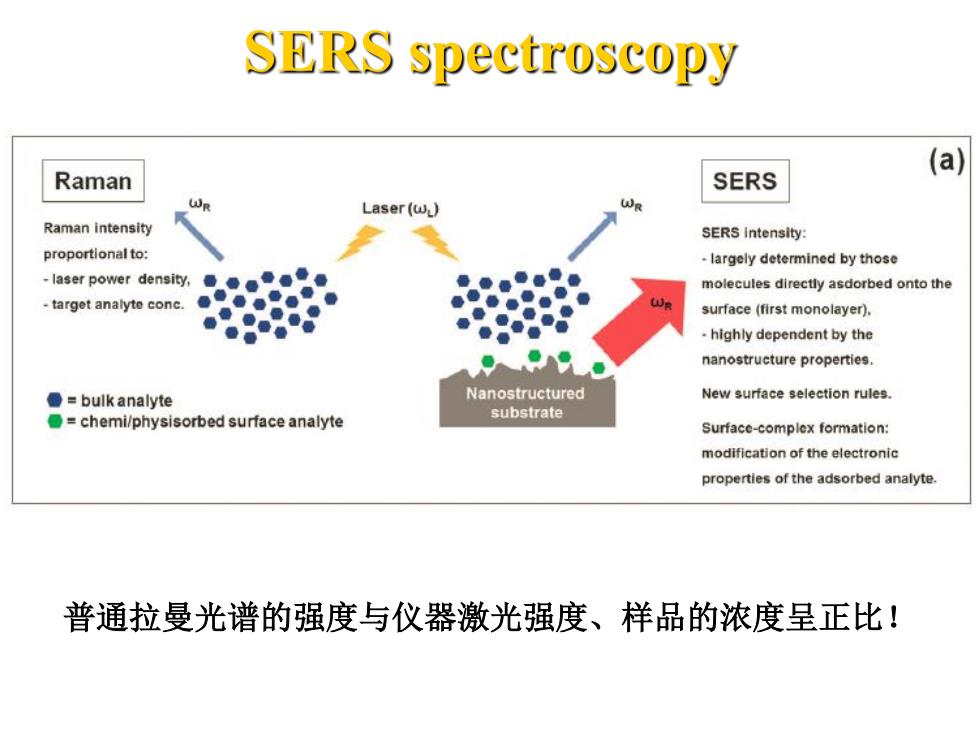
SERS spectroscopy (a) Raman SERS WR Laser(w) Raman intensity SERS Intensity: proportional to: largely determined by those -laser power density,●●。●●量● molecules directly asdorbed onto the -target analyte conc. surface(first monolayer). ●● highly dependent by the ●9 nanostructure properties. ●=bulk analyte Nanostructured New surface selection rules. O=chemi/physisorbed surface analyte substrate Surface-complex formation: modification of the electronic properties of the adsorbed analyte 普通拉曼光谱的强度与仪器激光强度、样品的浓度呈正比!
SERS spectroscopy 普通拉曼光谱的强度与仪器激光强度、样品的浓度呈正比!
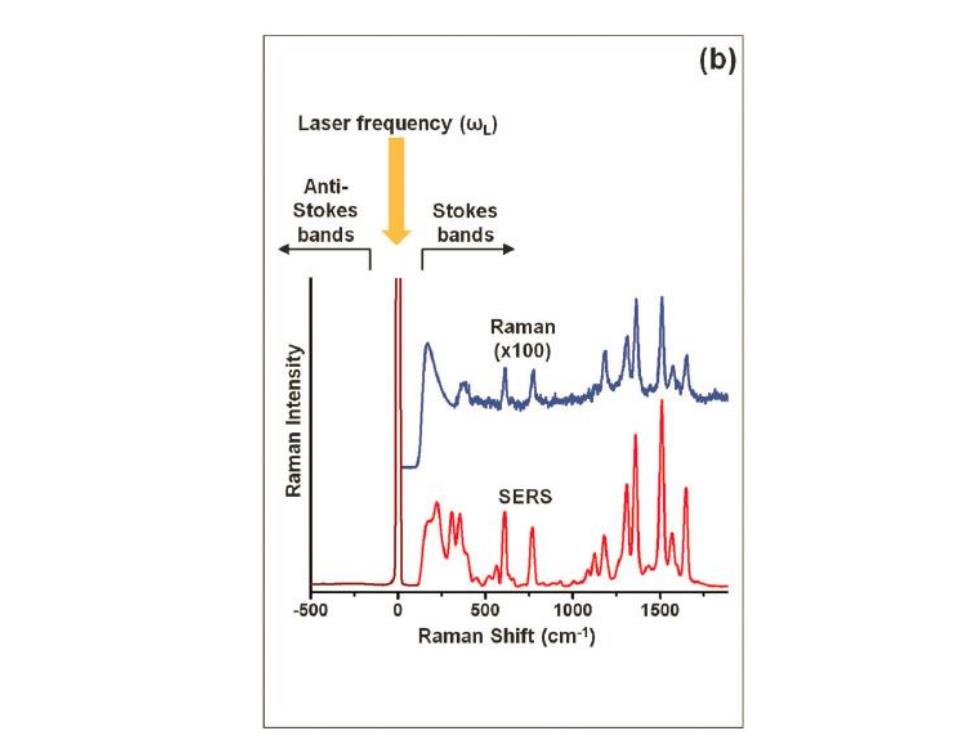
(b) Laser frequency (wL) Anti- Stokes Stokes bands bands Raman (x100) SERS -500 500 1000 1500 Raman Shift(cm-1)
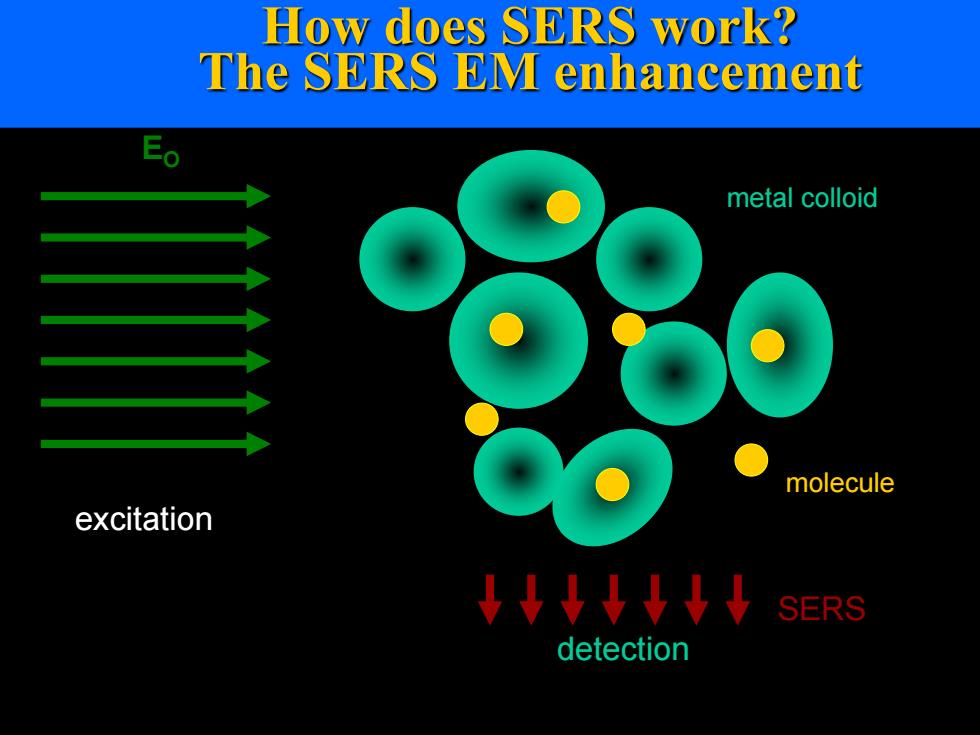
How does SERS work? The SERS EM enhancement metal colloid molecule excitation ↓↓↓↓↓↓↓ SERS detection
How does SERS work? The SERS EM enhancement EO metal colloid excitation detection SERS molecule
表面增强拉曼光谱的确切机理仍然在争论中。有两种机 理基本不同的理论,实验中仍无法准确地区分它们。电 磁理论提出机理是局部表面等离子体的激发,而化学理 论提出是电荷转移配合物的形成。化学理论仅适用于表 面已形成化学键的物质,所以不能解释所有观察到的增 强信号,而电磁理论可以应用于试样只是物理吸附在表 面的情况下。最近的研究表明,当激发分子远离承载金 属纳米颗粒的表面,导致表面等离子体现象时,表面增 强拉曼现象也可以发生。这一观察有力支撑了表面增强 拉曼光谱的电磁理论
表面增强拉曼光谱的确切机理仍然在争论中。有两种机 理基本不同的理论,实验中仍无法准确地区分它们。电 磁理论提出机理是局部表面等离子体的激发,而化学理 论提出是电荷转移配合物的形成。化学理论仅适用于表 面已形成化学键的物质,所以不能解释所有观察到的增 强信号,而电磁理论可以应用于试样只是物理吸附在表 面的情况下。最近的研究表明,当激发分子远离承载金 属纳米颗粒的表面,导致表面等离子体现象时,表面增 强拉曼现象也可以发生。这一观察有力支撑了表面增强 拉曼光谱的电磁理论
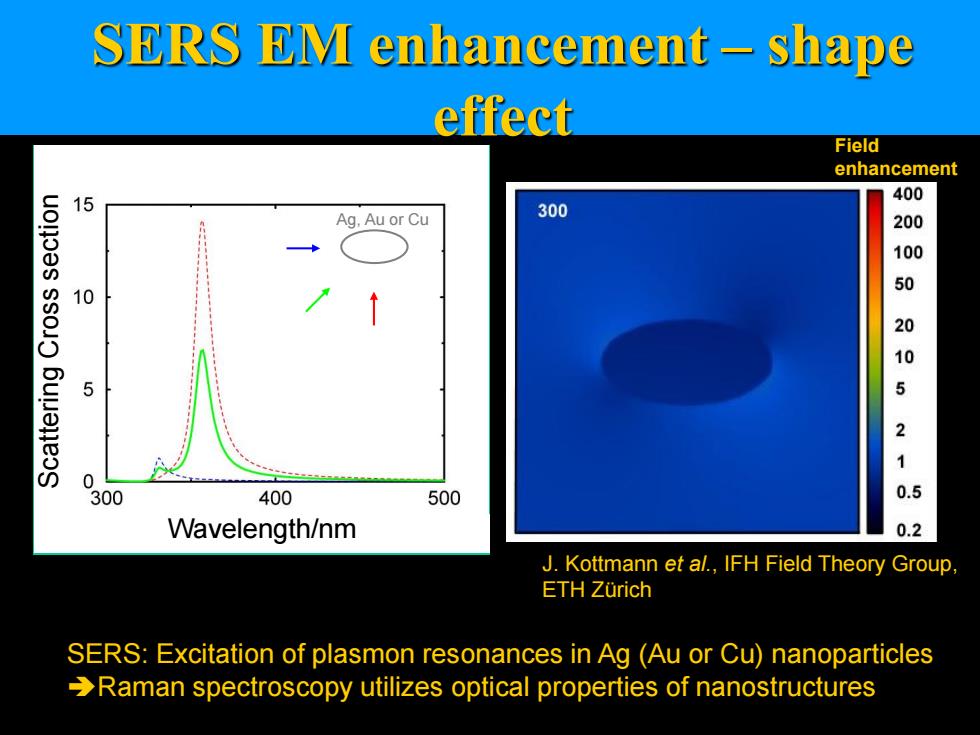
SERS EM enhancement-shape effect Field enhancement 15 400 Ag.Au or Cu 300 200 100 50 10 20 5 105 21 0 300 400 500 0.5 Wavelength/nm 0.2 J.Kottmann et al.,IFH Field Theory Group ETH Zurich SERS:Excitation of plasmon resonances in Ag (Au or Cu)nanoparticles Raman spectroscopy utilizes optical properties of nanostructures
SERS EM enhancement – shape effect SERS: Excitation of plasmon resonances in Ag (Au or Cu) nanoparticles Raman spectroscopy utilizes optical properties of nanostructures Wavelength [nm] SCS [nm] J. Kottmann et al., IFH Field Theory Group, ETH Zürich Ag, Au or Cu Wavelength/nm Scattering Cross section Field enhancement
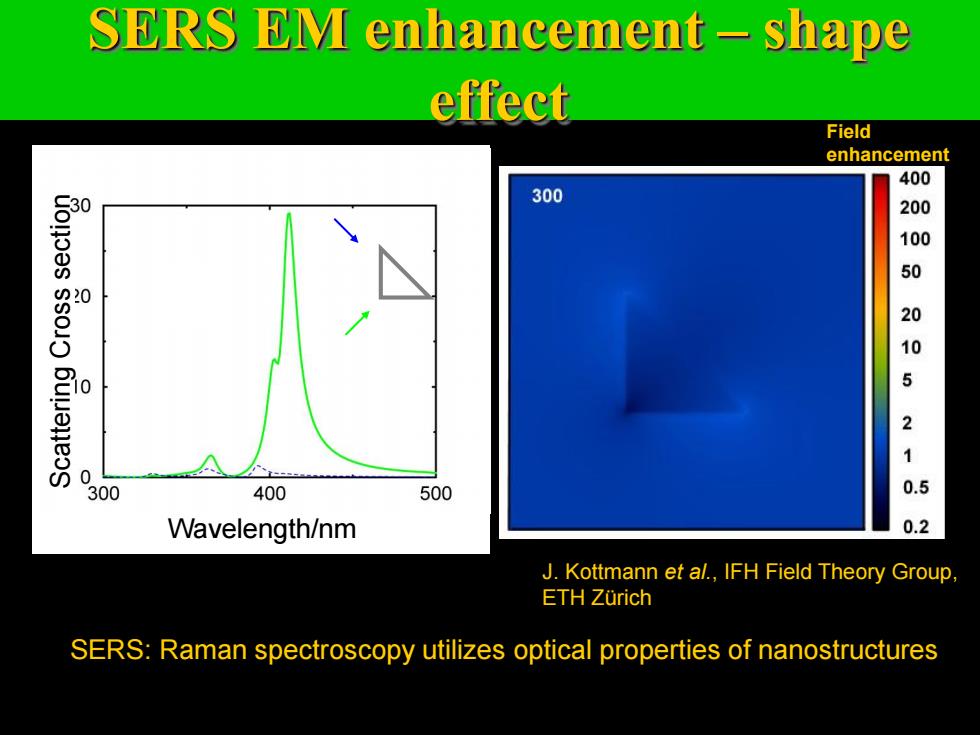
SERS EM enhancement-shape effect Field enhancement 400 300 200 1 50 00521 300 400 500 0.5 Wavelength/nm 0.2 J.Kottmann et al.,IFH Field Theory Group, ETH Zurich SERS:Raman spectroscopy utilizes optical properties of nanostructures
SERS: Raman spectroscopy utilizes optical properties of nanostructures J. Kottmann et al., IFH Field Theory Group, ETH Zürich Wavelength [nm] SCS [nm] *10 SERS EM enhancement – shape effect Scattering Cross section Wavelength/nm Field enhancement
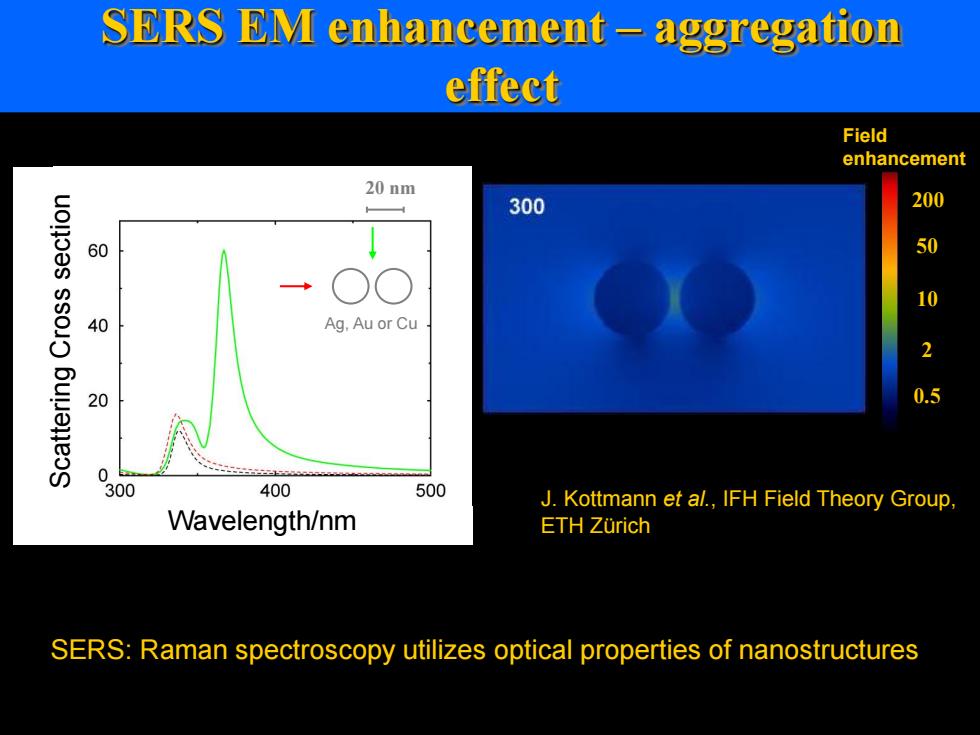
SERS EM enhancement-aggregation effect Field enhancement 20nm 300 200 60 50 10 40 Ag.Au or Cu 20 0.5 0 300 400 500 J.Kottmann et al.,IFH Field Theory Group. Wavelength/nm ETH Zurich SERS:Raman spectroscopy utilizes optical properties of nanostructures
SERS: Raman spectroscopy utilizes optical properties of nanostructures 20 nm J. Kottmann et al., IFH Field Theory Group, ETH Zürich Ag, Au or Cu SERS EM enhancement – aggregation effect Field enhancement 400 200 100 50 20 10 5 2 1 0.5 0.2 Scattering Cross section Wavelength/nm
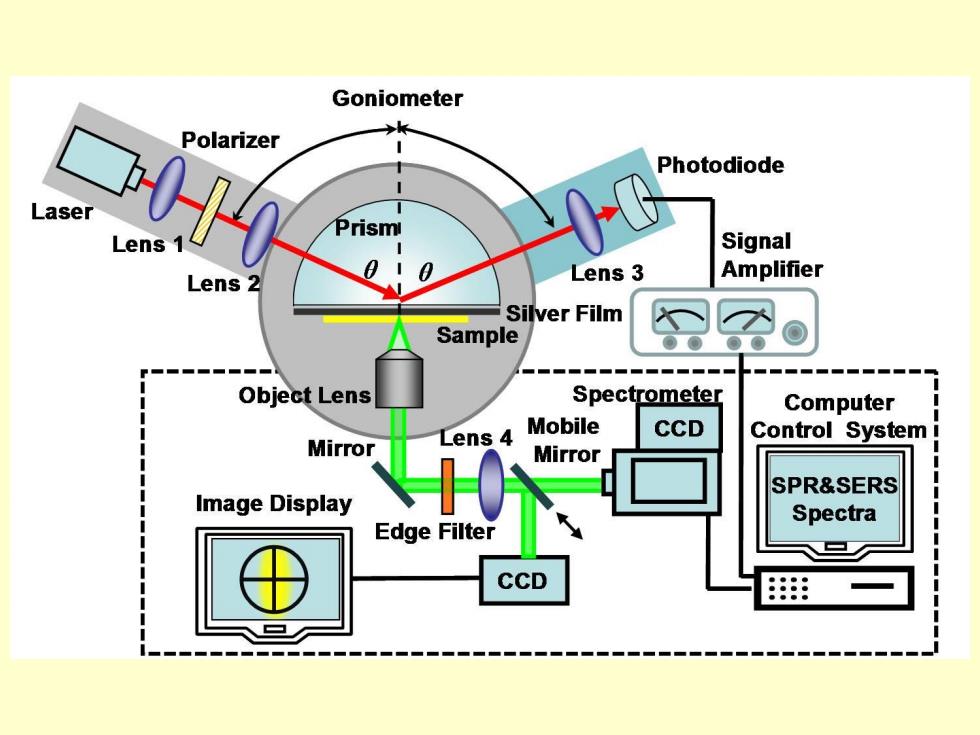
Goniometer k Polarizer Photodiode Laser Prism Lens Signal Lens 2 010 Lens 3 Amplifier Silver Film Sample Object Lens Spectrometer Computer Lens 4 Mobile CCD Control System Mirror Mirror SPR&SERS Image Display Spectra Edge Filter CCD 册
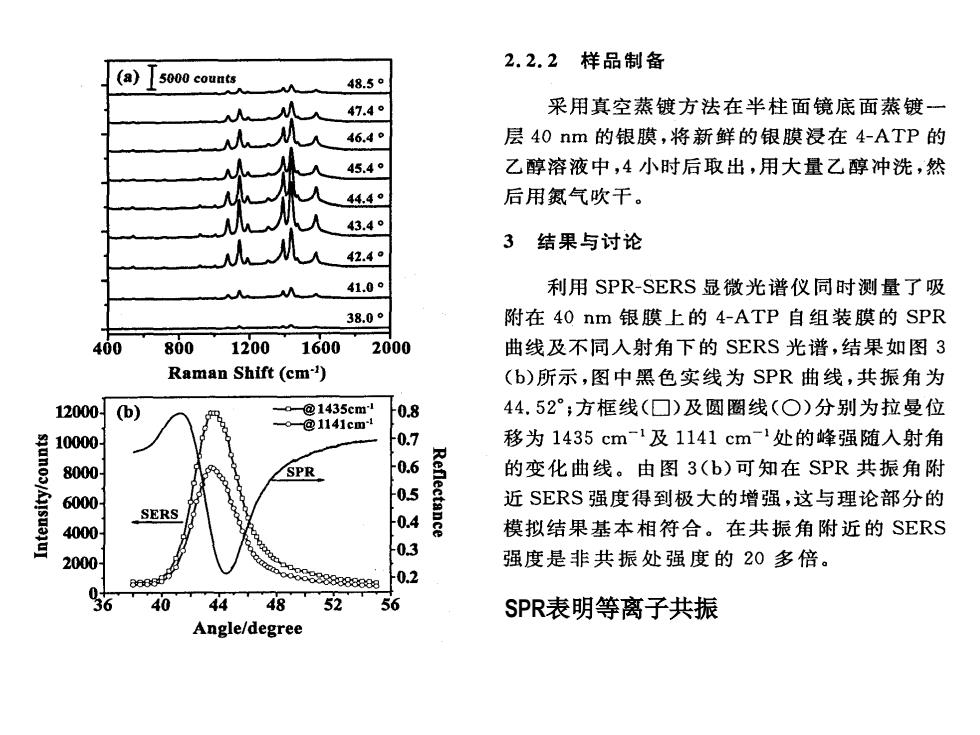
2.2.2样品制备 (a) 5000 counts 48.5c 47.4° 采用真空蒸镀方法在半柱面镜底面蒸镀一 46.4 层40nm的银膜,将新鲜的银膜浸在4-ATP的 45.4° 乙醇溶液中,4小时后取出,用大量乙醇冲洗,然 44.4。 后用氮气吹干。 43.4° 3结果与讨论 42.4o 41.0 利用SPR-SERS显微光谱仪同时测量了吸 38.0° 附在40nm银膜上的4-ATP自组装膜的SPR 400 80012001600 2000 曲线及不同人射角下的SERS光谱,结果如图3 Raman Shift(cm) (b)所示,图中黑色实线为SPR曲线,共振角为 120004b) @1435cm1 0.8 44.52°;方框线(☐)及圆圈线(○)分别为拉曼位 @1141cm 10000 0.7 移为1435cm-1及1141cm-1处的峰强随入射角 8000 0.6 的变化曲线。由图3(b)可知在SPR共振角附 6 -0.5 Reflectance 近SERS强度得到极大的增强,这与理论部分的 4000 0.4 模拟结果基本相符合。在共振角附近的SERS -0.3 2000 强度是非共振处强度的20多倍。 88888888889 0.2 56 40 44 48 52 56 SPR表明等离子共振 Angle/degree
SPR表明等离子共振