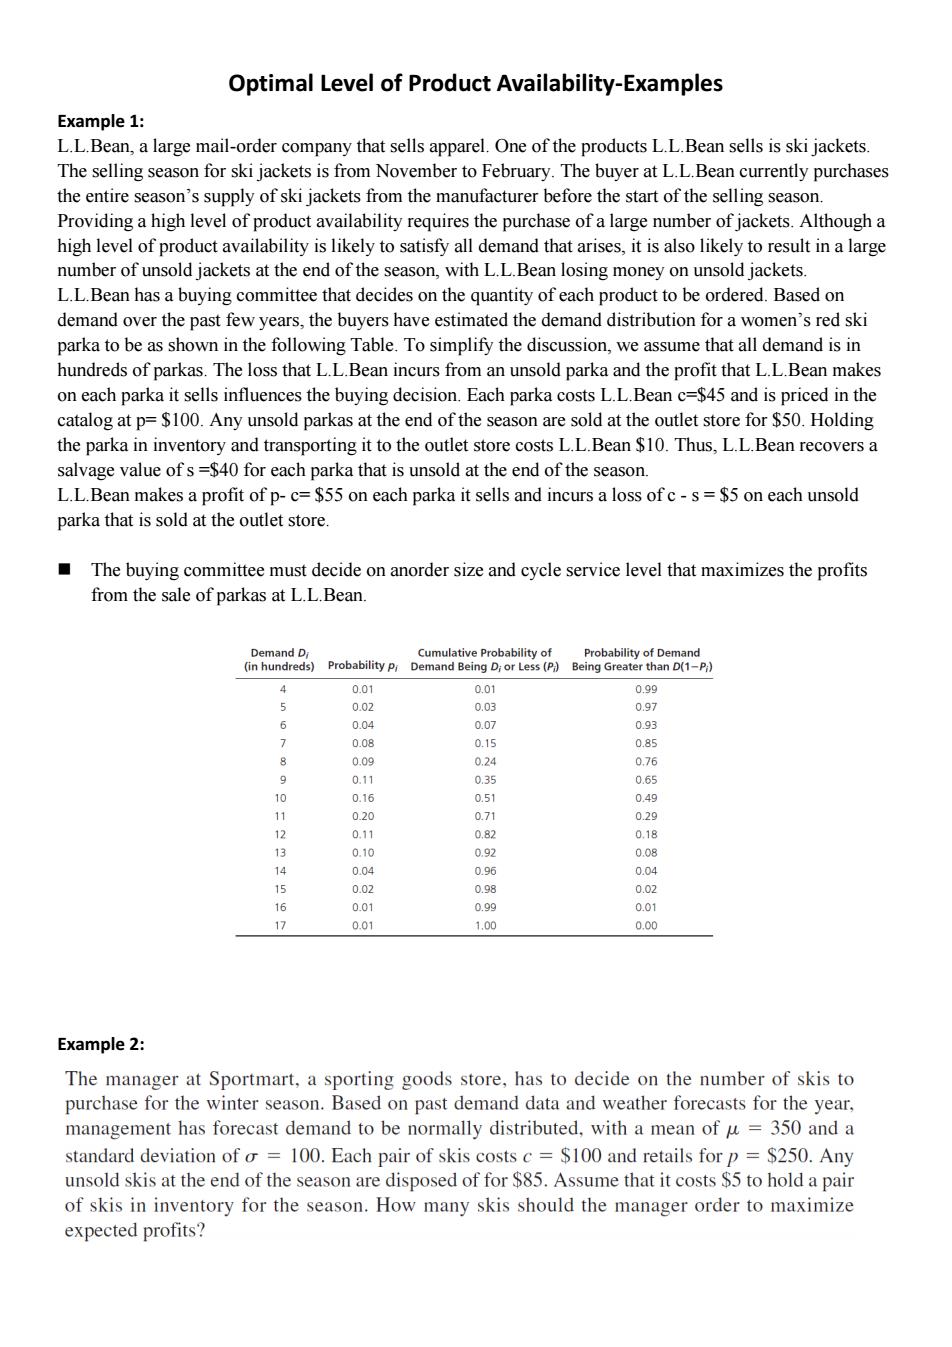
Optimal Level of Product Availability-Examples Example 1: L.L.Bean,a large mail-order company that sells apparel.One of the products L.L.Bean sells is ski jackets. The selling season for ski jackets is from November to February.The buyer at L.L.Bean currently purchases the entire season's supply of ski jackets from the manufacturer before the start of the selling season. Providing a high level of product availability requires the purchase of a large number of jackets.Although a high level of product availability is likely to satisfy all demand that arises,it is also likely to result in a large number of unsold jackets at the end of the season,with L.L.Bean losing money on unsold jackets. L.L.Bean has a buying committee that decides on the quantity of each product to be ordered.Based on demand over the past few years,the buyers have estimated the demand distribution for a women's red ski parka to be as shown in the following Table.To simplify the discussion,we assume that all demand is in hundreds of parkas.The loss that L.L.Bean incurs from an unsold parka and the profit that L.L.Bean makes on each parka it sells influences the buying decision.Each parka costs L.L.Bean c=$45 and is priced in the catalog at p=$100.Any unsold parkas at the end of the season are sold at the outlet store for $50.Holding the parka in inventory and transporting it to the outlet store costs L.L.Bean $10.Thus,L.L.Bean recovers a salvage value ofs =$40 for each parka that is unsold at the end of the season. L.L.Bean makes a profit of p-c=$55 on each parka it sells and incurs a loss of c-s=$5 on each unsold parka that is sold at the outlet store. The buying committee must decide on anorder size and cycle service level that maximizes the profits from the sale of parkas at L.L.Bean. Demand Di Cumulative Probability of Probability of Demand (in hundreds)Probability p Demand Being D;or Less(P)Being Greater than D(1-P;) 4 0.01 0.01 0.99 0.02 0.03 0.97 6 0.04 0.07 0.93 0.08 0.15 0.85 8 0.09 0.24 0.76 9 0.11 0.35 0.65 10 0.16 0.51 0.49 11 0.20 0.71 0.29 12 0.11 0.82 0.18 13 0.10 0.92 0.08 14 0.04 0.96 0.04 15 0.02 0.98 0.02 16 0.01 0.99 0.01 1) 0.01 1.00 0.00 Example 2: The manager at Sportmart,a sporting goods store,has to decide on the number of skis to purchase for the winter season.Based on past demand data and weather forecasts for the year, management has forecast demand to be normally distributed,with a mean of u=350 and a standard deviation of o 100.Each pair of skis costs c $100 and retails for p $250.Any unsold skis at the end of the season are disposed of for $85.Assume that it costs $5 to hold a pair of skis in inventory for the season.How many skis should the manager order to maximize expected profits?
Optimal Level of Product Availability-Examples Example 1: L.L.Bean, a large mail-order company that sells apparel. One of the products L.L.Bean sells is ski jackets. The selling season for ski jackets is from November to February. The buyer at L.L.Bean currently purchases the entire season’s supply of ski jackets from the manufacturer before the start of the selling season. Providing a high level of product availability requires the purchase of a large number of jackets. Although a high level of product availability is likely to satisfy all demand that arises, it is also likely to result in a large number of unsold jackets at the end of the season, with L.L.Bean losing money on unsold jackets. L.L.Bean has a buying committee that decides on the quantity of each product to be ordered. Based on demand over the past few years, the buyers have estimated the demand distribution for a women’s red ski parka to be as shown in the following Table. To simplify the discussion, we assume that all demand is in hundreds of parkas. The loss that L.L.Bean incurs from an unsold parka and the profit that L.L.Bean makes on each parka it sells influences the buying decision. Each parka costs L.L.Bean c=$45 and is priced in the catalog at p= $100. Any unsold parkas at the end of the season are sold at the outlet store for $50. Holding the parka in inventory and transporting it to the outlet store costs L.L.Bean $10. Thus, L.L.Bean recovers a salvage value of s =$40 for each parka that is unsold at the end of the season. L.L.Bean makes a profit of p- c= $55 on each parka it sells and incurs a loss of c - s = $5 on each unsold parka that is sold at the outlet store. The buying committee must decide on anorder size and cycle service level that maximizes the profits from the sale of parkas at L.L.Bean. Example 2:

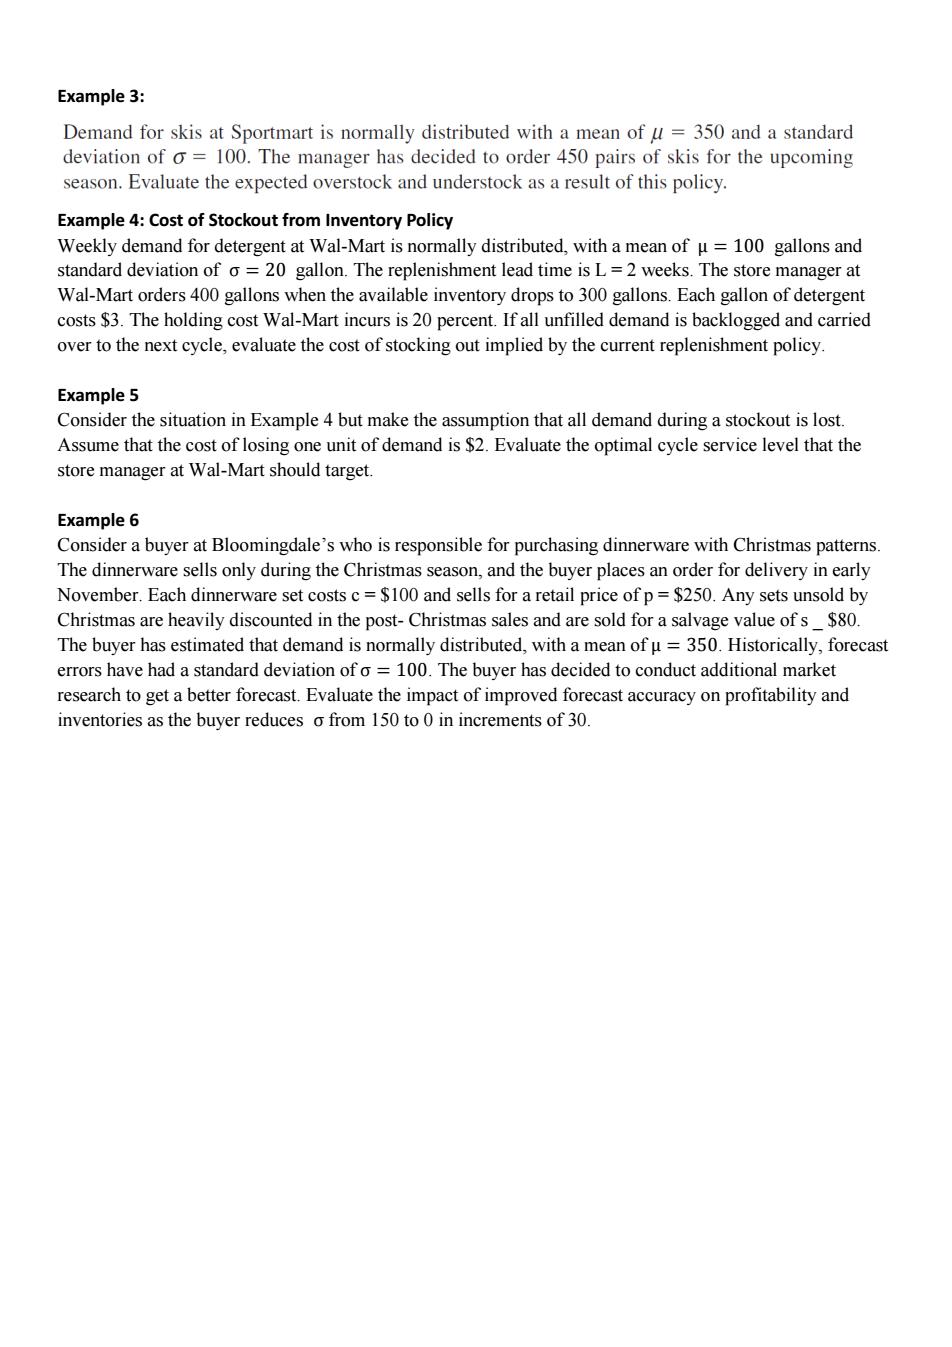
Example 3: Demand for skis at Sportmart is normally distributed with a mean of u=350 and a standard deviation of o=100.The manager has decided to order 450 pairs of skis for the upcoming season.Evaluate the expected overstock and understock as a result of this policy. Example 4:Cost of Stockout from Inventory Policy Weekly demand for detergent at Wal-Mart is normally distributed,with a mean of u=100 gallons and standard deviation of o=20 gallon.The replenishment lead time is L=2 weeks.The store manager at Wal-Mart orders 400 gallons when the available inventory drops to 300 gallons.Each gallon of detergent costs $3.The holding cost Wal-Mart incurs is 20 percent.If all unfilled demand is backlogged and carried over to the next cycle,evaluate the cost of stocking out implied by the current replenishment policy. Example 5 Consider the situation in Example 4 but make the assumption that all demand during a stockout is lost. Assume that the cost of losing one unit of demand is $2.Evaluate the optimal cycle service level that the store manager at Wal-Mart should target. Example 6 Consider a buyer at Bloomingdale's who is responsible for purchasing dinnerware with Christmas patterns The dinnerware sells only during the Christmas season,and the buyer places an order for delivery in early November.Each dinnerware set costs c=$100 and sells for a retail price ofp =$250.Any sets unsold by Christmas are heavily discounted in the post-Christmas sales and are sold for a salvage value of s $80. The buyer has estimated that demand is normally distributed,with a mean ofu =350.Historically,forecast errors have had a standard deviation of o =100.The buyer has decided to conduct additional market research to get a better forecast.Evaluate the impact of improved forecast accuracy on profitability and inventories as the buyer reduces o from 150 to 0 in increments of 30
Example 3: Example 4: Cost of Stockout from Inventory Policy Weekly demand for detergent at Wal-Mart is normally distributed, with a mean of μ = 100 gallons and standard deviation of σ = 20 gallon. The replenishment lead time is L = 2 weeks. The store manager at Wal-Mart orders 400 gallons when the available inventory drops to 300 gallons. Each gallon of detergent costs $3. The holding cost Wal-Mart incurs is 20 percent. If all unfilled demand is backlogged and carried over to the next cycle, evaluate the cost of stocking out implied by the current replenishment policy. Example 5 Consider the situation in Example 4 but make the assumption that all demand during a stockout is lost. Assume that the cost of losing one unit of demand is $2. Evaluate the optimal cycle service level that the store manager at Wal-Mart should target. Example 6 Consider a buyer at Bloomingdale’s who is responsible for purchasing dinnerware with Christmas patterns. The dinnerware sells only during the Christmas season, and the buyer places an order for delivery in early November. Each dinnerware set costs c = $100 and sells for a retail price of p = $250. Any sets unsold by Christmas are heavily discounted in the post- Christmas sales and are sold for a salvage value of s _ $80. The buyer has estimated that demand is normally distributed, with a mean of μ = 350. Historically, forecast errors have had a standard deviation of σ = 100. The buyer has decided to conduct additional market research to get a better forecast. Evaluate the impact of improved forecast accuracy on profitability and inventories as the buyer reduces σ from 150 to 0 in increments of 30