Homework 1 solution: Question 1:skip Question 2: (a)The two supply network designs that the distributor can propose to counter the manufacturer's proposal are the distributor storage with package carrier delivery and the distributor storage with last mile delivery.Both of these counter-proposals offer higher order visibility for the customer while having simpler information infrastructure than with manufacturer storage.The response time for both is excellent,and the customer experience is also superior to the direct model.If the manufacturer is trying to provide excellent customer service,the increased costs in transportation and potentially higher levels of inventory may be acceptable tradeoffs (b)Amazon's greatest e-business advantage comes from book sales;they are able to list millions of book titles that a physical store cannot possibly carry on their shelves.Cost advantages for Amazon are few and far between;the item price to shipping cost ratio for books,music,and software is not as high as most consumers would prefer.Amazon certainly has no cost advantage with music and software.Both are readily sold over the Internet;it would behoove Amazon to partner with another Seattle-area company to make this the norm.Electronics, hardware,and even toys are products that most consumers would like to experience before making a selection.Any cost advantage Amazon might have in these sectors may be overshadowed by an inability to hold the item on-line. Question 3: (a) Starting from the basic models in(a),we will build more advanced models in the subsequent parts of this question.Prior to merger,Sleekfon and Sturdyfon operate independently,and so we need to build separate models for each of them. Optimization model for Sleekfon: n 3:Sleekfon production facilities. m 7:number of regional markets. Dj Annual market size of regional market j Ki maximum possible capacity of production facility i cy Variable cost of producing,transporting and duty from facility i to market j Annual fixed cost of facility i Number of units from facility i to regional market j. It should be integral and non-negative
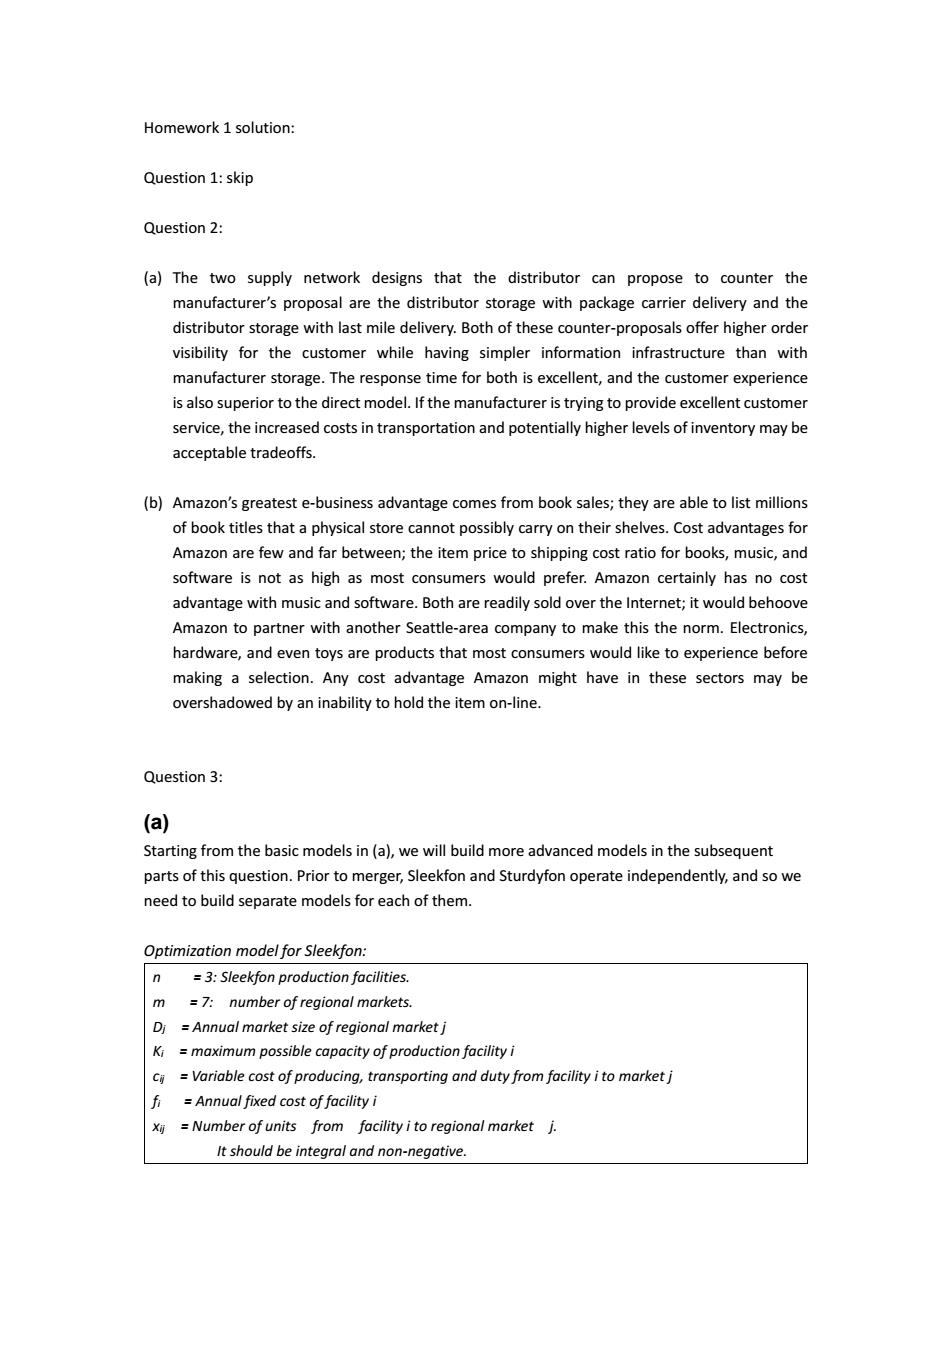
Homework 1 solution: Question 1: skip Question 2: (a) The two supply network designs that the distributor can propose to counter the manufacturer’s proposal are the distributor storage with package carrier delivery and the distributor storage with last mile delivery. Both of these counter-proposals offer higher order visibility for the customer while having simpler information infrastructure than with manufacturer storage. The response time for both is excellent, and the customer experience is also superior to the direct model. If the manufacturer is trying to provide excellent customer service, the increased costs in transportation and potentially higher levels of inventory may be acceptable tradeoffs. (b) Amazon’s greatest e-business advantage comes from book sales; they are able to list millions of book titles that a physical store cannot possibly carry on their shelves. Cost advantages for Amazon are few and far between; the item price to shipping cost ratio for books, music, and software is not as high as most consumers would prefer. Amazon certainly has no cost advantage with music and software. Both are readily sold over the Internet; it would behoove Amazon to partner with another Seattle-area company to make this the norm. Electronics, hardware, and even toys are products that most consumers would like to experience before making a selection. Any cost advantage Amazon might have in these sectors may be overshadowed by an inability to hold the item on-line. Question 3: (a) Starting from the basic models in (a), we will build more advanced models in the subsequent parts of this question. Prior to merger, Sleekfon and Sturdyfon operate independently, and so we need to build separate models for each of them. Optimization model for Sleekfon: n = 3: Sleekfon production facilities. m = 7: number of regional markets. Dj = Annual market size of regional market j Ki = maximum possible capacity of production facility i cij = Variable cost of producing, transporting and duty from facility i to market j fi = Annual fixed cost of facility i xij = Number of units from facility i to regional market j. It should be integral and non-negative
Min 21+22 i=l i=l i=l Subject to x=D,forj =1....m (5.1) xk,for 1=1.m (5.2) Please note that we need to calculate the variable cost cy before we plug it into the optimization model.Variable cost cyj is calculated as follows: cj=production cost per unit at facility i transportation cost per unit from facility i to market j+ duty*(production cost per unit at facility i+transportation cost per unit from facility i to market j fixed cost per unit of capacity) SYMBOL INPUT CELL D Annual market size of regional market j B4:H4 K maximum possible capacity of production facility i C12:C14 Ci Variable cost of producing,transporting and duty from facility i to market j B22:H28 Annual fixed cost of facility i 币 D12:D17 Number of units from facility i to regional market j. C43:l45 obj. objective function D48 5.1 demand constraints J43J45 5.2 capacity constraints C46:l46 (Sheet sleekfon in workbook problem5.4) The above model gives optimal result as in following table: N. Europe Europe Japan Rest of Africa Capacity Quantity Shipped America America (EU) (Non EU) Asia/Australia Europe (EU) 0.00 0.00 20.00 0.00 0.00 0.00 0.00 0.00 Sleekfon America 10.00 0.00 0.00 3.00 2.00 2.00 0.00 3.00 不 America 0.00 4.00 0.00 0.00 0.00 0.00 1.00 5.00 Demand 0.00 0.00 0.00 0.00 0.00 0.00 0.00 Total Cost for Sleekfon S564.39 And we use the same model but with data from Sturdyfon to get following optimal production and distribution plan for Sturdyfon:
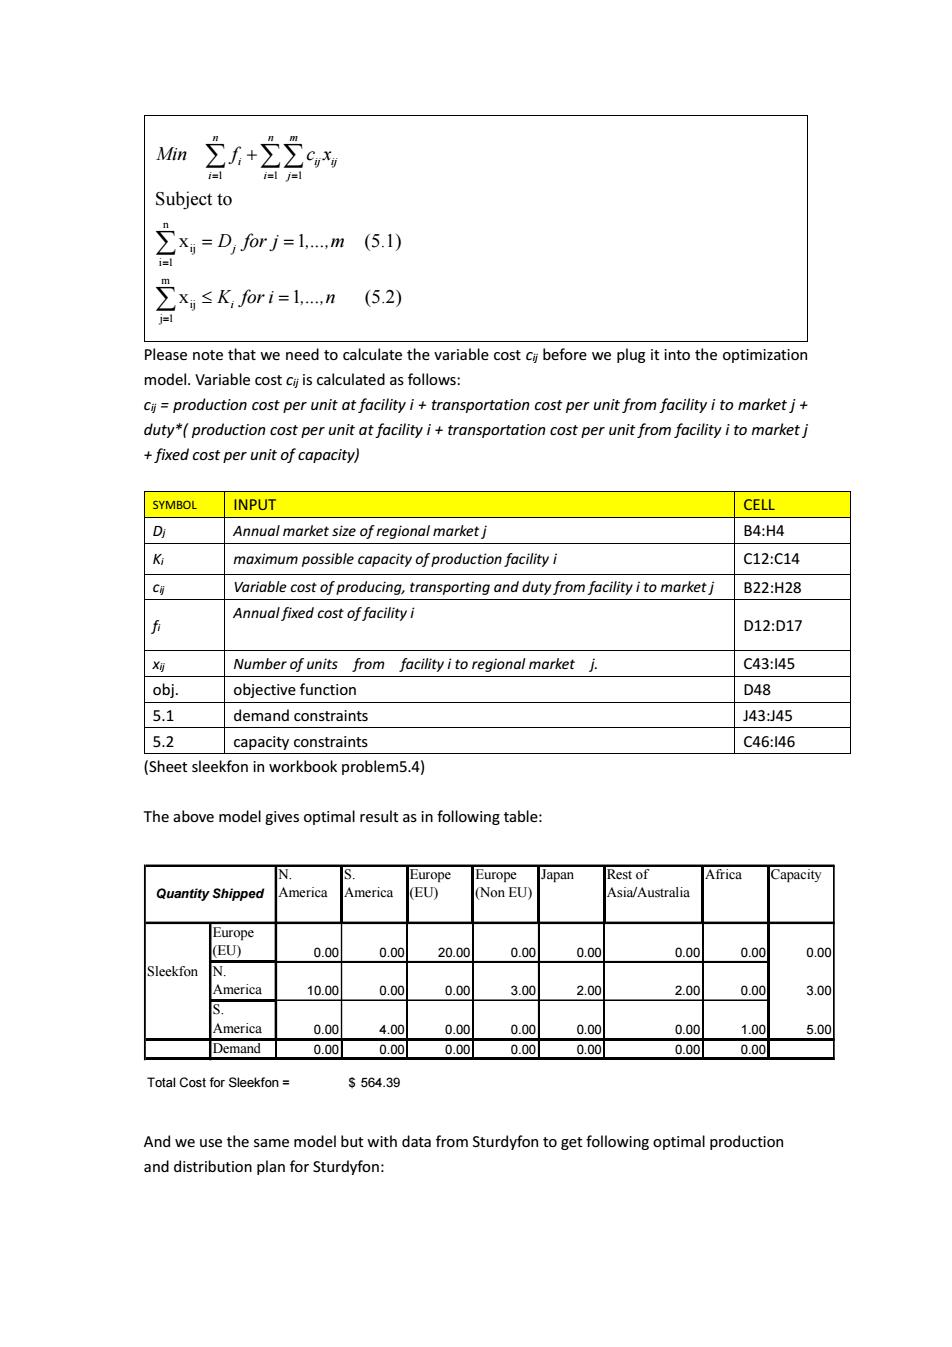
1 1 1 n ij i 1 m ij j 1 Subject to x 1 (5.1) x 1 (5.2) n n m i ij ij i i j j i Min f c x D for j ,...,m K for i ,...,n Please note that we need to calculate the variable cost cij before we plug it into the optimization model. Variable cost cij is calculated as follows: cij = production cost per unit at facility i + transportation cost per unit from facility i to market j + duty*( production cost per unit at facility i + transportation cost per unit from facility i to market j + fixed cost per unit of capacity) SYMBOL INPUT CELL Dj Annual market size of regional market j B4:H4 Ki maximum possible capacity of production facility i C12:C14 cij Variable cost of producing, transporting and duty from facility i to market j B22:H28 fi Annual fixed cost of facility i D12:D17 xij Number of units from facility i to regional market j. C43:I45 obj. objective function D48 5.1 demand constraints J43:J45 5.2 capacity constraints C46:I46 (Sheet sleekfon in workbook problem5.4) The above model gives optimal result as in following table: And we use the same model but with data from Sturdyfon to get following optimal production and distribution plan for Sturdyfon: N. America S. America Europe (EU) Europe (Non EU) Japan Rest of Asia/Australia Africa Capacity Europe (EU) 0.00 0.00 20.00 0.00 0.00 0.00 0.00 0.00 Sleekfon N. America 10.00 0.00 0.00 3.00 2.00 2.00 0.00 3.00 S. America 0.00 4.00 0.00 0.00 0.00 0.00 1.00 5.00 Demand 0.00 0.00 0.00 0.00 0.00 0.00 0.00 Total Cost for Sleekfon = $ 564.39 Quantity Shipped
N Europe Europe Japan Rest of Africa Capacity Quantity Shipped America America EU) Non EU) Asia/Australia Europe EU) 0.00 0.00 4.00 8.00 0.00 0.00 1.00 7.00 Sturdyfon N. America 12.00 1.00 0.00 0.00 0.00 0.00 0.00 7.00 Rest of Asia 0.00 0.00 0.00 0.00 7.00 3.00 0.00 0.00 Demand ⊙ Total cost for Sturdyfon 512.68 (b) Under conditions of no plant shutdowns,the previous model is still applicable.However,we need to increase the number of facilities to 6,i.e.,3 from Sleekfon and 3 from Sturdyfon.And the market demand at a region needs revised by combining the demands from the two companies. Decision maker has more facilities and greater market share in each region,and hence has more choices for production and distribution plans.The optimal result is summarized in the following table. N s. Europe Europe Japan Rest of Africa Capacity America America EU) (Non EU) Asia/Australia Europe (EU) 0.00 0.00 4.00 11.00 0.00 0.00 2.00 3.00 Sleekfon N. America 16.00 0.00 0.00 0.00 4.00 0.00 0.00 0.00 America 0.00 5.00 0.00 0.00 0.00 0.00 0.00 5.00 Europe (EU) 0.00 0.00 20.00 0.00 0.00 0.00 0.00 0.00 Sturdyfon N. America 6.00 0.00 0.00 0.00 0.00 0.00 0.00 14.00 Rest of Asia 0.00 0.00 0.00 0.00 5.00 5.00 0.00 0.00 Demand 0.00 0.00 0.00 0.00 0.00 0.00 0.00 Total Cost for Merged Network 1066.82 (c) This model is more advanced since it allows facilities to be scaled down or shutdown. Accordingly we need more variables to reflect this new complexity. Optimization model for Sleekfon: n =6:Sleekfon and Sturdyfon production facilities. m =7:number of regional markets. Di Annual market size of regional market j,sum of the Sleekfon and Sturdyfon market share
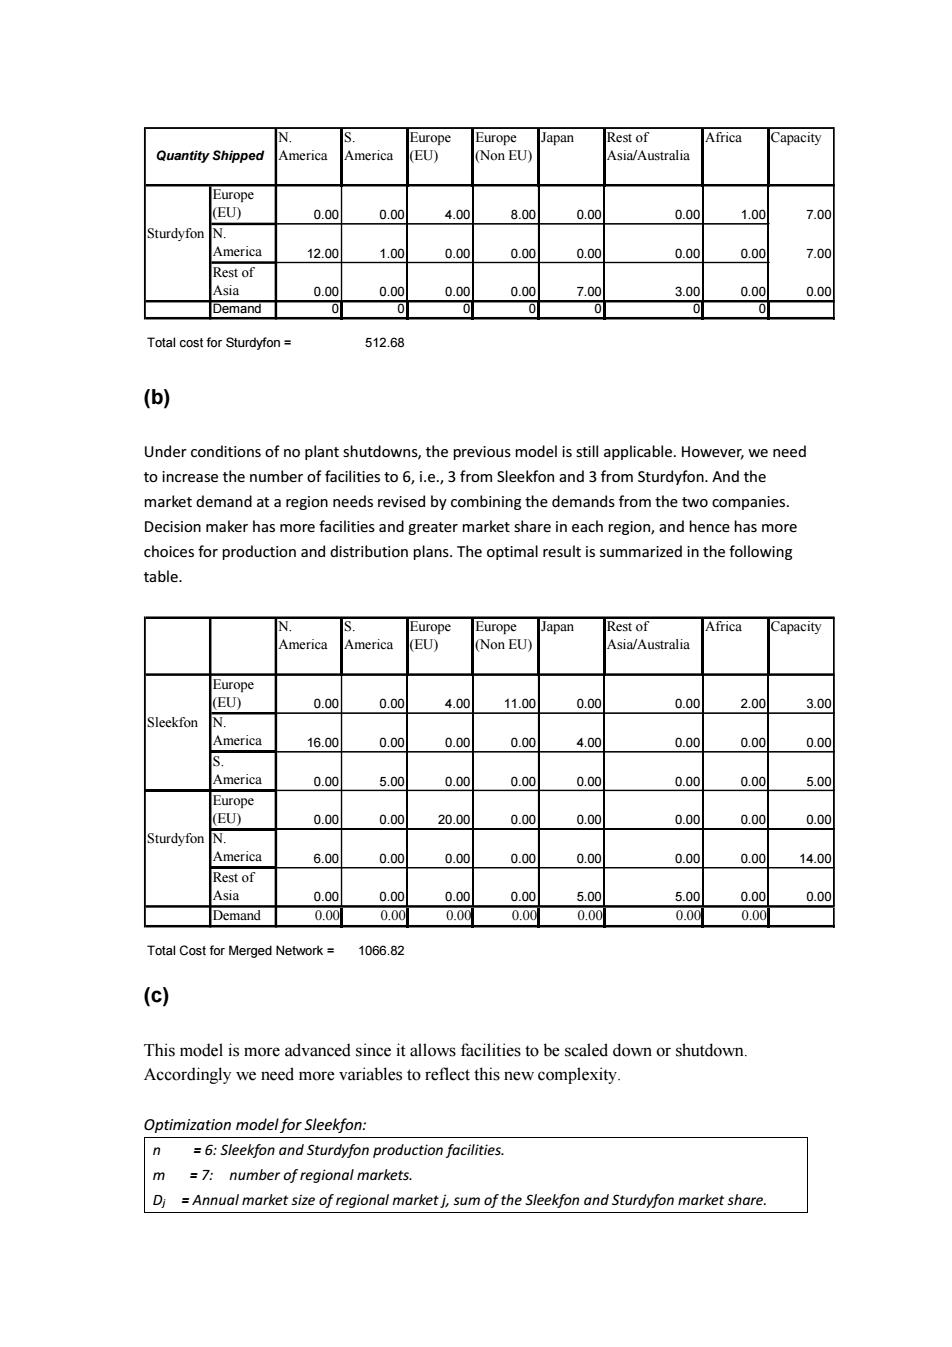
(b) Under conditions of no plant shutdowns, the previous model is still applicable. However, we need to increase the number of facilities to 6, i.e., 3 from Sleekfon and 3 from Sturdyfon. And the market demand at a region needs revised by combining the demands from the two companies. Decision maker has more facilities and greater market share in each region, and hence has more choices for production and distribution plans. The optimal result is summarized in the following table. (c) This model is more advanced since it allows facilities to be scaled down or shutdown. Accordingly we need more variables to reflect this new complexity. Optimization model for Sleekfon: n = 6: Sleekfon and Sturdyfon production facilities. m = 7: number of regional markets. Dj = Annual market size of regional market j, sum of the Sleekfon and Sturdyfon market share. N. America S. America Europe (EU) Europe (Non EU) Japan Rest of Asia/Australia Africa Capacity Europe (EU) 0.00 0.00 4.00 8.00 0.00 0.00 1.00 7.00 Sturdyfon N. America 12.00 1.00 0.00 0.00 0.00 0.00 0.00 7.00 Rest of Asia 0.00 0.00 0.00 0.00 7.00 3.00 0.00 0.00 Demand 0 0 0 0 0 0 0 Total cost for Sturdyfon = 512.68 Quantity Shipped N. America S. America Europe (EU) Europe (Non EU) Japan Rest of Asia/Australia Africa Capacity Europe (EU) 0.00 0.00 4.00 11.00 0.00 0.00 2.00 3.00 Sleekfon N. America 16.00 0.00 0.00 0.00 4.00 0.00 0.00 0.00 S. America 0.00 5.00 0.00 0.00 0.00 0.00 0.00 5.00 Europe (EU) 0.00 0.00 20.00 0.00 0.00 0.00 0.00 0.00 Sturdyfon N. America 6.00 0.00 0.00 0.00 0.00 0.00 0.00 14.00 Rest of Asia 0.00 0.00 0.00 0.00 5.00 5.00 0.00 0.00 Demand 0.00 0.00 0.00 0.00 0.00 0.00 0.00 Total Cost for Merged Network = 1066.82
Ki =capacity of production facility i Li =capacity of production facility if it is scaled back ci=Variable cost of producing,transporting and duty from facility i to market j fi=Annual fixed cost of facility i gi =Annual fixed cost of facility i if it is scaled back hi Shutdown cost of facility i xij=Number of units from facility i to regional market j. It should be integral and non-negative. yi Binary variable indicating whether to scale back facility i.yi=1 means to scale it back,0 otherwise. Since two facilities,Sleekfon S America and Sturdyfon Rest of Asia,can not be scaled back, the index i doesn't include these two facilities. zi=Binary variable indicating whether to shutdown facility i.zi=1 means to shutdown it,0 otherwise. (1-yi-zi)would be the binary variable indicating whether the facility is unaffected. Min 2U0--)+gy+h=)+22c, Subject to 立,=D,rj=l,m (5.1) 2,≤K0-y-+Xari=ln (5.2) is 1-y-3,≥0fori=l,n (5.3) y,are binary for i=1,....n (5.4) Please note that we need to calculate the variable cost cy before we plug it into the optimization model.Variable cost ci is calculated as following: ci=production cost per unit at facility i+transportation cost per unit from facility i to market j+ duty*(production cost per unit at facility i+transportation cost per unit from facility i to market j fixed cost per unit of capacity) And we also need to prepare fixed cost data for the two new scenarios:shutdown and scale back. As explained in the problem description,fixed cost for a scaled back facility is 70%of the original one;and it costs 20%of the original annual fixed cost to shutdown it. Above model gives optimal solution as summarized in the following table.The lowest cost possible in this model is $988.93,much lower than the result we got in(b)$1066.82.As shown in the result,the Sleekfon N.America facility is shutdown,and the market is mainly served by Sturdyfon N.America facility.The N.America market share is 22,and there are 40 in terms of production capacity,hence it is wise to shutdown one facility whichever is more expensive
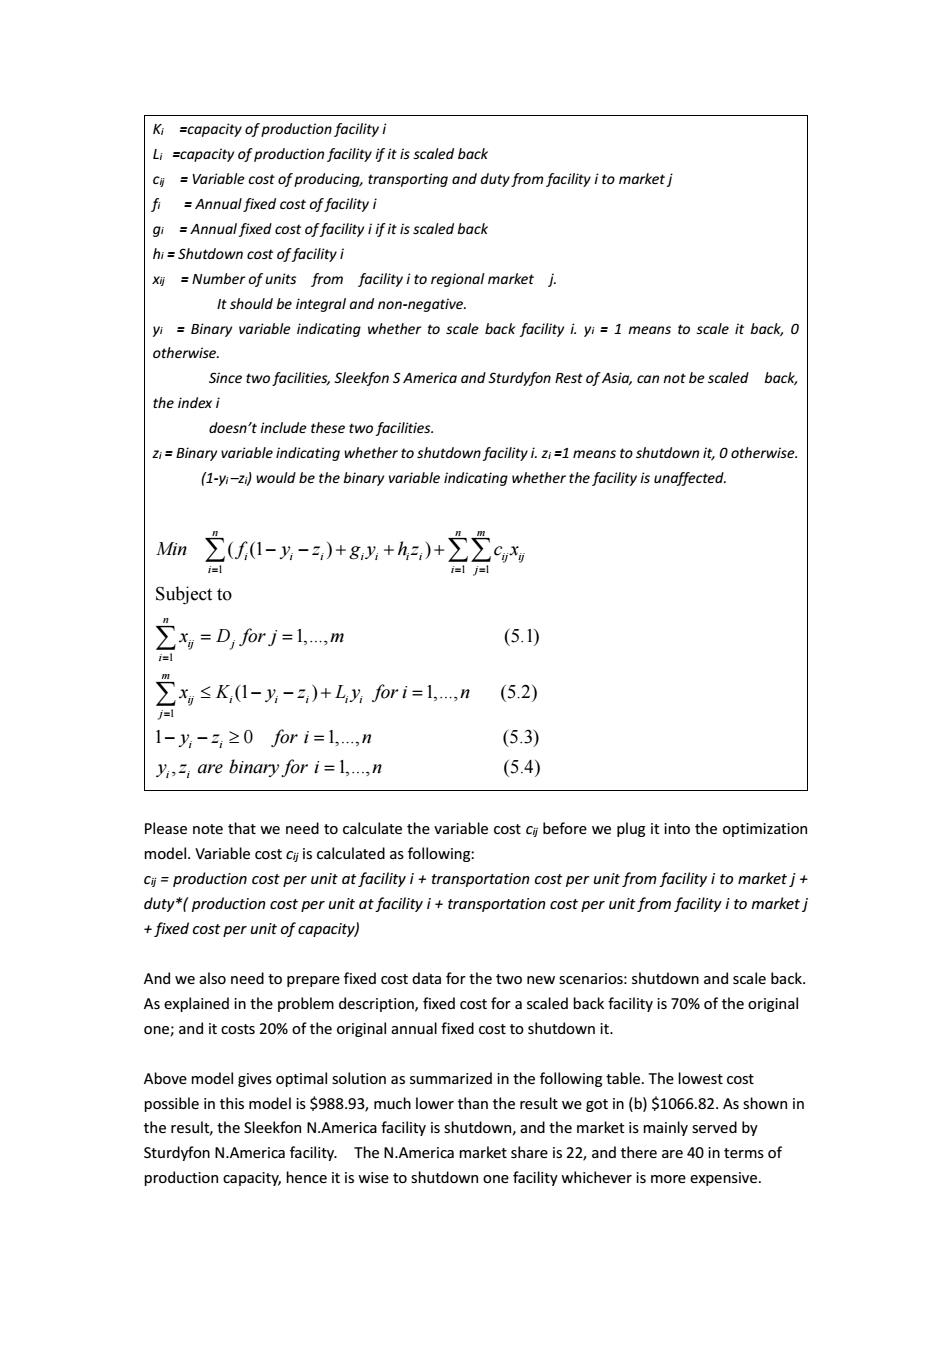
Ki =capacity of production facility i Li =capacity of production facility if it is scaled back cij = Variable cost of producing, transporting and duty from facility i to market j fi = Annual fixed cost of facility i gi = Annual fixed cost of facility i if it is scaled back hi = Shutdown cost of facility i xij = Number of units from facility i to regional market j. It should be integral and non-negative. yi = Binary variable indicating whether to scale back facility i. yi = 1 means to scale it back, 0 otherwise. Since two facilities, Sleekfon S America and Sturdyfon Rest of Asia, can not be scaled back, the index i doesn’t include these two facilities. zi = Binary variable indicating whether to shutdown facility i. zi =1 means to shutdown it, 0 otherwise. (1-yi –zi) would be the binary variable indicating whether the facility is unaffected. 1 1 1 1 1 ( (1 ) ) Subject to 1,..., (5.1) (1 ) 1,..., (5.2) 1 0 1,..., n n m i i i i i i i ij ij i i j n ij j i m ij i i i i i j i i Min f y z g y h z c x x D for j m x K y z L y for i n y z for i n (5.3) , 1,..., (5.4) i i y z are binary for i n Please note that we need to calculate the variable cost cij before we plug it into the optimization model. Variable cost cij is calculated as following: cij = production cost per unit at facility i + transportation cost per unit from facility i to market j + duty*( production cost per unit at facility i + transportation cost per unit from facility i to market j + fixed cost per unit of capacity) And we also need to prepare fixed cost data for the two new scenarios: shutdown and scale back. As explained in the problem description, fixed cost for a scaled back facility is 70% of the original one; and it costs 20% of the original annual fixed cost to shutdown it. Above model gives optimal solution as summarized in the following table. The lowest cost possible in this model is $988.93, much lower than the result we got in (b) $1066.82. As shown in the result, the Sleekfon N.America facility is shutdown, and the market is mainly served by Sturdyfon N.America facility. The N.America market share is 22, and there are 40 in terms of production capacity, hence it is wise to shutdown one facility whichever is more expensive
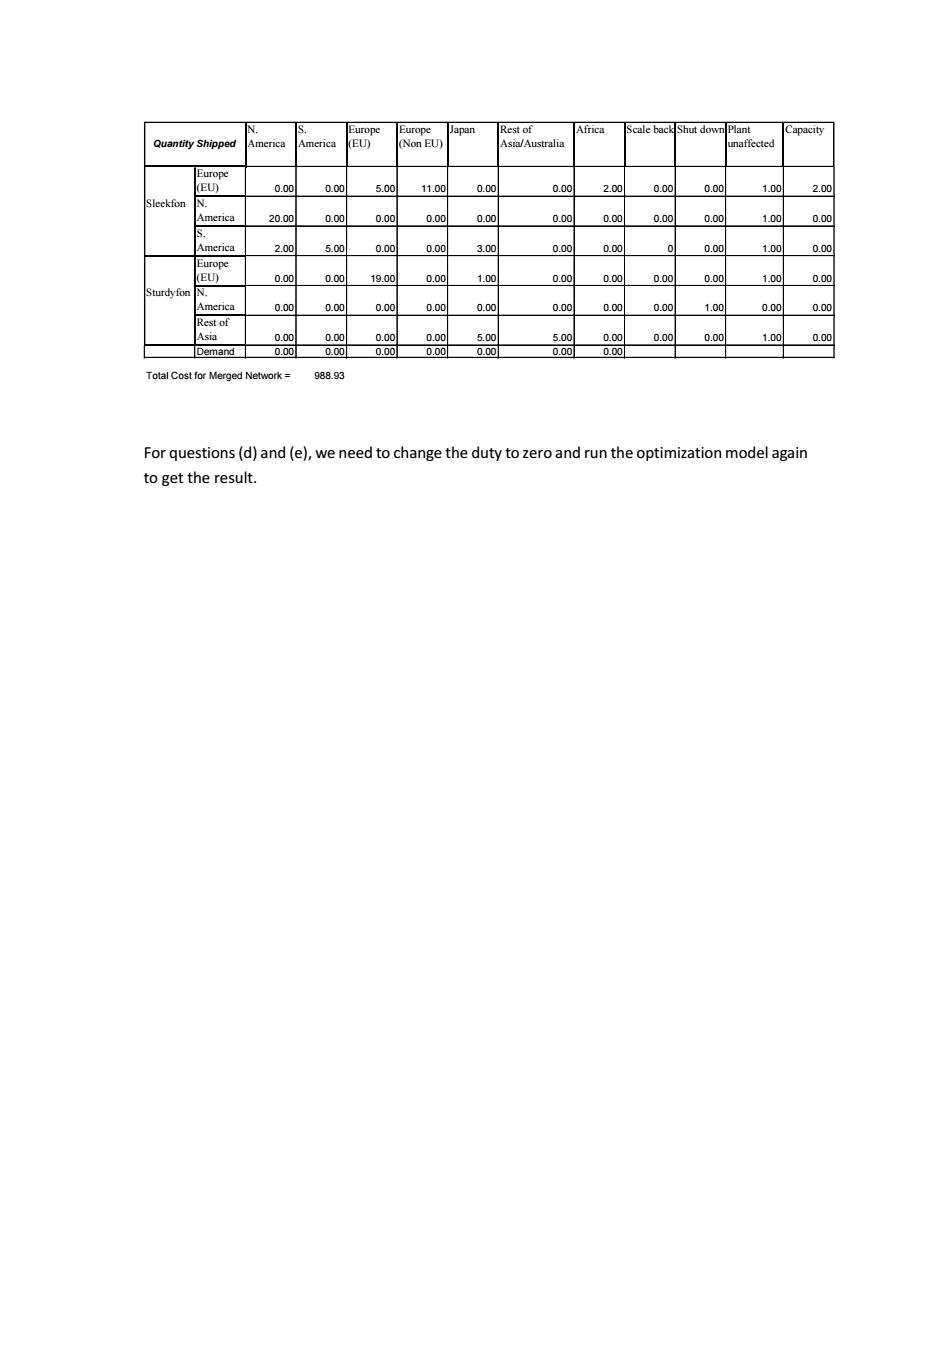
N Europe Europe Japan Rest of Africa Scale back Shut down Plant Capacity Quantity Shipped (EU) Non EU) Asia/Australia naffected Europe (EU) 0.00 0.00 5.00 11.00 0.00 0.00 2.00 0.00 0.00 1.00 2.00 Sleekfon IN. Amenca 20.00 0.00 0.00 0.00 0.00 0.00 0.00 0.00 0.00 100 0.00 S. America 2.00 5.00 0.00 0.00 3.00 0.00 0.00 0.00 1.00 0.00 Europe (EU) 0.00 0.00 19.00 0.00 1.00 0.00 0.00 0.00 0.00 1.00 a.00 Stur中yfon IN. America 0.00 0.00 0.00 0.00 0.00 0.00 0.00 0.00 1.00 0.00 0.00 Rest of Asia 0.00 0.00 0.00 0.00 5.00 5.00 0.00 0.00 0.00 1.00 0.00 Demand 0.00 0.00 0.00 0.00 0.00 0.00 0.00 Total Cost for Merged Network= 988.93 For questions(d)and(e),we need to change the duty to zero and run the optimization model again to get the result
For questions (d) and (e), we need to change the duty to zero and run the optimization model again to get the result. N. America S. America Europe (EU) Europe (Non EU) Japan Rest of Asia/Australia Africa Scale back Shut down Plant unaffected Capacity Europe (EU) 0.00 0.00 5.00 11.00 0.00 0.00 2.00 0.00 0.00 1.00 2.00 Sleekfon N. America 20.00 0.00 0.00 0.00 0.00 0.00 0.00 0.00 0.00 1.00 0.00 S. America 2.00 5.00 0.00 0.00 3.00 0.00 0.00 0 0.00 1.00 0.00 Europe (EU) 0.00 0.00 19.00 0.00 1.00 0.00 0.00 0.00 0.00 1.00 0.00 Sturdyfon N. America 0.00 0.00 0.00 0.00 0.00 0.00 0.00 0.00 1.00 0.00 0.00 Rest of Asia 0.00 0.00 0.00 0.00 5.00 5.00 0.00 0.00 0.00 1.00 0.00 Demand 0.00 0.00 0.00 0.00 0.00 0.00 0.00 Total Cost for Merged Network = 988.93 Quantity Shipped