Thermal Conductivity Measurement of Good Thermal Conductors Copper and Aluminum Dynamic measurement of thermal conductivity has several well-known methods.In the current experiment we use the thermal wave method.Unlike steady-state method,the temperature distribution on the object does not remain invariant when heat is transmitted in the sample in the thermal wave method.Given appropriate boundary conditions,the temperature on the object can change harmonically as a function of time,which can be used to calculate the object thermal conductivity. Experimental Objectives 1.Understand the characteristics and the advantages of dynamic method. 2.Get some knowledge of heat wave,strengthen the understanding of the wave theory. 3.Master one method of measuring thermal conductivity. Experimental Principle We are interested in heat transfer in one-dimension,so objects are made into rod shape and insulated in the perimeter.The schematic is shown in Fig.1. X+dx 图1 According to heat transfer law,the heat flow rate Q across any area a which is normal to the heat transfer direction is Q=-kAdT (1) d where K is the thermal conductivity of the material, is the temperature gradientalong 4 the X direction.Take the differential on both sides ofeq.(1), d0=-K44 434 According to the law of conservation of energy,at any time,any element of the rod satisfies the heat balance equation: CpAdT-dQ--KA dt 434 (2) Where C and p are heat capacity and density of material respectively.From the above equation we can derive the heat flow equation as
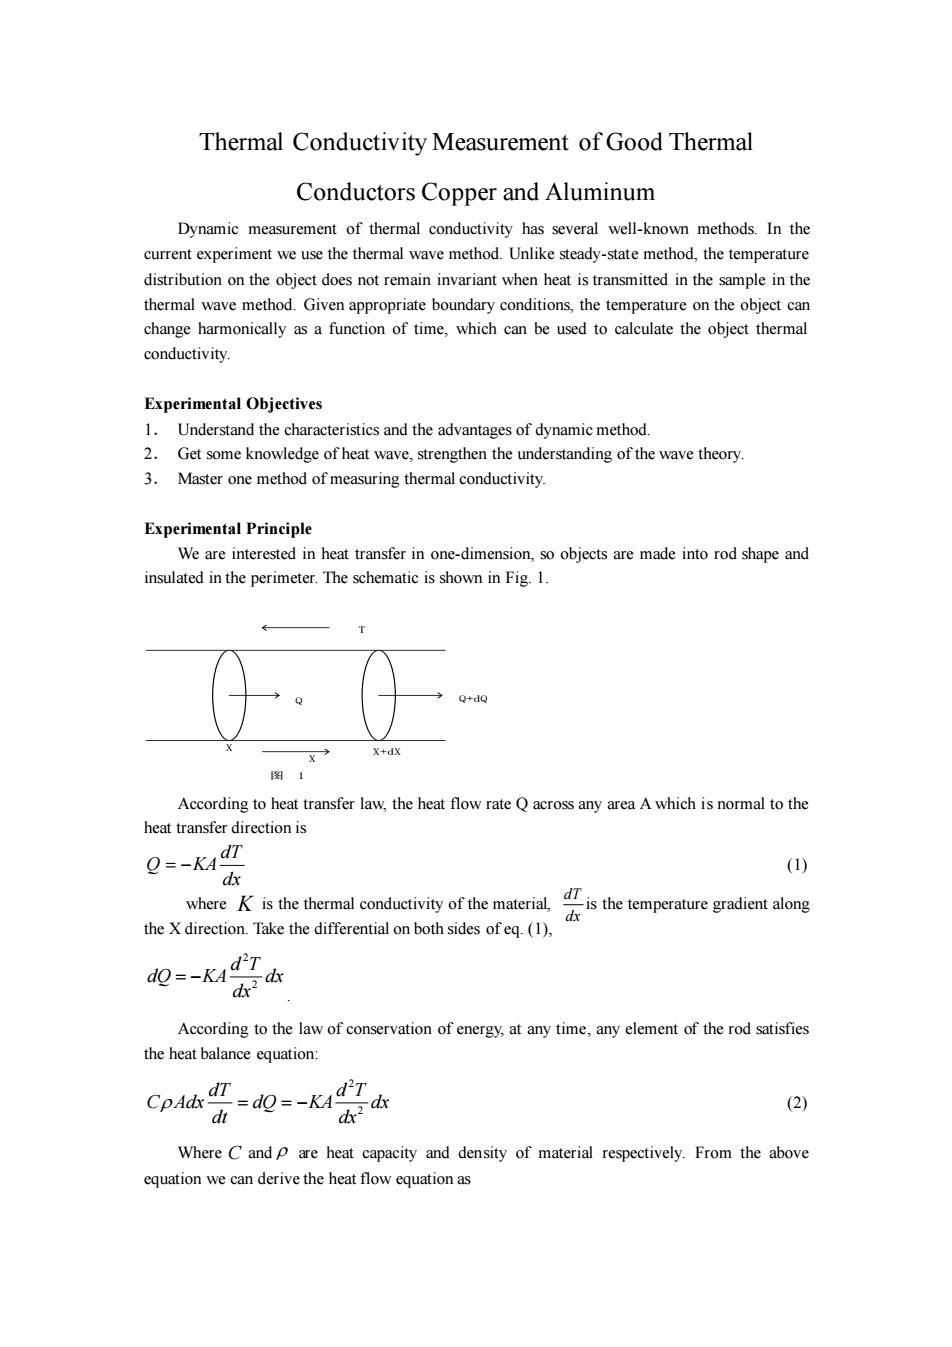
Thermal Conductivity Measurement of Good Thermal Conductors Copper and Aluminum Dynamic measurement of thermal conductivity has several well-known methods. In the current experiment we use the thermal wave method. Unlike steady-state method, the temperature distribution on the object does not remain invariant when heat is transmitted in the sample in the thermal wave method. Given appropriate boundary conditions, the temperature on the object can change harmonically as a function of time, which can be used to calculate the object thermal conductivity. Experimental Objectives 1. Understand the characteristics and the advantages of dynamic method. 2. Get some knowledge of heat wave, strengthen the understanding of the wave theory. 3. Master one method of measuring thermal conductivity. Experimental Principle We are interested in heat transfer in one-dimension, so objects are made into rod shape and insulated in the perimeter. The schematic is shown in Fig. 1. T Q Q+dQ X X X+dX 图 1 According to heat transfer law, the heat flow rate Q across any area A which is normal to the heat transfer direction is dT Q KA dx = − (1) where is the thermal conductivity of the material, is the temperature gradient along the X direction. Take the differential on both sides of eq. (1), 2 2 d T dQ KA dx dx = − . According to the law of conservation of energy, at any time, any element of the rod satisfies the heat balance equation: 2 2 dT d T C Adx dQ KA dx dt dx = = − (2) Where and are heat capacity and density of material respectively. From the above equation we can derive the heat flow equation as dT dx K C

D47 dT d42 (3) dt where D= Kis the thermal expansion cofficient. Cp The solution of(3)can yield the time evolution of the temperature distribution on the rod, given specific boundary conditions. If the change of temperature on the hot end is harmonic, T=To+T sin@t (4) and the other end is maintained at a constant low temperature T by cold water, the solution of(3)can be expressed as: T=To-ax+TeV'xsin(@t- 0 (5) where T is the DC component,a is the slope of the linear component.From above solution, we can reach several conclusions: (1)When the temperature of the hot end(x=0)varies harmonically,this variation will propagate towards the cold end as attenuated waves,known as the thermal wave or temperature wave. (2)The velocity of the thermal wave:V=2Do (6) 2D (3)The wavelength of the thermal wave:=2π, (7) Therefore,when the angular frequency o of the harmonic wave at the hot end is known,and the wave speed or wavelength can be measured,then D can be calculated using D= Thermal conductivity K of the material can also be calculated using Eq.(6)or(7).In the current experiment we use Eq.(6),then: P2=2K o and K=vCp=viceT (8) p 4πf4π where fand T are the frequency and period of the harmonic temperature variation at the hot end. From the above analysis,we know the key to the successful measurement of thermal conductivity are: (1)how to conduct the heat in one-dimension only; (2)how to achieve the harmonic temperature variation at the hot end; Experimental Apparatus 1.RB-1 dynamic thermal conductometer Working modes:"Manual"or "Program-controlled"; Heat source power:500W x 2; Pulsing cycle:manual mode:180+1(Sec),program-controlled mode:any; Temperature range:10 C ~100 C;
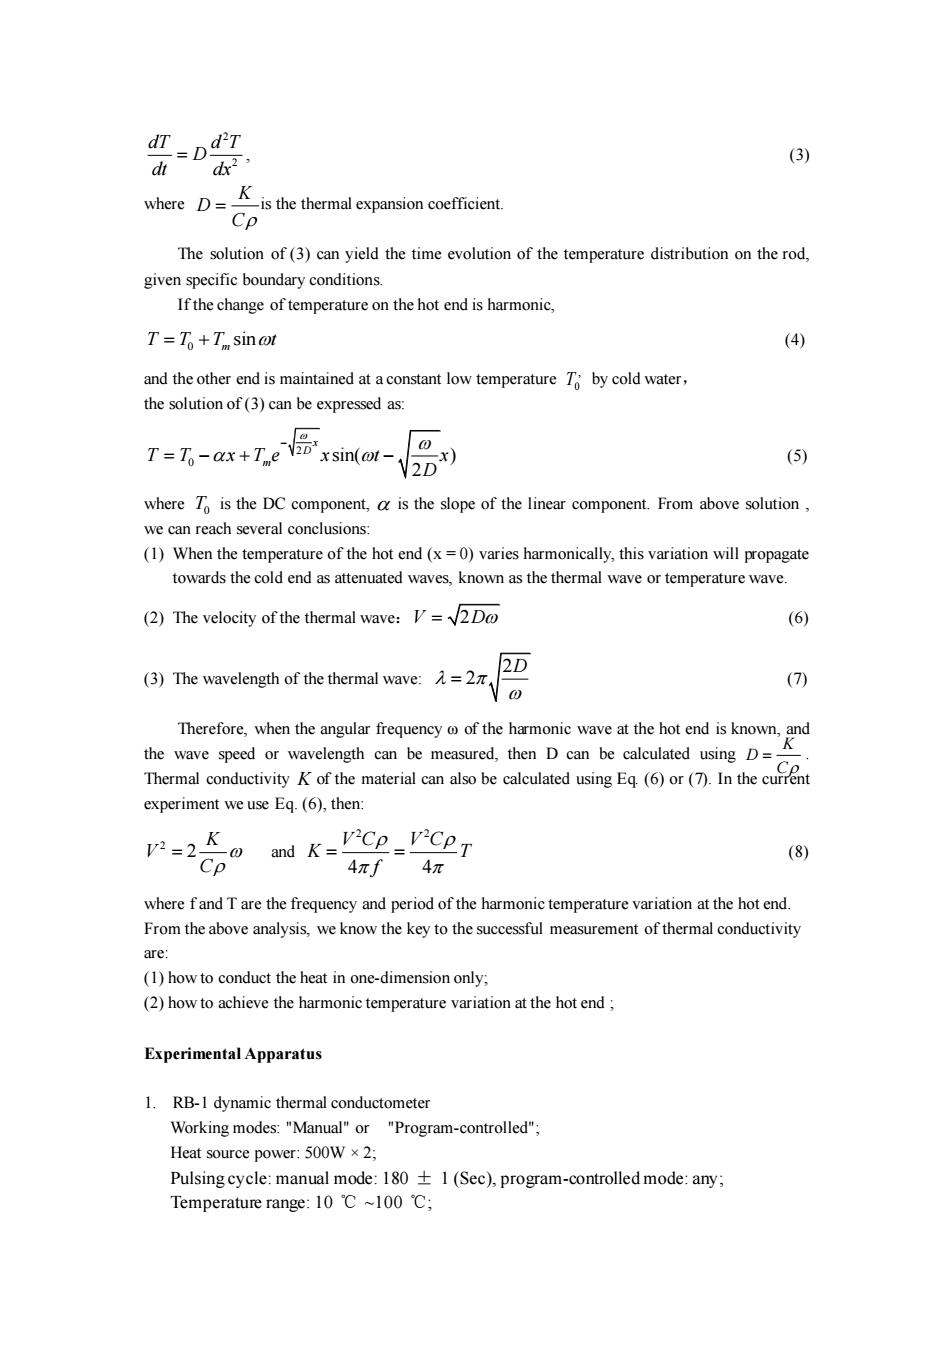
2 2 dT d T D dt dx = , (3) where is the thermal expansion coefficient. The solution of (3) can yield the time evolution of the temperature distribution on the rod, given specific boundary conditions. If the change of temperature on the hot end is harmonic, 0 sin T T T t = + m (4) and the other end is maintained at a constant low temperature by cold water, the solution of (3) can be expressed as: 2 0 sin( ) 2 x D T T x T e x t x m D − = − + − (5) where is the DC component, is the slope of the linear component. From above solution , we can reach several conclusions: (1) When the temperature of the hot end (x = 0) varies harmonically, this variation will propagate towards the cold end as attenuated waves, known as the thermal wave or temperature wave. (2) The velocity of the thermal wave:V D = 2 (6) (3) The wavelength of the thermal wave: 2 2 D = (7) Therefore, when the angular frequency ω of the harmonic wave at the hot end is known, and the wave speed or wavelength can be measured, then D can be calculated using . Thermal conductivity of the material can also be calculated using Eq. (6) or (7). In the current experiment we use Eq. (6), then: 2 2 K V C = and 2 2 4 4 V C V C K T f = = (8) where f and T are the frequency and period of the harmonic temperature variation at the hot end. From the above analysis, we know the key to the successful measurement of thermal conductivity are: (1) how to conduct the heat in one-dimension only; (2) how to achieve the harmonic temperature variation at the hot end ; Experimental Apparatus 1. RB-1 dynamic thermal conductometer Working modes: "Manual" or "Program-controlled"; Heat source power: 500W × 2; Pulsing cycle: manual mode: 180 ± 1 (Sec), program-controlled mode: any; Temperature range: 10 ℃ ~100 ℃; K D C = , T0 T0 K D C = K

Temperature resolution±0.5℃; 2.Microcomputer(better than P5,RAM>16M) Software environment:Windows98; Data format:standard text fommat; Display type:real-time dynamic display of the measurement; 3.The distribution and numbering of the measuring points on the sample From the hot end towards the cold end,along the axial direction,there is one thermocouple sensor every 20mm. The 12 sensors on the copper sample are numbered sequentially: 1,2,3,4,5,6,7,89,10,11,12 The 8 sensors on the aluminum sample are numbered sequentially:1,2,3,4,5,6,7,8 4.Relevant parameters The density of copper:8.9g/cm3 Density of aluminum:2.7g/cm3 Specific heat of copper:0.38J/g.K Specific heat of aluminum:0.90J/g.K Experimental Procedures l.Use the“Program-controlled”mode. 2.Measure six points of"copper"sample(2 to 7),5 points of aluminum sample(2 to 6);(copper first,then aluminum). 3.When the system is stable after 40~60 minutes,use the cursor to measure the relevant numbers on the curves,and save the curve graph; Data analysis Method one: Print out the T-t graph,as shown in Fig.2,and select any two curves to get the phase difference of two sine curves with the reference square wave AS=S-,,the distance AL,,and the length of each cycle S on the display.Then obtaint,=(AS/S)xT,where T is the cycle of the square wave.Assuming V is thermal wave speed in the sample,the time needed to travel the distance AL is t,=AL/V,so the speed isV=AL S/TAS,.The thermal conductivity can be obtained as K=AL2S2C p/4zTAS?using Eq.(8).The value of K can be obtained by taking the average of several measurements. Method two: Read directly on the display,and calculate the K of each group using K=CpT (n-n from Eq.(8). 4π(t-t,)
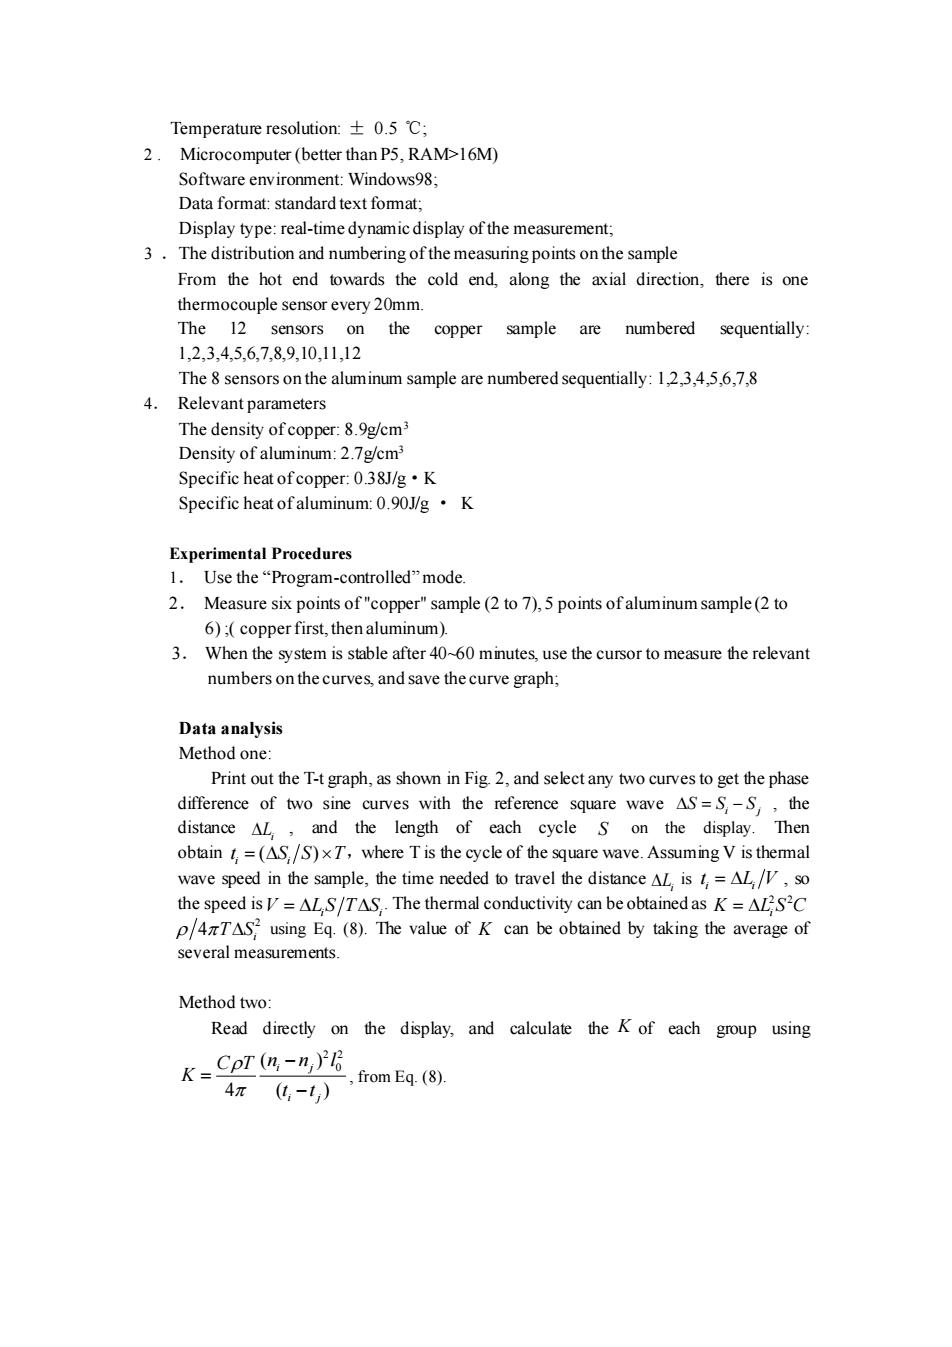
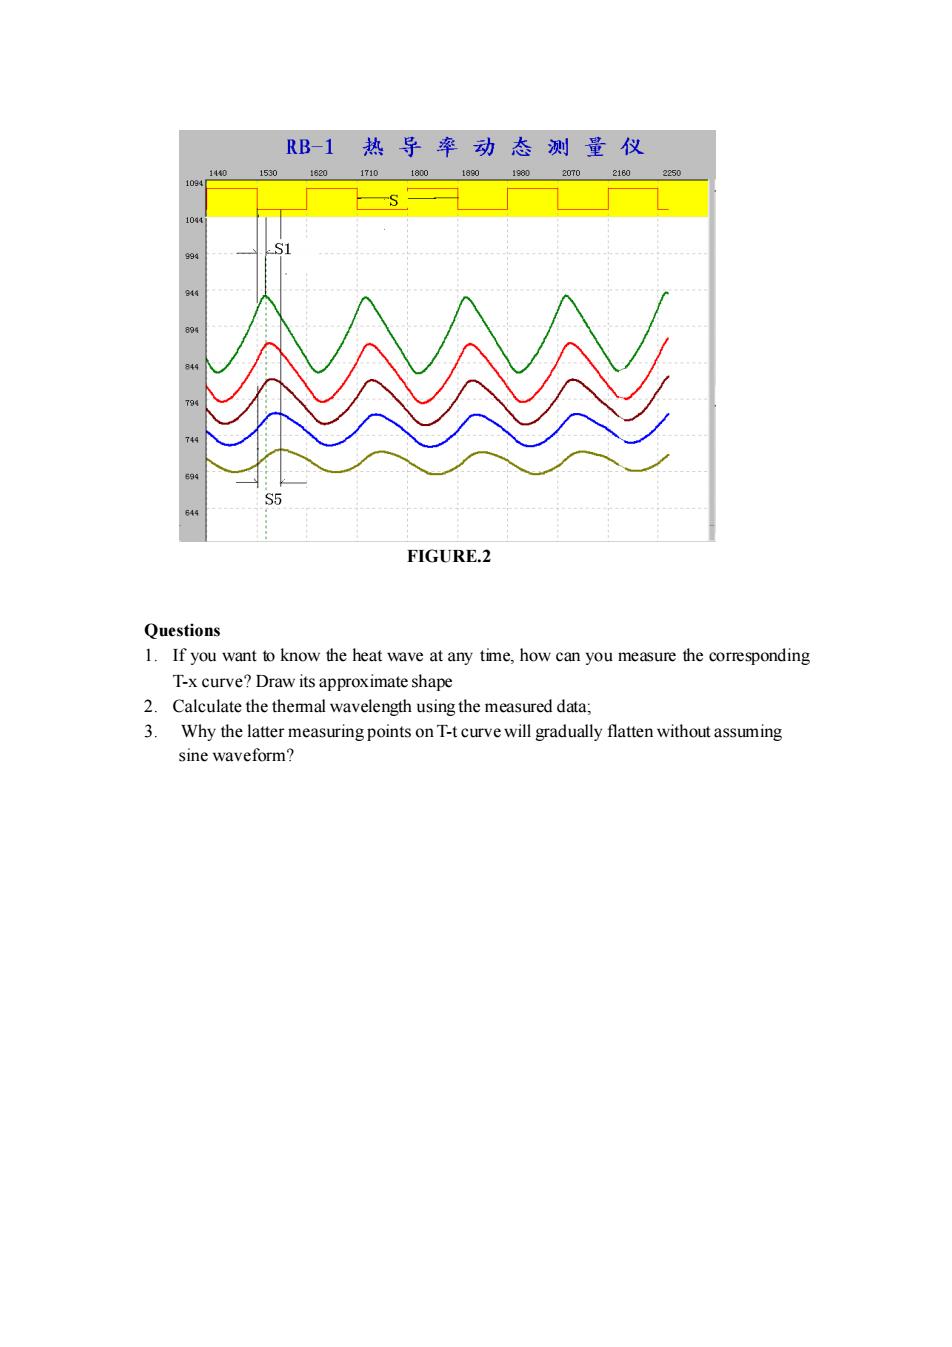
Temperature resolution: ± 0.5 ℃; 2 . Microcomputer (better than P5, RAM>16M) Software environment: Windows98; Data format: standard text format; Display type: real-time dynamic display of the measurement; 3 .The distribution and numbering of the measuring points on the sample From the hot end towards the cold end, along the axial direction, there is one thermocouple sensor every 20mm. The 12 sensors on the copper sample are numbered sequentially: 1,2,3,4,5,6,7,8,9,10,11,12 The 8 sensors on the aluminum sample are numbered sequentially: 1,2,3,4,5,6,7,8 4. Relevant parameters The density of copper: 8.9g/cm3 Density of aluminum: 2.7g/cm3 Specific heat of copper: 0.38J/g·K Specific heat of aluminum: 0.90J/g · K Experimental Procedures 1. Use the “Program-controlled” mode. 2. Measure six points of "copper" sample (2 to 7), 5 points of aluminum sample (2 to 6) ;( copperfirst, then aluminum). 3. When the system is stable after 40~60 minutes, use the cursor to measure the relevant numbers on the curves, and save the curve graph; Data analysis Method one: Print out the T-t graph, as shown in Fig. 2, and select any two curves to get the phase difference of two sine curves with the reference square wave , the distance , and the length of each cycle on the display. Then obtain ,where T is the cycle of the square wave. Assuming V is thermal wave speed in the sample, the time needed to travel the distance is , so the speed is . The thermal conductivity can be obtained as using Eq. (8). The value of can be obtained by taking the average of several measurements. Method two: Read directly on the display, and calculate the of each group using 2 2 0 ( ) 4 ( ) i j i j C T n n l K t t − = − , from Eq. (8). i j = − S S S Li S ( ) i i t S S T = Li i i t L V = V L S T S = i i 2 4 T S i 2 2 K L S C = i K K

RB-1热导率动态测量仪 1440 1530 1820 1710 1800 1880 168 2070 2180 2250 公会 S5 44 FIGURE.2 Questions 1.If you want to know the heat wave at any time,how can you measure the corresponding T-x curve?Draw its approximate shape 2.Calculate the themal wavelength using the measured data; 3.Why the latter measuring points on T-t curve will gradually flatten without assuming sine waveform?
FIGURE.2 Questions 1. If you want to know the heat wave at any time, how can you measure the corresponding T-x curve? Draw its approximate shape 2. Calculate the thermal wavelength using the measured data; 3. Why the latter measuring points on T-t curve will gradually flatten without assuming sine waveform?