UNCIL C Council of Graduate Schools GRADUATE SCHIOOLS Advocacy,Research,and Innovation Ph.D.Completion and Attrition: Analysis of Baseline Data Robert Sowell NSF Workshop A FRESH LOOK AT Ph.D.EDUCATION March 31,2008
Ph. D. Completion and Attrition: Analysis of Baseline Data Robert Sowell NSF Workshop A FRESH LOOK AT Ph.D. EDUCATION March 31, 2008

CGS Ph.D.Completion Project Quantitative Data Submitted by Institutions 12 Years(1992-93 through2003-04) Program completion Broad field demographic and attrition completion ·30 Institutions ·Gender(G) ·5 Broad Fields Citizenship/Ethnicity (CE) ·54 Disciplines ·24 Institutions(G) ·330 Programs ·23 Institutions(CE) ·~49,000 Students ·~40,000 Students(G) .~40,000 Students (CE) OUNCIL Council of Graduate Schools
CGS Ph.D. Completion Project Quantitative Data Submitted by Institutions 12 Years (1992-93 through 2003-04) Program completion and attrition • 30 Institutions • 5 Broad Fields • 54 Disciplines • 330 Programs • ~49,000 Students Broad field demographic completion • Gender (G) • Citizenship/Ethnicity (CE) • 24 Institutions (G) • 23 Institutions (CE) • ~40,000 Students (G) • ~ 40,000 Students (CE)
Ten-Year Completion and Attrition Analysis: For Students Entering Ph.D.Programs 1992-93 through 1994-95 (A Cohorts) Completion Program Data:Overall,broad field,discipline Gender Data:Broad field Citizenship/Ethnicity:Broad field Attrition Program Data:Overall,broad field COUNCIL C Council of Graduate Schools
Ten-Year Completion and Attrition Analysis: For Students Entering Ph.D. Programs 1992-93 through 1994-95 (A Cohorts) Completion • Program Data: Overall, broad field, discipline • Gender Data: Broad field • Citizenship/Ethnicity: Broad field Attrition • Program Data: Overall, broad field
Profile of Data (A-Cohorts)for Ten-Year Completion Analysis Program Data 12,135 Approximate distribution across fields Gender Data 9,683 17% 19% Citizenship& Ethnicity Data 9,359 □ Engineering 12% 21% ☐Life Sciences ☐Math&Physical Sci.. ☐Social Sciences 31% ■Humanities OUNCIL Council of Graduate Schools
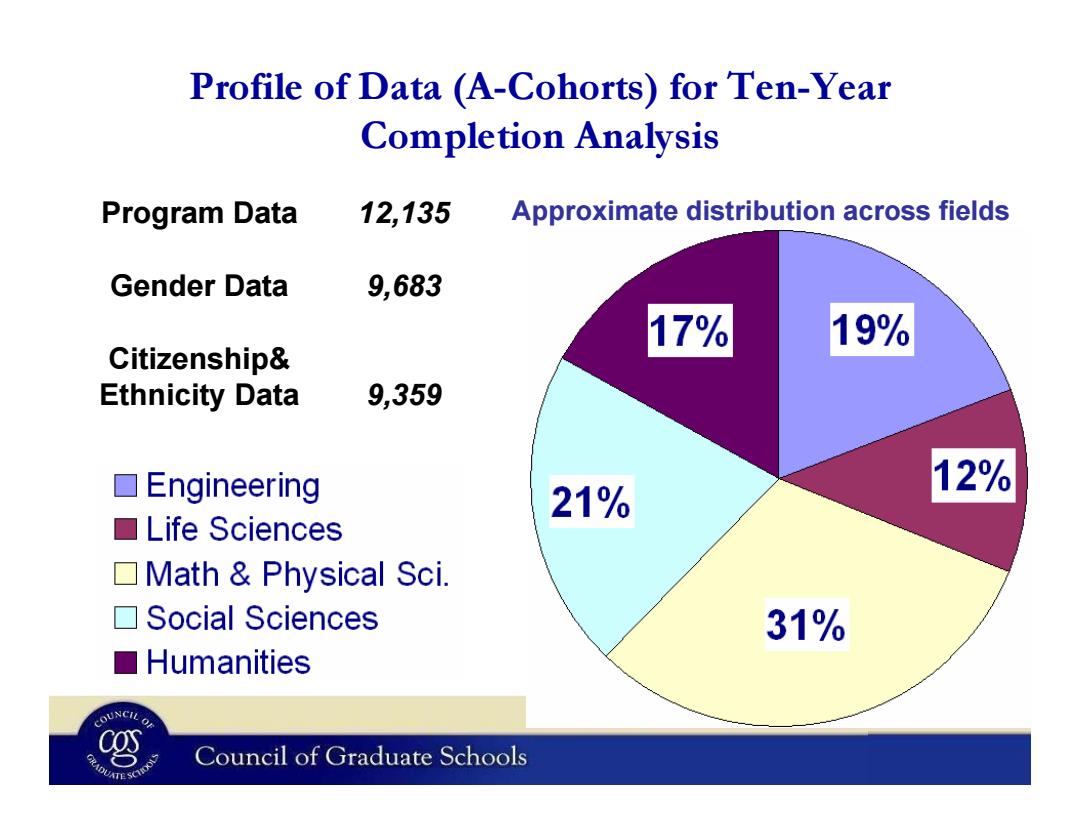
Profile of Data (A-Cohorts) for Ten-Year Completion Analysis Approximate distribution across fields 9,359 Citizenship& Ethnicity Data Gender Data 9,683 Program Data 12,135

Overall Ten-Year Completion Rates 品 57 55 51 46 导 36 23 8 11 5 3 4 5 6 8 9 10 Source:Council of Graduate Schools Completion and Attrition Program Data Council of Graduate Schools
Overall Ten-Year Completion Rates 5 11 23 36 46 51 55 57 0 20 40 60 Cumulative Completion Rate (%) 3 4 5 6 7 8 9 10 Source: Council of Graduate Schools Completion and Attrition Program Data
Ten-Year Cumulative Completion Rates by Broad Field 0下 57 54 34438565519 48 41 29 3 4 5 6 7 8 9 10 Year Engineering Life Sciences Mathematics Physical Sciences Social Sciences Humanities Council of Graduate Schools
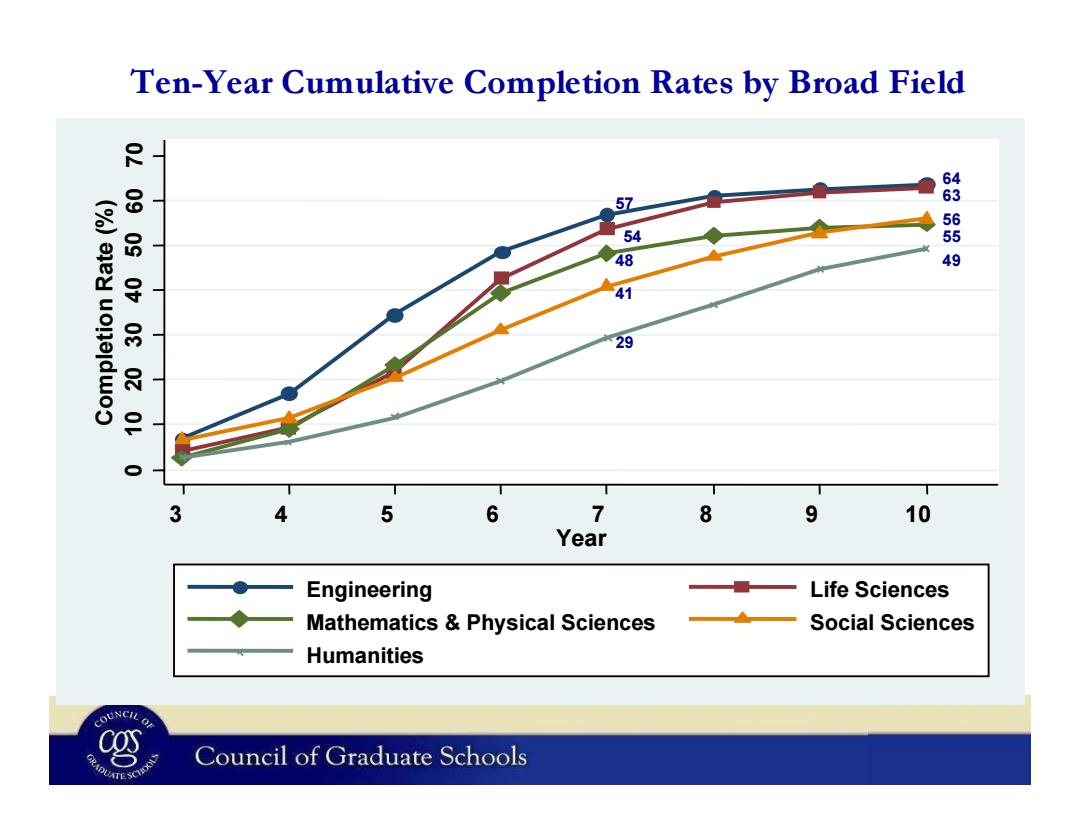
Ten-Year Cumulative Completion Rates by Broad Field 0 10 20 30 40 50 60 70 Completion Rate (%) 3 4 5 6 7 8 9 10 Year Engineering Life Sciences Mathematics & Physical Sciences Social Sciences Humanities 57 54 48 41 29 64 63 56 55 49

Ten-Year Completion Rates for Selected Disciplines Engineering 64% Mathematics and Physical Civil Engineering 78% Sciences 55% Mechanical Engineering 66% Chemistry 62% Chemical Engineering 63% Physics 59% Biomedical Engineering 63% Mathematics 51% Electrical Engineering 56% Computer Science 41% Life Science 63% Social Science 56% Genetics 69% Psychology 65% Microbiology/Immunology 69% Economics 52% Neuroscience 65% Anthropology 46% Molecular/Cell Biology 64% Sociology 45% Biology 59% Political Science 44% OUNCIL C Council of Graduate Schools
Ten-Year Completion Rates for Selected Disciplines Biology 59% Political Science 44% Molecular/Cell Biology 64% Sociology 45% Neuroscience 65% Anthropology 46% Microbiology/Immunology 69% Economics 52% Genetics 69% Psychology 65% Life Science 63% Social Science 56% Electrical Engineering 56% Computer Science 41% Biomedical Engineering 63% Mathematics 51% Chemical Engineering 63% Physics 59% Mechanical Engineering 66% Chemistry 62% Civil Engineering 78% Mathematics and Physical Sciences 55% Engineering 64%

Ten-Year Completion Rates:Broad Field and Gender 70 65 64 Female Male 60 59 57 (%ajey uoleld wo 56 56 53 52 52 50 47 40 Engineering Life Sciences Math Social Humanities Physical Sciences Sciences OUNCIL Council of Graduate Schools
Ten-Year Completion Rates: Broad Field and Gender 56 56 52 57 52 65 64 5 9 53 47 40 50 60 70 Engine e ring Life Scie nce s M ath & Physical Scie nce s Social Scie nce s Humanitie s C om pletion R ate (% ) Female Male
Annual Ph.D.Completion Rates by Gender in Mathematics Physical Sciences 3 5 6 7 8 9 10 Year Female Male Council of Graduate Schools
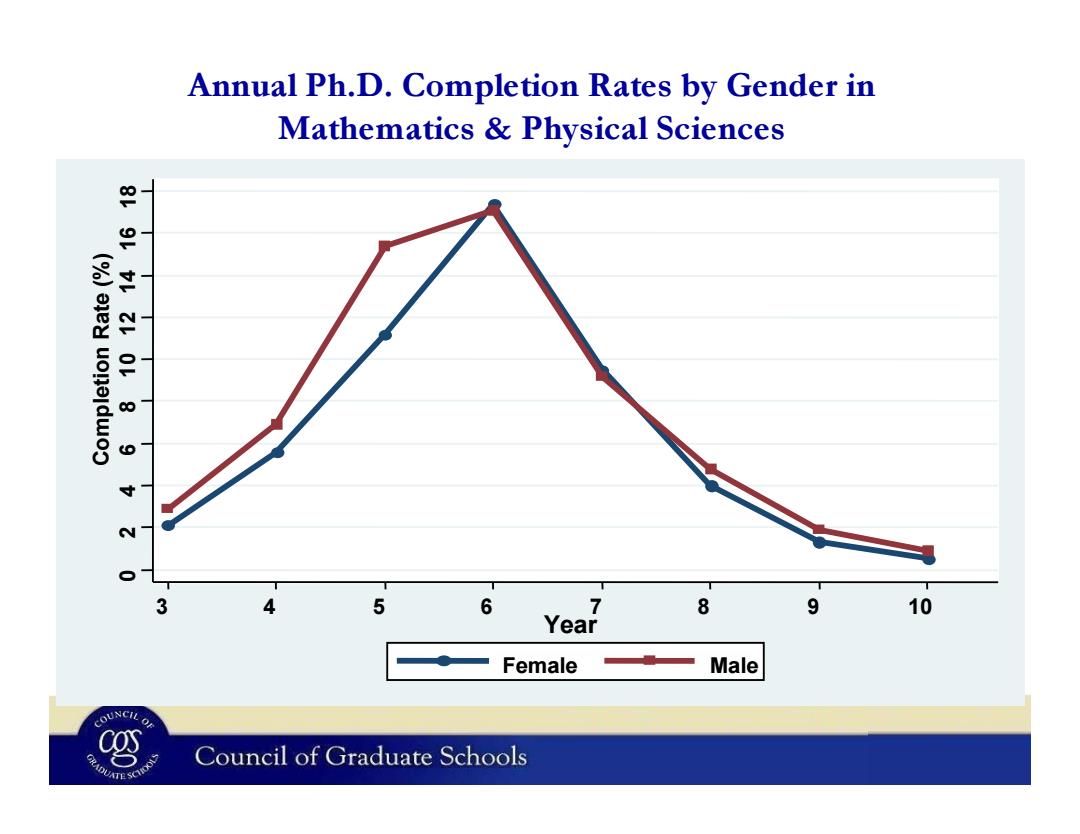
Annual Ph.D. Completion Rates by Gender in Mathematics & Physical Sciences 0 2 4 6 8 10 12 14 16 18 Completion Rate (%) 3 4 5 6 7 8 9 10 Year Female Male

Annual Ph.D.Completion Rates by Gender in Social Sciences g o 3 4 5 6 7 8 9 10 Year Female Male OUNCIL Council of Graduate Schools
Annual Ph.D. Completion Rates by Gender in Social Sciences 0 3 6 9 12 Completion Rate % 3 4 5 6 7 8 9 10 Year Female Male