Department for Work and Pensions Research Report No 607 A test for racial discrimination in recruitment practice in British cities Martin Wood,Jon Hales,Susan Purdon,Tanja Sejersen and Oliver Hayllar A report of research carried out by National Centre for Social Research on behalf of the Department for Work and Pensions
Department for Work and Pensions Research Report No 607 A test for racial discrimination in recruitment practice in British cities Martin Wood, Jon Hales, Susan Purdon, Tanja Sejersen and Oliver Hayllar A report of research carried out by National Centre for Social Research on behalf of the Department for Work and Pensions
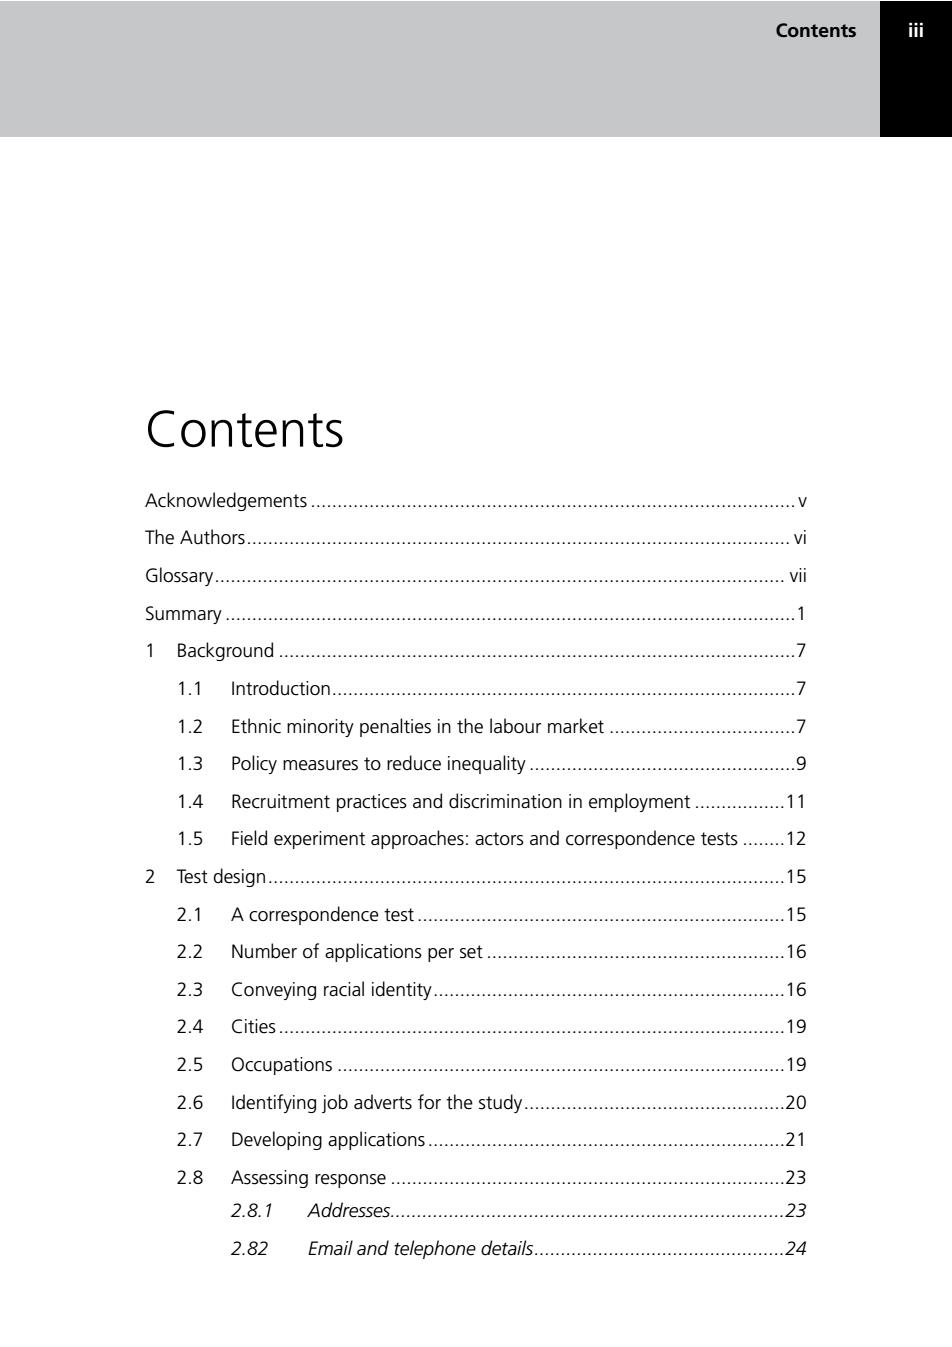
Contents 讯 Contents Acknowledgements 。。 The Authors.… Glossary... vii Summary… 1 1 Background.............. 1.1 Introduction.... .7 1.2 Ethnic minority penalties in the labour market................ 1.3 Policy measures to reduce inequality.................9. 1.4 Recruitment practices and discrimination in employment.........11 1.5 Field experiment approaches:actors and correspondence tests........12 2 Test design.... .15 2.1 Acorrespondence test............... .15 2.2 Number of applications per set.... 16 2.3 Conveying racial identity.............. 16 2.4 Cities… 19 2.5 Occupations......... 19 2.6 Identifying job adverts for the study.............. .20 2.7 Developing applications........... 21 2.8 Assessing response................. 23 2.8.1 Addresses...... 23 2.82 Email and telephone details. .24
Contents iii Contents Acknowledgements........................................................................................... v The Authors...................................................................................................... vi Glossary........................................................................................................... vii Summary ...........................................................................................................1 1 Background .................................................................................................7 1.1 Introduction.......................................................................................7 1.2 Ethnic minority penalties in the labour market ...................................7 1.3 Policy measures to reduce inequality ..................................................9 1.4 Recruitment practices and discrimination in employment .................11 1.5 Field experiment approaches: actors and correspondence tests ........12 2 Test design.................................................................................................15 2.1 A correspondence test.....................................................................15 2.2 Number of applications per set ........................................................16 2.3 Conveying racial identity..................................................................16 2.4 Cities...............................................................................................19 2.5 Occupations ....................................................................................19 2.6 Identifying job adverts for the study.................................................20 2.7 Developing applications...................................................................21 2.8 Assessing response ..........................................................................23 2.8.1 Addresses..........................................................................23 2.82 Email and telephone details...............................................24
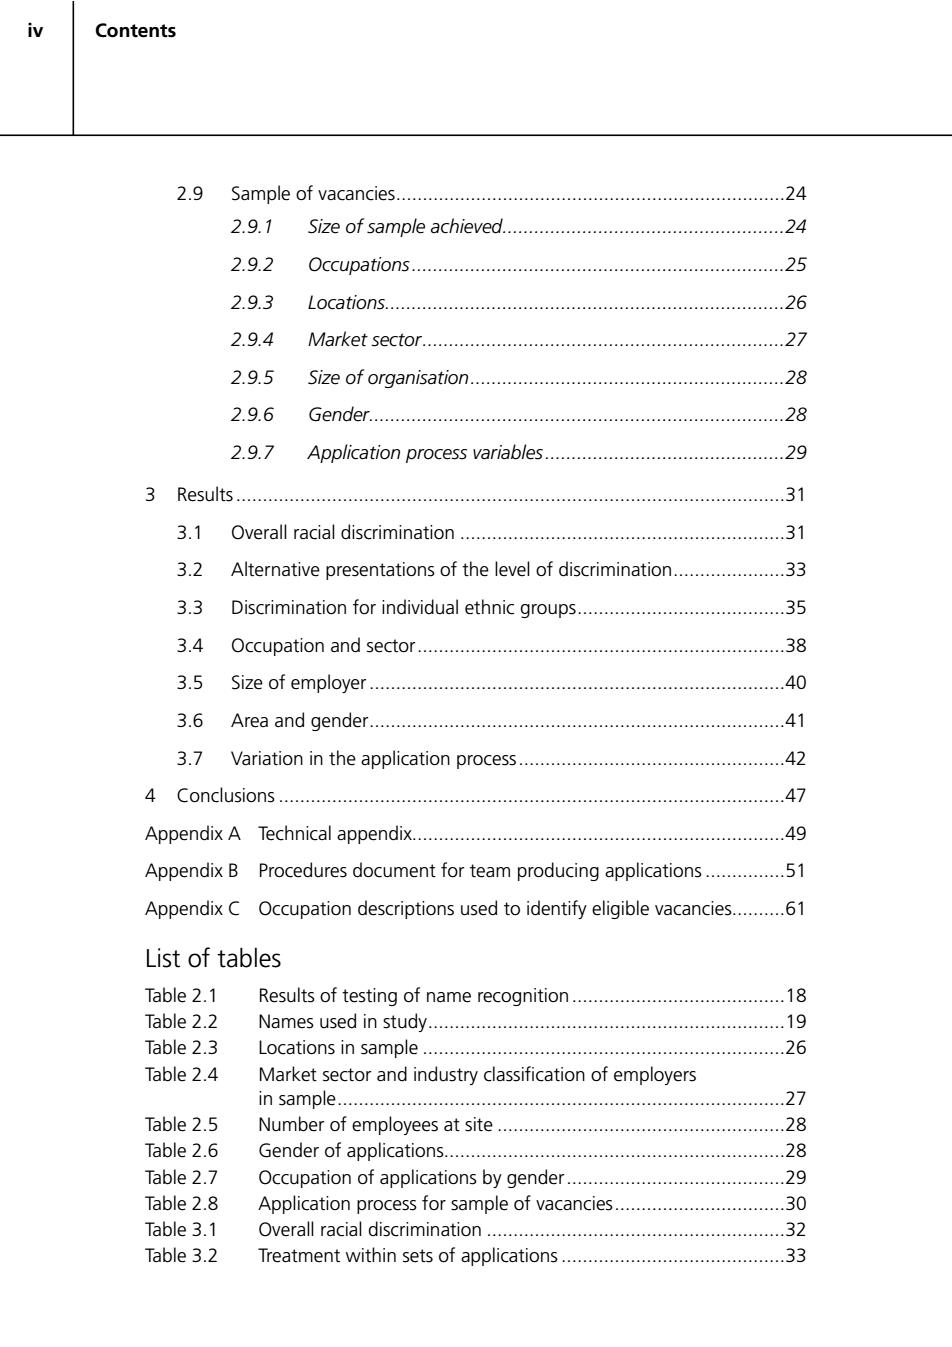
iⅳ Contents 2.9 Sample of vacancies..................... .24 2.9.1 Size of sample achieved. 24 2.9.2 25 0 ccupati0门S....... 2.9.3 Locations.......... 26 2.9.4 Market sector............ .27 2.9.5 Size of organisation......... 28 2.9.6 Gender........ 28 2.9.7 Application process variables 29 ............................................................................. 3.1 Overall racial discrimination..... .31 3.2 Alternative presentations of the level of discrimination.....................33 3.3 Discrimination for individual ethnic groups............................ 35 3.4 Occupation and sector. 38 3.5 Size of employer 40 3.6 Area and gender. 41 3.7 Variation in the application process................. 42 4 Conclusions.… .…47 Appendix A Technical appendix.............................. 49 Appendix B Procedures document for team producing applications...........51 Appendix C Occupation descriptions used to identify eligible vacancies..........61 List of tables Table 2.1 Results of testing of name recognition................ 18 Table 2.2 Names used in study19 Table 2.3 Locations in sample................. 26 Table 2.4 Market sector and industry classification of employers in sample........... .27 Table 2.5 Number of employees at site.............. 28 Table 2.6 Gender of applications... 28 Table 2.7 Occupation of applications by gender........ 29 Table 2.8 Application process for sample of vacancies......30 Table 3.1 Overall racial discrimination32 Table 3.2 Treatment within sets of applications........ 33
iv 2.9 Sample of vacancies.........................................................................24 2.9.1 Size of sample achieved.....................................................24 2.9.2 Occupations......................................................................25 2.9.3 Locations...........................................................................26 2.9.4 Market sector....................................................................27 2.9.5 Size of organisation...........................................................28 2.9.6 Gender..............................................................................28 2.9.7 Application process variables.............................................29 3 Results.......................................................................................................31 3.1 Overall racial discrimination .............................................................31 3.2 Alternative presentations of the level of discrimination.....................33 3.3 Discrimination for individual ethnic groups.......................................35 3.4 Occupation and sector.....................................................................38 3.5 Size of employer..............................................................................40 3.6 Area and gender..............................................................................41 3.7 Variation in the application process..................................................42 4 Conclusions...............................................................................................47 Appendix A Technical appendix......................................................................49 Appendix B Procedures document for team producing applications...............51 Appendix C Occupation descriptions used to identify eligible vacancies..........61 List of tables Table 2.1 Results of testing of name recognition........................................18 Table 2.2 Names used in study...................................................................19 Table 2.3 Locations in sample ....................................................................26 Table 2.4 Market sector and industry classification of employers in sample....................................................................................27 Table 2.5 Number of employees at site ......................................................28 Table 2.6 Gender of applications................................................................28 Table 2.7 Occupation of applications by gender.........................................29 Table 2.8 Application process for sample of vacancies................................30 Table 3.1 Overall racial discrimination ........................................................32 Table 3.2 Treatment within sets of applications..........................................33 Contents
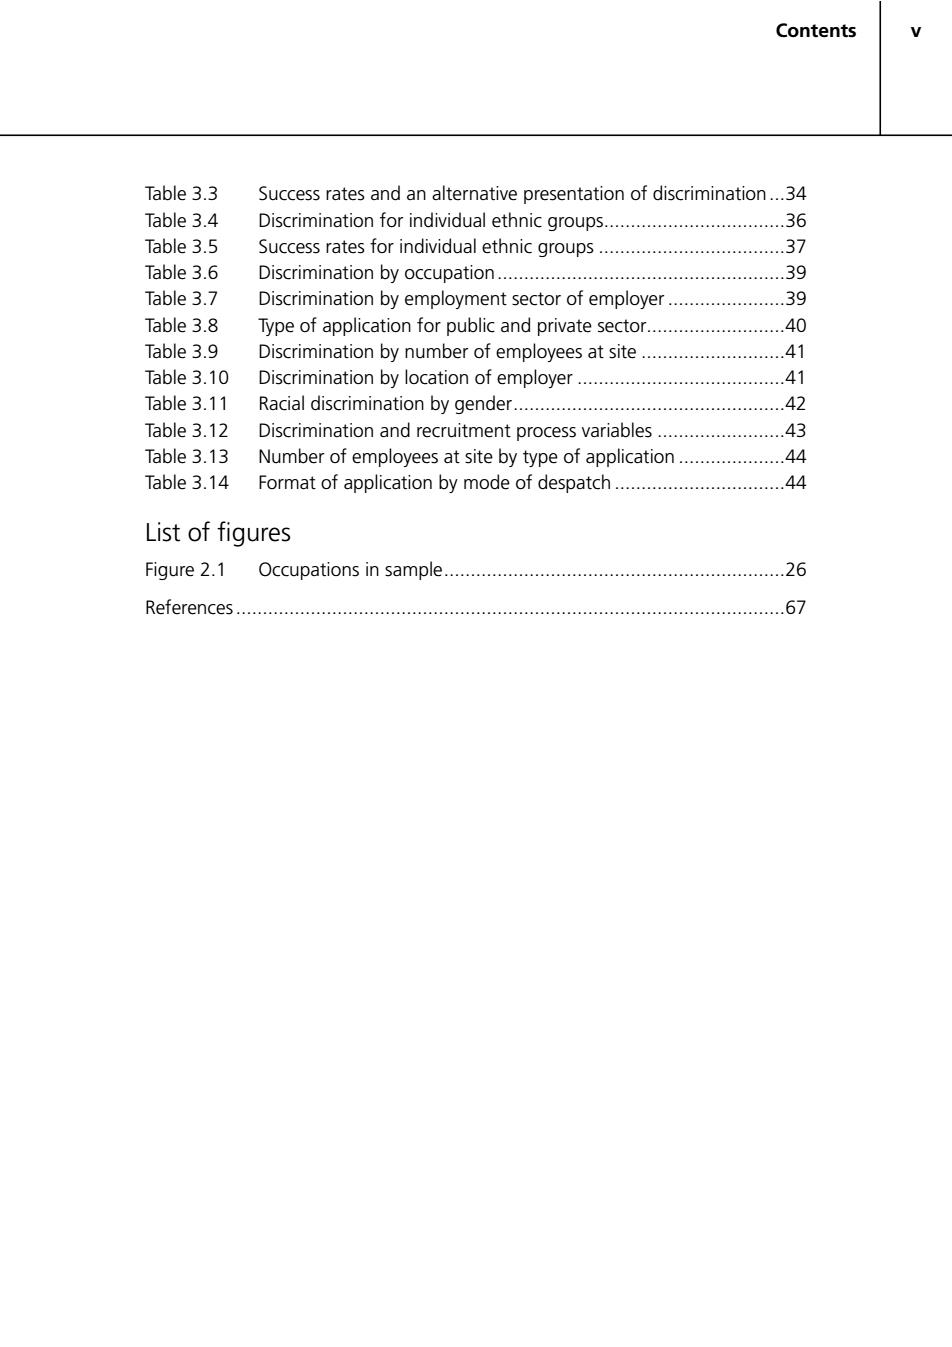
Contents Table 3.3 Success rates and an alternative presentation of discrimination...34 Table 3.4 Discrimination for individual ethnic groups......................36 Table 3.5 Success rates for individual ethnic groups.......... 37 Table 3.6 Discrimination by occupation............39 Table 3.7 Discrimination by employment sector of employer 39 Table 3.8 Type of application for public and private sector.4o Table 3.9 Discrimination by number of employees at site .41 Table 3.10 Discrimination by location of employer...................41 Table 3.11 Racial discrimination by gender............... 42 Table 3.12 Discrimination and recruitment process variables..... 43 Table 3.13 Number of employees at site by type of application .44 Table 3.14 Format of application by mode of despatch.......44 List of figures Figure 2.1 Occupations in sample. .26 References... AA E S A E L A E M A L S A E S A E L A E S A L S A E S A E 67
v Table 3.3 Success rates and an alternative presentation of discrimination...34 Table 3.4 Discrimination for individual ethnic groups..................................36 Table 3.5 Success rates for individual ethnic groups ...................................37 Table 3.6 Discrimination by occupation......................................................39 Table 3.7 Discrimination by employment sector of employer ......................39 Table 3.8 Type of application for public and private sector..........................40 Table 3.9 Discrimination by number of employees at site ...........................41 Table 3.10 Discrimination by location of employer .......................................41 Table 3.11 Racial discrimination by gender...................................................42 Table 3.12 Discrimination and recruitment process variables ........................43 Table 3.13 Number of employees at site by type of application ....................44 Table 3.14 Format of application by mode of despatch ................................44 List of figures Figure 2.1 Occupations in sample................................................................26 References.......................................................................................................67 Contents
Acknowledgements vii Acknowledgements The National Centre for Social Research (NatCen)was commissioned by the Department for Work and Pensions(DWP)to carry out this study of discrimination. The authors would like to thank Pauline Heather,Del Jenkins and David Johnson at DWP for their identification of the need for such an approach and their support and guidance throughout the study. Special thanks to the operations team at NatCen's Brentwood office who developed the thousands of applications sent during the study:Neil Barton, Ed Garstin,Sarah Allcock,Becky Aldridge,Debbie Bagheri,Pete Baker, Alexis Bassett,Carol Bell,Bryan Mason,Kalpna Moore,Chris Shaw and Elise Yarrow.Thanks too to Christianah lyaniwura and Yachien Huang. Sir Roger Jowell and Professor Anthony Heath acted as advisors to the project,and our thanks to them for their valuable guidance
Acknowledgements vii Acknowledgements The National Centre for Social Research (NatCen) was commissioned by the Department for Work and Pensions (DWP) to carry out this study of discrimination. The authors would like to thank Pauline Heather, Del Jenkins and David Johnson at DWP for their identification of the need for such an approach and their support and guidance throughout the study. Special thanks to the operations team at NatCen’s Brentwood office who developed the thousands of applications sent during the study: Neil Barton, Ed Garstin, Sarah Allcock, Becky Aldridge, Debbie Bagheri, Pete Baker, Alexis Bassett, Carol Bell, Bryan Mason, Kalpna Moore, Chris Shaw and Elise Yarrow. Thanks too to Christianah Iyaniwura and Yachien Huang. Sir Roger Jowell and Professor Anthony Heath acted as advisors to the project, and our thanks to them for their valuable guidance
viii The Authors The Authors Martin Wood is a Research Director in the Employment,Welfare and Crime quantitative research group at the National Centre for Social Research(NatCen). Jon Hales is head of the Employment,Welfare and Crime quantitative research group at NatCen. Susan Purdon is a Quantitative Methods Advisor in the Survey Methods Unit at NatCen. Tanja Sejersen is a researcher in the Employment,Welfare and Crime quantitative research group at NatCen. Oliver Hayllar is a senior researcher in the Employment,Welfare and Crime quantitative research group at NatCen
viii The Authors The Authors Martin Wood is a Research Director in the Employment, Welfare and Crime quantitative research group at the National Centre for Social Research (NatCen). Jon Hales is head of the Employment, Welfare and Crime quantitative research group at NatCen. Susan Purdon is a Quantitative Methods Advisor in the Survey Methods Unit at NatCen. Tanja Sejersen is a researcher in the Employment, Welfare and Crime quantitative research group at NatCen. Oliver Hayllar is a senior researcher in the Employment, Welfare and Crime quantitative research group at NatCen
Glossary vii Glossary BME Black and Minority Ethnic Correspondence testing The sending of multiple matched written applications to real job vacancies with the variable of interest (ethnicity in our case) randomly assigned. cv Curriculum Vitae (or resume) Ethnic penalties In the labour market outcome literature,a term used to refer to the poorer labour market outcomes observed for ethnic minorities, even where factors such as educational attainment and age are taken into account. Net discrimination In our analysis,the number of instances of discrimination against a particular ethnic group that exceeds the number of instances of discrimination in its favour. Statistical discrimination Process by which discriminatory outcomes occur as a result of employers making decisions based on perceptions that race is correlated with job-relevant factors,such as communication skills and motivation.In this way it is different to preference-based discrimination
Glossary vii Glossary BME Black and Minority Ethnic Correspondence testing The sending of multiple matched written applications to real job vacancies with the variable of interest (ethnicity in our case) randomly assigned. CV Curriculum Vitae (or résumé) Ethnic penalties In the labour market outcome literature, a term used to refer to the poorer labour market outcomes observed for ethnic minorities, even where factors such as educational attainment and age are taken into account. Net discrimination In our analysis, the number of instances of discrimination against a particular ethnic group that exceeds the number of instances of discrimination in its favour. Statistical discrimination Process by which discriminatory outcomes occur as a result of employers making decisions based on perceptions that race is correlated with job-relevant factors, such as communication skills and motivation. In this way it is different to preference-based discrimination
Summary Summary Background This report shows the findings from a field experiment that involved submitting matched job applications from white and ethnic minority applicants to estimate the extent of racial discrimination in different areas of the British labour market. The Department for Work and Pensions(DWP)commissioned the National Centre for Social Research(NatCen)to carry out the study to collect factual evidence to test the assertion that discrimination is a significant factor affecting labour market outcomes for members of ethnic minorities. That there are ethnic penalties in employment in Britain is a well-established fact. Among the studies that identify them is an authoritative study carried out for DWP by Professor Anthony Heath and Dr Sin Yi Cheung(2006).They describe poorer outcomes for ethnic minority groups in terms of rates of unemployment, the level of work attained and rates of pay.They demonstrate that these poorer outcomes remain even after controlling for differences in characteristics of the various ethnic groups,such as age profiles and levels of education.The size of the 'net ethnic penalties'identified was shown to vary across different ethnic groups as well as for men and women.Those ethnic minority members born and educated in Britain,so-called 'second generation migrants',experience ethnic penalties in a similar way to the first generation. Although studies of this type are strongly suggestive of the role of discrimination, there are other plausible factors that may contribute to the gap in labour market outcomes (for instance a lack of established contacts with potential employers among ethnic minority groups).In order to establish that discrimination is operating and to estimate the size of its contribution to ethnic penalties,different types of study that actually test recruitment procedures are needed
Summary 1 Summary Background This report shows the findings from a field experiment that involved submitting matched job applications from white and ethnic minority applicants to estimate the extent of racial discrimination in different areas of the British labour market. The Department for Work and Pensions (DWP) commissioned the National Centre for Social Research (NatCen) to carry out the study to collect factual evidence to test the assertion that discrimination is a significant factor affecting labour market outcomes for members of ethnic minorities. That there are ethnic penalties in employment in Britain is a well-established fact. Among the studies that identify them is an authoritative study carried out for DWP by Professor Anthony Heath and Dr Sin Yi Cheung (2006). They describe poorer outcomes for ethnic minority groups in terms of rates of unemployment, the level of work attained and rates of pay. They demonstrate that these poorer outcomes remain even after controlling for differences in characteristics of the various ethnic groups, such as age profiles and levels of education. The size of the ‘net ethnic penalties’ identified was shown to vary across different ethnic groups as well as for men and women. Those ethnic minority members born and educated in Britain, so-called ‘second generation migrants’, experience ethnic penalties in a similar way to the first generation. Although studies of this type are strongly suggestive of the role of discrimination, there are other plausible factors that may contribute to the gap in labour market outcomes (for instance a lack of established contacts with potential employers among ethnic minority groups). In order to establish that discrimination is operating and to estimate the size of its contribution to ethnic penalties, different types of study that actually test recruitment procedures are needed
2 Summary Test approach It is in this context that 'field experiments'have been developed to test recruitment practice.Initially carried out in the United Kingdom(UK)and United States(US), studies with similar methods have now been carried out in many countries.Some have used an approach whereby actors attend interviews,while others have focused on the written application stage of the process,but the central principle in each study has been for applications to be made from candidates who are matched,except with respect to their ethnic background.Differences in treatment from employers are then attributed to discrimination. The approach adopted for the study described in this report was that of a correspondence test where written applications were submitted for advertised vacancies.While this approach is focused on the first part of the recruitment process,it avoids the problems associated with tests that involve actors(principally that it cannot be proven that all relevant differences between actors,including motivation,have been matched successfully).The random assignment of ethnicity to written applications in a correspondence test allows us to be confident that the test is valid. The key elements of our approach were as follows: 1 Formally advertised job vacancies were identified in seven major British cities for a set of nine occupations:IT Support,IT Technician,Accountant,Accounts Clerk,Human Resources Manager,Teaching Assistant,Care Assistant,Sales Assistant and Office Assistant. 2 A set of three applications was developed in response to these adverts that were closely matched in terms of their education,skills and work history. 3 Ethnic identity was conveyed using names found to be widely associated with the ethnic groups included in the study (black African,black Caribbean, Chinese,Indian,Pakistani/Bangladeshi,white).These names were randomly assigned to each application (one of the three was white,with the other two from different minority ethnic groups). 4 Responses from employers were monitored,with the key positive outcome being a call-back for an interview. 5 Discrimination was measured as differential treatment at an aggregate level between the ethnic groups in the study(the fact that applications were sent for the same vacancies provided the control) The ethical dimensions of the study were considered by the researchers in their review of the literature on field experiments and by an internal ethics committee. The view formed was that the burden for employers of considering an additional three applications while engaged in a public recruitment process was minimal,and that a speedy response to decline offers of interviews would minimise problems. This report is careful not to identify the organisations included in the sample
2 Test approach It is in this context that ‘field experiments’ have been developed to test recruitment practice. Initially carried out in the United Kingdom (UK) and United States (US), studies with similar methods have now been carried out in many countries. Some have used an approach whereby actors attend interviews, while others have focused on the written application stage of the process, but the central principle in each study has been for applications to be made from candidates who are matched, except with respect to their ethnic background. Differences in treatment from employers are then attributed to discrimination. The approach adopted for the study described in this report was that of a correspondence test where written applications were submitted for advertised vacancies. While this approach is focused on the first part of the recruitment process, it avoids the problems associated with tests that involve actors (principally that it cannot be proven that all relevant differences between actors, including motivation, have been matched successfully). The random assignment of ethnicity to written applications in a correspondence test allows us to be confident that the test is valid. The key elements of our approach were as follows: 1 Formally advertised job vacancies were identified in seven major British cities for a set of nine occupations: IT Support, IT Technician, Accountant, Accounts Clerk, Human Resources Manager, Teaching Assistant, Care Assistant, Sales Assistant and Office Assistant. 2 A set of three applications was developed in response to these adverts that were closely matched in terms of their education, skills and work history. 3 Ethnic identity was conveyed using names found to be widely associated with the ethnic groups included in the study (black African, black Caribbean, Chinese, Indian, Pakistani/Bangladeshi, white). These names were randomly assigned to each application (one of the three was white, with the other two from different minority ethnic groups). 4 Responses from employers were monitored, with the key positive outcome being a call-back for an interview. 5 Discrimination was measured as differential treatment at an aggregate level between the ethnic groups in the study (the fact that applications were sent for the same vacancies provided the control). The ethical dimensions of the study were considered by the researchers in their review of the literature on field experiments and by an internal ethics committee. The view formed was that the burden for employers of considering an additional three applications while engaged in a public recruitment process was minimal, and that a speedy response to decline offers of interviews would minimise problems. This report is careful not to identify the organisations included in the sample. Summary
Summary 3 Between November 2008 and May 2009 a total of 2,961 applications were sent to 987 advertised job vacancies.This period coincided with the sharpest recession in 50 years in the UK and is likely to have had a significant effect on the study in terms of reducing the number of applications resulting in positive responses from employers.One or more of the three applications to a particular vacancy received a positive response from an employer in 155 of the sets (or 16 per cent). Results Overall racial discrimination We adopt a net measure for describing the level of discrimination that is based on the 155 sets of applications where one or more positive response was received. This is calculated by subtracting the proportion of the ethnic minority applications that received a positive response from employers(39 per cent)from the proportion for white applications(68 per cent).So,the net discrimination in favour of white names over equivalent applications from ethnic minority candidates was 29 per cent.This level is both high and statistically significantly different from zero. The advantage of this measure is that it is not affected by the level of success that the research team had in achieving the required quality of applications.However, an alternative and perhaps more intuitive way of expressing the same result is to look at the percentage of 'successes'for different groups based on all sets of applications.Of the 987 applications with a white name,10.7 per cent received a positive response.This compared to 6.2 per cent of the 1,974 applications with an ethnic minority name-a net difference of 4.6 percentage points.Put another way,16 applications from ethnic minority applicants had to be sent for a successful outcome in our test compared with nine white.That is,74 per cent more applications from ethnic minority candidates needed to be sent for the same level of success. The figures in the remainder of this summary refer to the preferred net discrimination measure based on the 155 sets of applications for which one or more positive responses were received. Discrimination for individual ethnic groups The test design allows us to look at discrimination for each of the individual ethnic minority groups.This was of particular interest,as studies(for instance Heath and Cheung,2006)have shown there to be considerable variation between ethnic minority groups in the severity of the ethnic penalties observable in labour market outcomes. The level of racial discrimination was found to be high across all ethnic groups. Although there was some variation in the level,ranging from 21 per cent for Pakistani/Bangladeshi names to 32 per cent for Indian,Chinese and black Caribbean names,the differences between the groups were not statistically significant
Summary 3 Between November 2008 and May 2009 a total of 2,961 applications were sent to 987 advertised job vacancies. This period coincided with the sharpest recession in 50 years in the UK and is likely to have had a significant effect on the study in terms of reducing the number of applications resulting in positive responses from employers. One or more of the three applications to a particular vacancy received a positive response from an employer in 155 of the sets (or 16 per cent). Results Overall racial discrimination We adopt a net measure for describing the level of discrimination that is based on the 155 sets of applications where one or more positive response was received. This is calculated by subtracting the proportion of the ethnic minority applications that received a positive response from employers (39 per cent) from the proportion for white applications (68 per cent). So, the net discrimination in favour of white names over equivalent applications from ethnic minority candidates was 29 per cent. This level is both high and statistically significantly different from zero. The advantage of this measure is that it is not affected by the level of success that the research team had in achieving the required quality of applications. However, an alternative and perhaps more intuitive way of expressing the same result is to look at the percentage of ‘successes’ for different groups based on all sets of applications. Of the 987 applications with a white name, 10.7 per cent received a positive response. This compared to 6.2 per cent of the 1,974 applications with an ethnic minority name – a net difference of 4.6 percentage points. Put another way, 16 applications from ethnic minority applicants had to be sent for a successful outcome in our test compared with nine white. That is, 74 per cent more applications from ethnic minority candidates needed to be sent for the same level of success. The figures in the remainder of this summary refer to the preferred net discrimination measure based on the 155 sets of applications for which one or more positive responses were received. Discrimination for individual ethnic groups The test design allows us to look at discrimination for each of the individual ethnic minority groups. This was of particular interest, as studies (for instance Heath and Cheung, 2006) have shown there to be considerable variation between ethnic minority groups in the severity of the ethnic penalties observable in labour market outcomes. The level of racial discrimination was found to be high across all ethnic groups. Although there was some variation in the level, ranging from 21 per cent for Pakistani/Bangladeshi names to 32 per cent for Indian, Chinese and black Caribbean names, the differences between the groups were not statistically significant