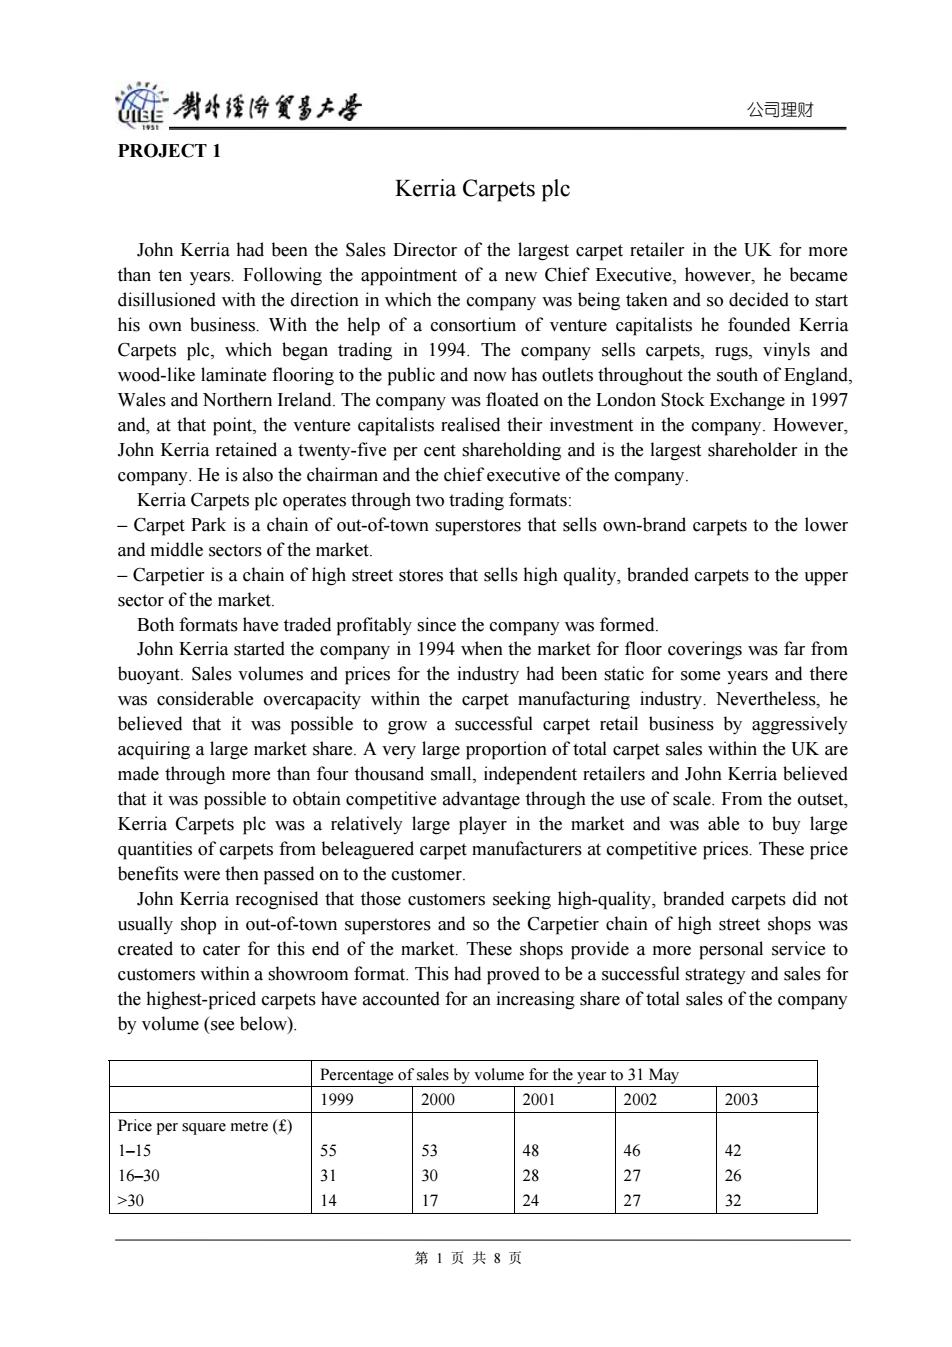
能男牛经降贸多大 公司理财 PROJECT 1 Kerria Carpets plc John Kerria had been the Sales Director of the largest carpet retailer in the UK for more than ten years.Following the appointment of a new Chief Executive,however,he became disillusioned with the direction in which the company was being taken and so decided to start his own business.With the help of a consortium of venture capitalists he founded Kerria Carpets plc,which began trading in 1994.The company sells carpets,rugs,vinyls and wood-like laminate flooring to the public and now has outlets throughout the south of England, Wales and Northern Ireland.The company was floated on the London Stock Exchange in 1997 and,at that point,the venture capitalists realised their investment in the company.However, John Kerria retained a twenty-five per cent shareholding and is the largest shareholder in the company.He is also the chairman and the chiefexecutive of the company. Kerria Carpets plc operates through two trading formats: -Carpet Park is a chain of out-of-town superstores that sells own-brand carpets to the lower and middle sectors of the market. -Carpetier is a chain of high street stores that sells high quality,branded carpets to the upper sector of the market. Both formats have traded profitably since the company was formed. John Kerria started the company in 1994 when the market for floor coverings was far from buoyant.Sales volumes and prices for the industry had been static for some years and there was considerable overcapacity within the carpet manufacturing industry.Nevertheless,he believed that it was possible to grow a successful carpet retail business by aggressively acquiring a large market share.A very large proportion of total carpet sales within the UK are made through more than four thousand small,independent retailers and John Kerria believed that it was possible to obtain competitive advantage through the use of scale.From the outset, Kerria Carpets plc was a relatively large player in the market and was able to buy large quantities of carpets from beleaguered carpet manufacturers at competitive prices.These price benefits were then passed on to the customer. John Kerria recognised that those customers seeking high-quality,branded carpets did not usually shop in out-of-town superstores and so the Carpetier chain of high street shops was created to cater for this end of the market.These shops provide a more personal service to customers within a showroom format.This had proved to be a successful strategy and sales for the highest-priced carpets have accounted for an increasing share of total sales of the company by volume(see below). Percentage of sales by volume for the year to 31 May 1999 2000 2001 2002 2003 Price per square metre(f) 1-15 55 53 48 46 42 16-30 31 30 28 27 26 >30 14 17 24 27 32 第1页共8页
公司理财 PROJECT 1 Kerria Carpets plc John Kerria had been the Sales Director of the largest carpet retailer in the UK for more than ten years. Following the appointment of a new Chief Executive, however, he became disillusioned with the direction in which the company was being taken and so decided to start his own business. With the help of a consortium of venture capitalists he founded Kerria Carpets plc, which began trading in 1994. The company sells carpets, rugs, vinyls and wood-like laminate flooring to the public and now has outlets throughout the south of England, Wales and Northern Ireland. The company was floated on the London Stock Exchange in 1997 and, at that point, the venture capitalists realised their investment in the company. However, John Kerria retained a twenty-five per cent shareholding and is the largest shareholder in the company. He is also the chairman and the chief executive of the company. Kerria Carpets plc operates through two trading formats: – Carpet Park is a chain of out-of-town superstores that sells own-brand carpets to the lower and middle sectors of the market. – Carpetier is a chain of high street stores that sells high quality, branded carpets to the upper sector of the market. Both formats have traded profitably since the company was formed. John Kerria started the company in 1994 when the market for floor coverings was far from buoyant. Sales volumes and prices for the industry had been static for some years and there was considerable overcapacity within the carpet manufacturing industry. Nevertheless, he believed that it was possible to grow a successful carpet retail business by aggressively acquiring a large market share. A very large proportion of total carpet sales within the UK are made through more than four thousand small, independent retailers and John Kerria believed that it was possible to obtain competitive advantage through the use of scale. From the outset, Kerria Carpets plc was a relatively large player in the market and was able to buy large quantities of carpets from beleaguered carpet manufacturers at competitive prices. These price benefits were then passed on to the customer. John Kerria recognised that those customers seeking high-quality, branded carpets did not usually shop in out-of-town superstores and so the Carpetier chain of high street shops was created to cater for this end of the market. These shops provide a more personal service to customers within a showroom format. This had proved to be a successful strategy and sales for the highest-priced carpets have accounted for an increasing share of total sales of the company by volume (see below). Percentage of sales by volume for the year to 31 May 1999 2000 2001 2002 2003 Price per square metre (£) 1–15 16–30 >30 55 31 14 53 30 17 48 28 24 46 27 27 42 26 32 第 1 页 共 8 页
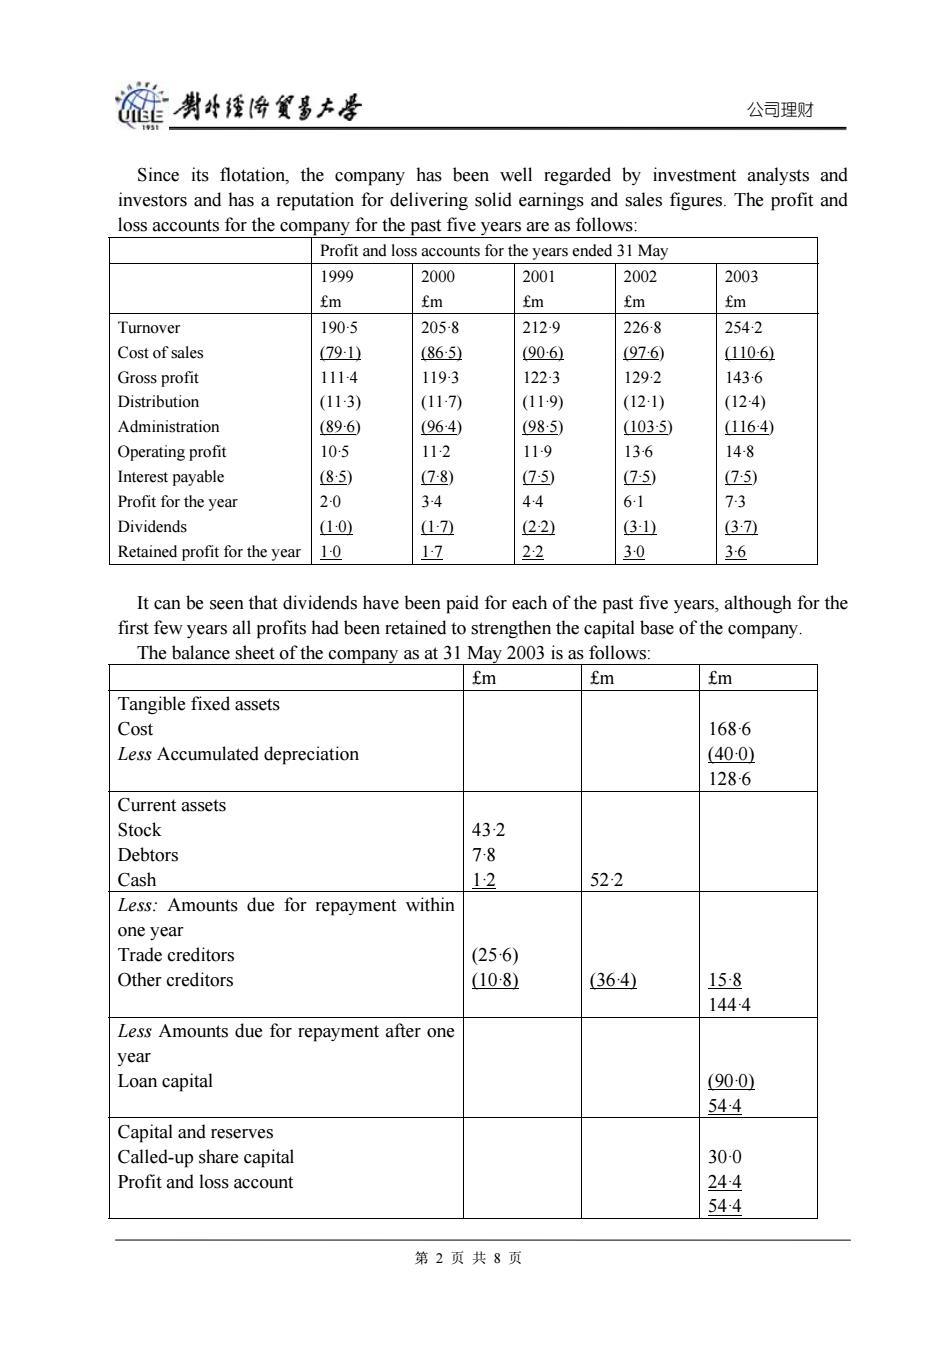
链剥4悔多大号 公司理财 Since its flotation,the company has been well regarded by investment analysts and investors and has a reputation for delivering solid earnings and sales figures.The profit and loss accounts for the company for the past five years are as follows: Profit and loss accounts for the years ended 31 May 1999 2000 2001 2002 2003 fm fm fm fm fm Turnover 190-5 205-8 212-9 226-8 2542 Cost of sales 791山 (865) (906) (976) 1106 Gross profit 1114 119-3 122-3 129-2 1436 Distribution (11-3) (117) (11-9) (12-1) (124) Administration (896) (964) (985) (1035) 1164) Operating profit 10-5 11-2 11-9 13-6 148 Interest payable (85) 78) (7-5) (7-5) 7:5) Profit for the year 2-0 34 44 6-1 7-3 Dividends 10) 17 (22) 3 (37ù Retained profit for the year 1-0 17 22 3-0 36 It can be seen that dividends have been paid for each of the past five years,although for the first few years all profits had been retained to strengthen the capital base of the company. The balance sheet of the company as at 31 May 2003 is as follows: fm fm fm Tangible fixed assets Cost 1686 Less Accumulated depreciation (40-0 1286 Current assets Stock 432 Debtors 78 Cash 12 522 Less:Amounts due for repayment within one year Trade creditors (256) Other creditors 108) 36·4) 158 1444 Less Amounts due for repayment after one year Loan capital (90-0 544 Capital and reserves Called-up share capital 30-0 Profit and loss account 244 544 第2页共8页
公司理财 Since its flotation, the company has been well regarded by investment analysts and investors and has a reputation for delivering solid earnings and sales figures. The profit and loss accounts for the company for the past five years are as follows: Profit and loss accounts for the years ended 31 May 1999 £m 2000 £m 2001 £m 2002 £m 2003 £m Turnover Cost of sales Gross profit Distribution Administration Operating profit Interest payable Profit for the year Dividends Retained profit for the year 190·5 (79·1) 111·4 (11·3) (89·6) 10·5 (8·5) 2·0 (1·0) 1·0 205·8 (86·5) 119·3 (11·7) (96·4) 11·2 (7·8) 3·4 (1·7) 1·7 212·9 (90·6) 122·3 (11·9) (98·5) 11·9 (7·5) 4·4 (2·2) 2·2 226·8 (97·6) 129·2 (12·1) (103·5) 13·6 (7·5) 6·1 (3·1) 3·0 254·2 (110·6) 143·6 (12·4) (116·4) 14·8 (7·5) 7·3 (3·7) 3·6 It can be seen that dividends have been paid for each of the past five years, although for the first few years all profits had been retained to strengthen the capital base of the company. The balance sheet of the company as at 31 May 2003 is as follows: £m £m £m Tangible fixed assets Cost Less Accumulated depreciation 168·6 (40·0) 128·6 Current assets Stock Debtors Cash 43·2 7·8 1·2 52·2 Less: Amounts due for repayment within one year Trade creditors Other creditors (25·6) (10·8) (36·4) 15·8 144·4 Less Amounts due for repayment after one year Loan capital (90·0) 54·4 Capital and reserves Called-up share capital Profit and loss account 30·0 24·4 54·4 第 2 页 共 8 页
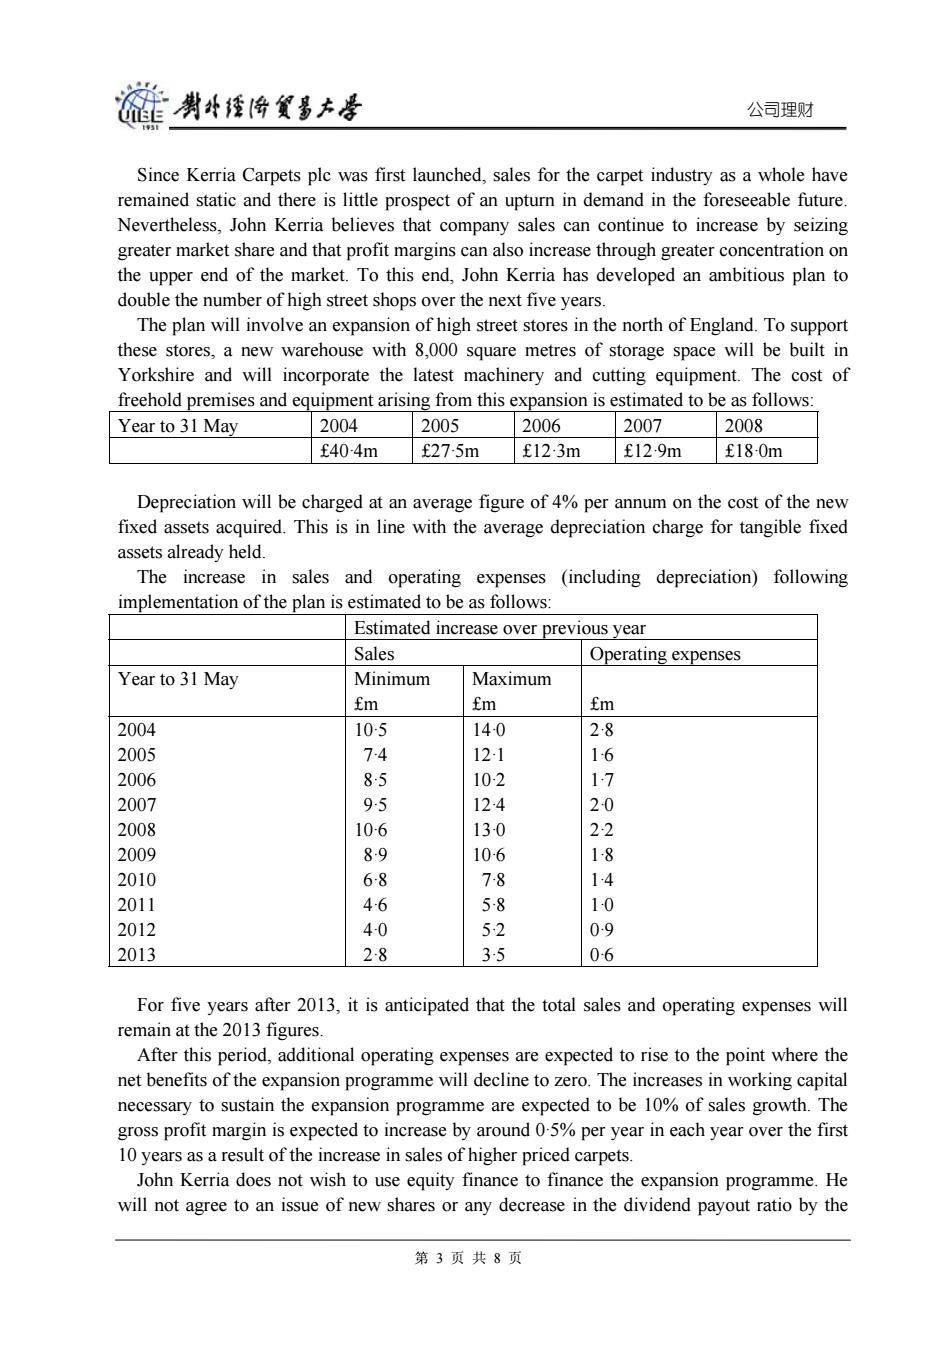
旋剥经降贸多去号 公司理财 Since Kerria Carpets plc was first launched,sales for the carpet industry as a whole have remained static and there is little prospect of an upturn in demand in the foreseeable future. Nevertheless,John Kerria believes that company sales can continue to increase by seizing greater market share and that profit margins can also increase through greater concentration on the upper end of the market.To this end,John Kerria has developed an ambitious plan to double the number of high street shops over the next five years. The plan will involve an expansion of high street stores in the north of England.To support these stores,a new warehouse with 8,000 square metres of storage space will be built in Yorkshire and will incorporate the latest machinery and cutting equipment.The cost of freehold premises and equipment arising from this expansion is estimated to be as follows: Year to 31 May 2004 2005 2006 2007 2008 f404m f27-5m £12-3m £129m £180m Depreciation will be charged at an average figure of 4%per annum on the cost of the new fixed assets acquired.This is in line with the average depreciation charge for tangible fixed assets already held. The increase in sales and operating expenses (including depreciation)following implementation of the plan is estimated to be as follows: Estimated increase over previous year Sales Operating expenses Year to 31 May Minimum Maximum fm fm fm 2004 10-5 140 28 2005 74 12-1 1-6 2006 85 102 17 2007 95 124 20 2008 10-6 13-0 22 2009 89 10-6 1-8 2010 68 78 14 2011 46 58 10 2012 40 52 09 2013 2-8 35 0-6 For five years after 2013,it is anticipated that the total sales and operating expenses will remain at the 2013 figures. After this period,additional operating expenses are expected to rise to the point where the net benefits of the expansion programme will decline to zero.The increases in working capital necessary to sustain the expansion programme are expected to be 10%of sales growth.The gross profit margin is expected to increase by around 0-5%per year in each year over the first 10 years as a result of the increase in sales of higher priced carpets. John Kerria does not wish to use equity finance to finance the expansion programme.He will not agree to an issue of new shares or any decrease in the dividend payout ratio by the 第3页共8页
公司理财 Since Kerria Carpets plc was first launched, sales for the carpet industry as a whole have remained static and there is little prospect of an upturn in demand in the foreseeable future. Nevertheless, John Kerria believes that company sales can continue to increase by seizing greater market share and that profit margins can also increase through greater concentration on the upper end of the market. To this end, John Kerria has developed an ambitious plan to double the number of high street shops over the next five years. The plan will involve an expansion of high street stores in the north of England. To support these stores, a new warehouse with 8,000 square metres of storage space will be built in Yorkshire and will incorporate the latest machinery and cutting equipment. The cost of freehold premises and equipment arising from this expansion is estimated to be as follows: Year to 31 May 2004 2005 2006 2007 2008 £40·4m £27·5m £12·3m £12·9m £18·0m Depreciation will be charged at an average figure of 4% per annum on the cost of the new fixed assets acquired. This is in line with the average depreciation charge for tangible fixed assets already held. The increase in sales and operating expenses (including depreciation) following implementation of the plan is estimated to be as follows: Estimated increase over previous year Sales Operating expenses Year to 31 May Minimum £m Maximum £m £m 2004 2005 2006 2007 2008 2009 2010 2011 2012 2013 10·5 7·4 8·5 9·5 10·6 8·9 6·8 4·6 4·0 2·8 14·0 12·1 10·2 12·4 13·0 10·6 7·8 5·8 5·2 3·5 2·8 1·6 1·7 2·0 2·2 1·8 1·4 1·0 0·9 0·6 For five years after 2013, it is anticipated that the total sales and operating expenses will remain at the 2013 figures. After this period, additional operating expenses are expected to rise to the point where the net benefits of the expansion programme will decline to zero. The increases in working capital necessary to sustain the expansion programme are expected to be 10% of sales growth. The gross profit margin is expected to increase by around 0·5% per year in each year over the first 10 years as a result of the increase in sales of higher priced carpets. John Kerria does not wish to use equity finance to finance the expansion programme. He will not agree to an issue of new shares or any decrease in the dividend payout ratio by the 第 3 页 共 8 页
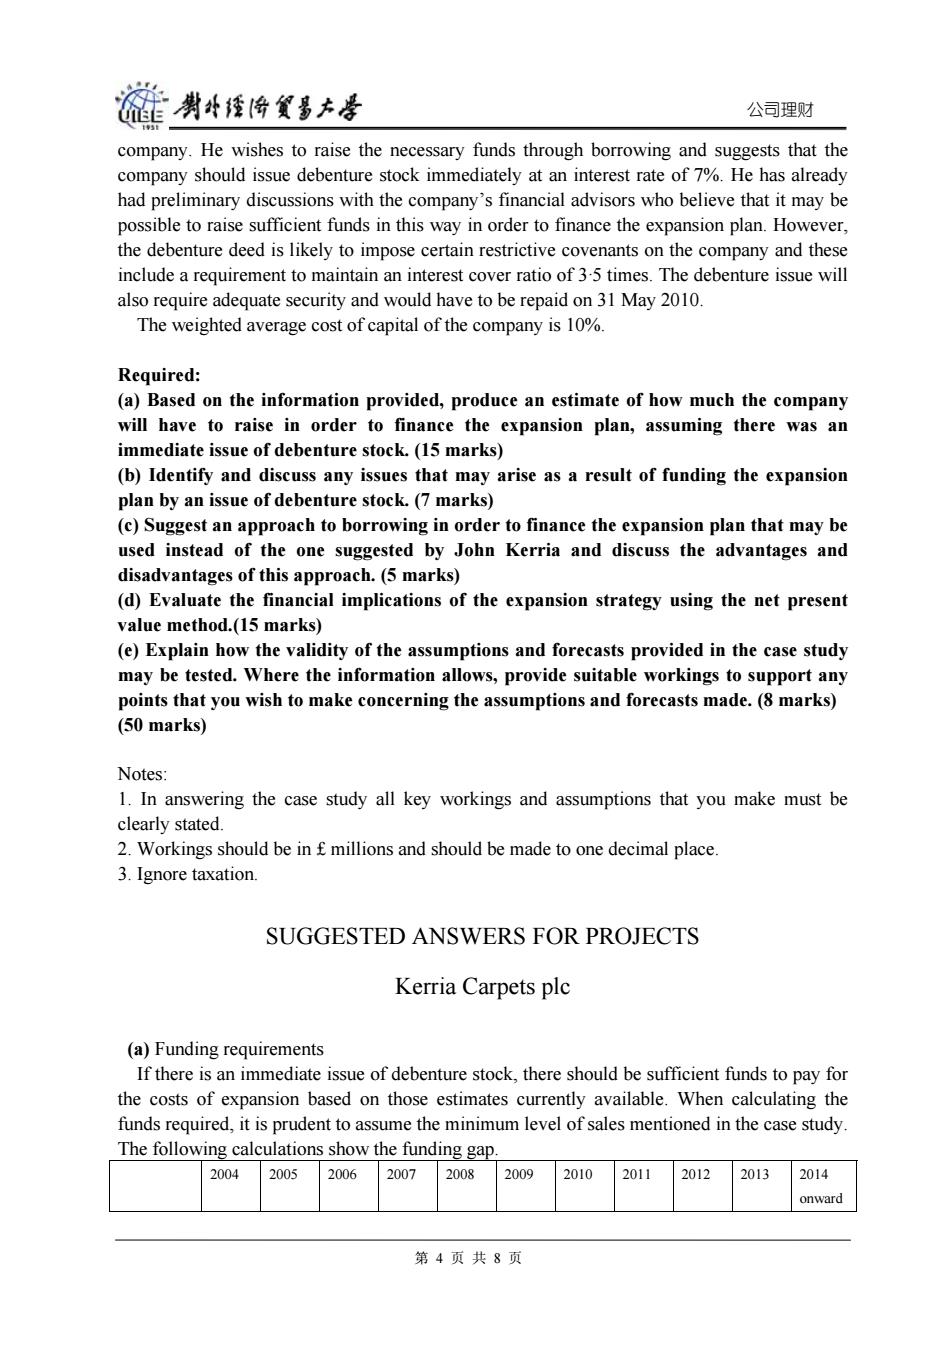
链剥经将复多大号 公司理财 company. He wishes to raise the necessary funds through borrowing and suggests that the company should issue debenture stock immediately at an interest rate of 7%.He has already had preliminary discussions with the company's financial advisors who believe that it may be possible to raise sufficient funds in this way in order to finance the expansion plan.However, the debenture deed is likely to impose certain restrictive covenants on the company and these include a requirement to maintain an interest cover ratio of 3-5 times.The debenture issue will also require adequate security and would have to be repaid on 31 May 2010. The weighted average cost of capital of the company is 10%. Required: (a)Based on the information provided,produce an estimate of how much the company will have to raise in order to finance the expansion plan,assuming there was an immediate issue of debenture stock.(15 marks) (b)Identify and discuss any issues that may arise as a result of funding the expansion plan by an issue of debenture stock.(7 marks) (c)Suggest an approach to borrowing in order to finance the expansion plan that may be used instead of the one suggested by John Kerria and discuss the advantages and disadvantages of this approach.(5 marks) (d)Evaluate the financial implications of the expansion strategy using the net present value method.(15 marks) (e)Explain how the validity of the assumptions and forecasts provided in the case study may be tested.Where the information allows,provide suitable workings to support any points that you wish to make concerning the assumptions and forecasts made.(8 marks) (50 marks) Notes: 1.In answering the case study all key workings and assumptions that you make must be clearly stated. 2.Workings should be in f millions and should be made to one decimal place. 3.Ignore taxation. SUGGESTED ANSWERS FOR PROJECTS Kerria Carpets plc (a)Funding requirements If there is an immediate issue of debenture stock,there should be sufficient funds to pay for the costs of expansion based on those estimates currently available.When calculating the funds required,it is prudent to assume the minimum level of sales mentioned in the case study. The following calculations show the funding gap. 2004 2005 2006 2007 2008 2009 2010 2011 2012 2013 2014 onward 第4页共8页
公司理财 company. He wishes to raise the necessary funds through borrowing and suggests that the company should issue debenture stock immediately at an interest rate of 7%. He has already had preliminary discussions with the company’s financial advisors who believe that it may be possible to raise sufficient funds in this way in order to finance the expansion plan. However, the debenture deed is likely to impose certain restrictive covenants on the company and these include a requirement to maintain an interest cover ratio of 3·5 times. The debenture issue will also require adequate security and would have to be repaid on 31 May 2010. The weighted average cost of capital of the company is 10%. Required: (a) Based on the information provided, produce an estimate of how much the company will have to raise in order to finance the expansion plan, assuming there was an immediate issue of debenture stock. (15 marks) (b) Identify and discuss any issues that may arise as a result of funding the expansion plan by an issue of debenture stock. (7 marks) (c) Suggest an approach to borrowing in order to finance the expansion plan that may be used instead of the one suggested by John Kerria and discuss the advantages and disadvantages of this approach. (5 marks) (d) Evaluate the financial implications of the expansion strategy using the net present value method.(15 marks) (e) Explain how the validity of the assumptions and forecasts provided in the case study may be tested. Where the information allows, provide suitable workings to support any points that you wish to make concerning the assumptions and forecasts made. (8 marks) (50 marks) Notes: 1. In answering the case study all key workings and assumptions that you make must be clearly stated. 2. Workings should be in £ millions and should be made to one decimal place. 3. Ignore taxation. SUGGESTED ANSWERS FOR PROJECTS Kerria Carpets plc (a) Funding requirements If there is an immediate issue of debenture stock, there should be sufficient funds to pay for the costs of expansion based on those estimates currently available. When calculating the funds required, it is prudent to assume the minimum level of sales mentioned in the case study. The following calculations show the funding gap. 2004 2005 2006 2007 2008 2009 2010 2011 2012 2013 2014 onward 第 4 页 共 8 页
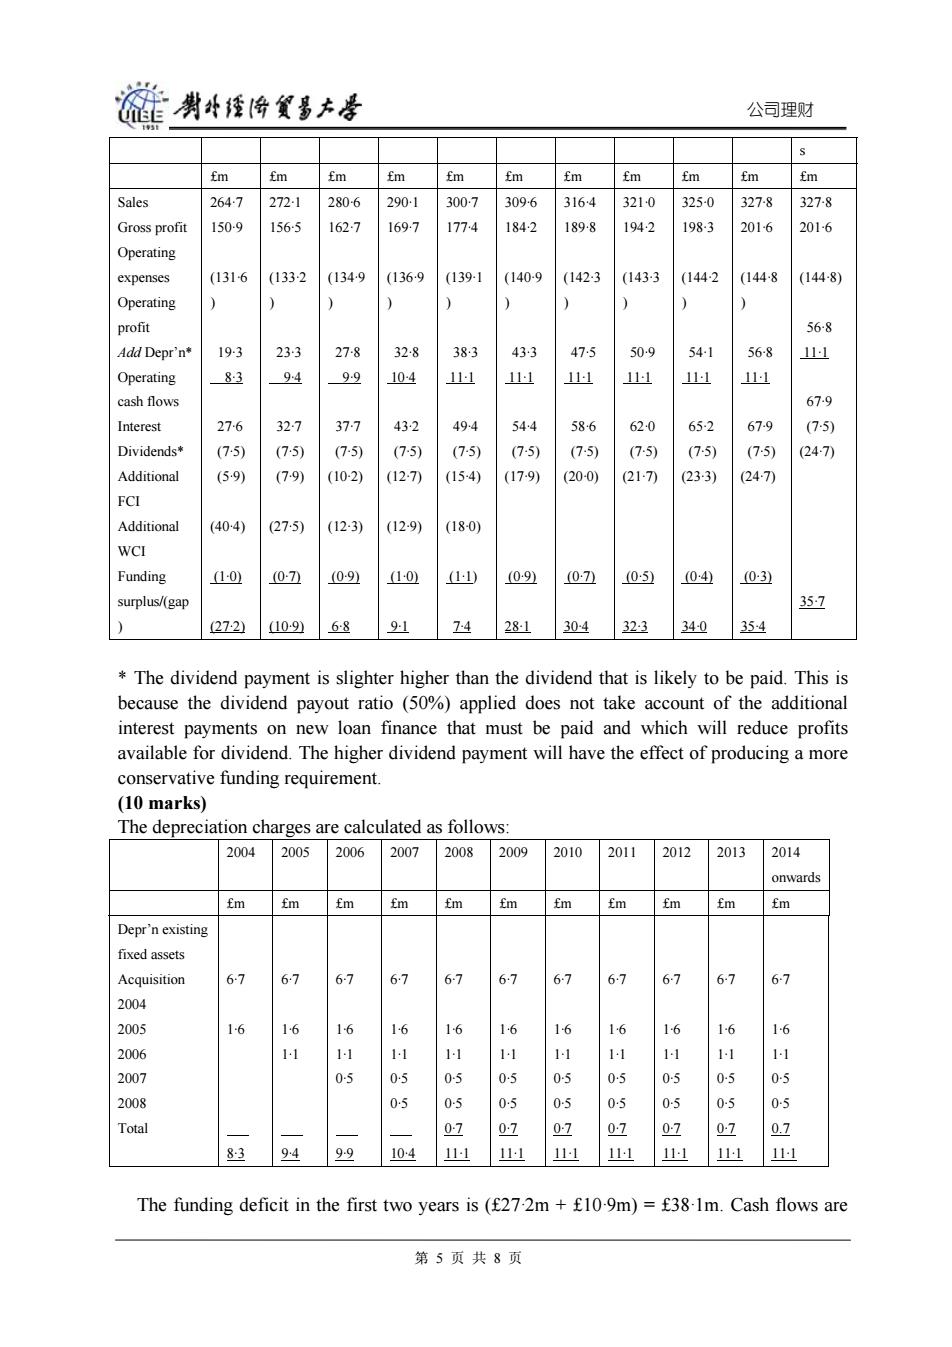
能剥4话降贸事大是 公司理财 fm fm fm fm fm fm fm fm fm fm fm Sales 2647 272-1 280-6 2901 3007 3096 3164 3210 325-0 327-8 327-8 Gross profit 1509 1565 162:7 169-7 1774 1842 1898 1942 1983 2016 201-6 Operating expenses (1316 (1332 (1349 (1369 (139-1 (140-9 (142-3 (1433 (144-2 (1448 (144-8) Operating profit 568 Add Depr'n* 19-3 233 27-8 328 383 433 475 509 541 568 1-1 Operating 83 94 99 104 11-1 111 11-1 111 111 111 cash flows 67-9 Interest 27-6 327 377 432 494 544 586 620 65-2 67-9 (75) Dividends* (75) (75) (75) (75) (7-5) (75) (7:5) (7-5) (75) (75) (247) Additional (59) (79) (10-2) (12-7刀 (154) (17-9) (20-0) (21-7) (233) (24-7 FCI Additional (404) (275) (12-3) (12-9) (18-0) WCI Funding (10) (0 (09) (1·0) (11) (09) (07) (05) (04) 031 surplus/(gap 357 272 109) 68 91 74 281 304 323 340 354 The dividend payment is slighter higher than the dividend that is likely to be paid.This is because the dividend payout ratio (50%)applied does not take account of the additional interest payments on new loan finance that must be paid and which will reduce profits available for dividend.The higher dividend payment will have the effect of producing a more conservative funding requirement. (10 marks) The depreciation charges are calculated as follows: 2004 2005 2006 2007 2008 2009 2010 2011 2012 2013 2014 onwards fm fm fm fm fm fm fm fm fm fm fm Depr'n existing fixed assets Acquisition 67 67 6-7 67 6-7 67 67 67 67 67 67 2004 2005 16 16 16 16 16 16 16 16 16 16 16 2006 11 11 1 11 11 11 11 1 1-1 2007 05 05 05 05 05 05 05 05 05 2008 05 05 0-5 05 0-5 05 05 05 Total 07 0-7 0-7 07 07 07 0.7 83 94 99 104 11-1 11-1 11-1 111 11-1 111 11-1 The funding deficit in the first two years is (f27-2m f10-9m)=f381m.Cash flows are 第5页共8页
公司理财 s £m £m £m £m £m £m £m £m £m £m £m Sales Gross profit Operating expenses Operating profit Add Depr’n* Operating cash flows Interest Dividends* Additional FCI Additional WCI Funding surplus/(gap ) 264·7 150·9 (131·6 ) 19·3 8·3 27·6 (7·5) (5·9) (40·4) (1·0) (27·2) 272·1 156·5 (133·2 ) 23·3 9·4 32·7 (7·5) (7·9) (27·5) (0·7) (10·9) 280·6 162·7 (134·9 ) 27·8 9·9 37·7 (7·5) (10·2) (12·3) (0·9) 6·8 290·1 169·7 (136·9 ) 32·8 10·4 43·2 (7·5) (12·7) (12·9) (1·0) 9·1 300·7 177·4 (139·1 ) 38·3 11·1 49·4 (7·5) (15·4) (18·0) (1·1) 7·4 309·6 184·2 (140·9 ) 43·3 11·1 54·4 (7·5) (17·9) (0·9) 28·1 316·4 189·8 (142·3 ) 47·5 11·1 58·6 (7·5) (20·0) (0·7) 30·4 321·0 194·2 (143·3 ) 50·9 11·1 62·0 (7·5) (21·7) (0·5) 32·3 325·0 198·3 (144·2 ) 54·1 11·1 65·2 (7·5) (23·3) (0·4) 34·0 327·8 201·6 (144·8 ) 56·8 11·1 67·9 (7·5) (24·7) (0·3) 35·4 327·8 201·6 (144·8) 56·8 11·1 67·9 (7·5) (24·7) 35·7 * The dividend payment is slighter higher than the dividend that is likely to be paid. This is because the dividend payout ratio (50%) applied does not take account of the additional interest payments on new loan finance that must be paid and which will reduce profits available for dividend. The higher dividend payment will have the effect of producing a more conservative funding requirement. (10 marks) The depreciation charges are calculated as follows: 2004 2005 2006 2007 2008 2009 2010 2011 2012 2013 2014 onwards £m £m £m £m £m £m £m £m £m £m £m Depr’n existing fixed assets Acquisition 2004 2005 2006 2007 2008 Total 6·7 1·6 8·3 6·7 1·6 1·1 9·4 6·7 1·6 1·1 0·5 9·9 6·7 1·6 1·1 0·5 0·5 10·4 6·7 1·6 1·1 0·5 0·5 0·7 11·1 6·7 1·6 1·1 0·5 0·5 0·7 11·1 6·7 1·6 1·1 0·5 0·5 0·7 11·1 6·7 1·6 1·1 0·5 0·5 0·7 11·1 6·7 1·6 1·1 0·5 0·5 0·7 11·1 6·7 1·6 1·1 0·5 0·5 0·7 11·1 6·7 1·6 1·1 0·5 0·5 0.7 11·1 The funding deficit in the first two years is (£27·2m + £10·9m) = £38·1m. Cash flows are 第 5 页 共 8 页
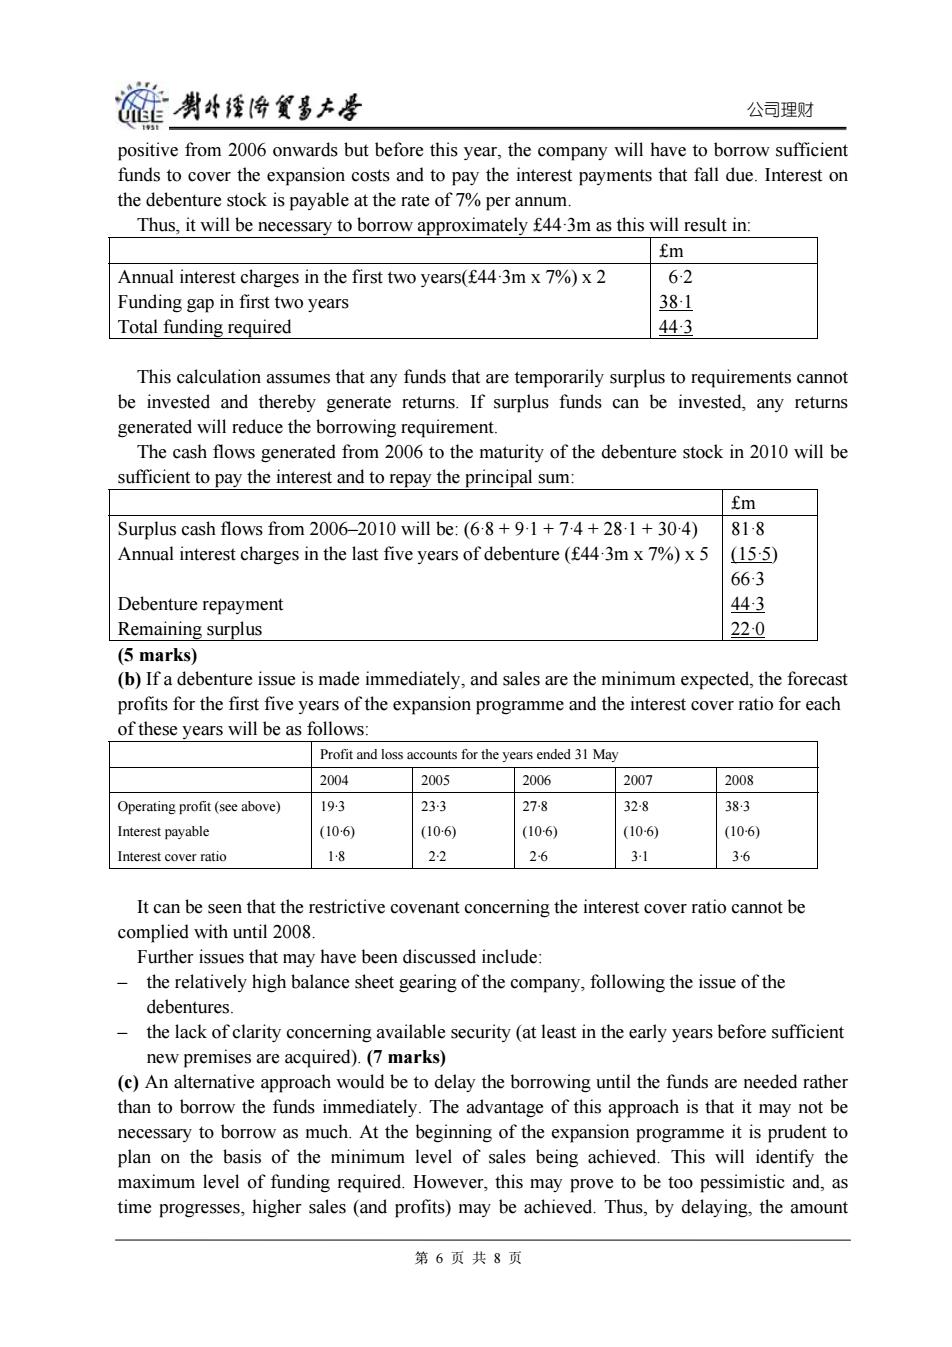
醛肖经海食多大是 公司理财 positive from 2006 onwards but before this year,the company will have to borrow sufficient funds to cover the expansion costs and to pay the interest payments that fall due.Interest on the debenture stock is payable at the rate of 7%per annum. Thus,it will be necessary to borrow approximately f44-3m as this will result in: fm Annual interest charges in the first two years(f44.3m x 7%)x 2 62 Funding gap in first two years 381 Total funding required 443 This calculation assumes that any funds that are temporarily surplus to requirements cannot be invested and thereby generate returns.If surplus funds can be invested,any returns generated will reduce the borrowing requirement. The cash flows generated from 2006 to the maturity of the debenture stock in 2010 will be sufficient to pay the interest and to repay the principal sum: fm Surplus cash flows from 2006-2010 will be:(68+9-1+74+28-1+30-4) 81-8 Annual interest charges in the last five years of debenture(f44.3m x 7%)x 5 155) 663 Debenture repayment 443 Remaining surplus 22-0 (5 marks) (b)If a debenture issue is made immediately,and sales are the minimum expected,the forecast profits for the first five years of the expansion programme and the interest cover ratio for each of these years will be as follows: Profit and loss accounts for the years ended 31 May 2004 2005 2006 2007 2008 Operating profit (see above) 193 233 27-8 32-8 383 Interest payable (106) (106) (10-6) (10-6) (10-6) Interest cover ratio 18 22 26 31 36 It can be seen that the restrictive covenant concerning the interest cover ratio cannot be complied with until 2008. Further issues that may have been discussed include: the relatively high balance sheet gearing of the company,following the issue of the debentures. the lack of clarity concerning available security (at least in the early years before sufficient new premises are acquired).(7 marks) (c)An alternative approach would be to delay the borrowing until the funds are needed rather than to borrow the funds immediately.The advantage of this approach is that it may not be necessary to borrow as much.At the beginning of the expansion programme it is prudent to plan on the basis of the minimum level of sales being achieved.This will identify the maximum level of funding required.However,this may prove to be too pessimistic and,as time progresses,higher sales (and profits)may be achieved.Thus,by delaying,the amount 第6页共8页
公司理财 positive from 2006 onwards but before this year, the company will have to borrow sufficient funds to cover the expansion costs and to pay the interest payments that fall due. Interest on the debenture stock is payable at the rate of 7% per annum. Thus, it will be necessary to borrow approximately £44·3m as this will result in: £m Annual interest charges in the first two years(£44·3m x 7%) x 2 Funding gap in first two years Total funding required 6·2 38·1 44·3 This calculation assumes that any funds that are temporarily surplus to requirements cannot be invested and thereby generate returns. If surplus funds can be invested, any returns generated will reduce the borrowing requirement. The cash flows generated from 2006 to the maturity of the debenture stock in 2010 will be sufficient to pay the interest and to repay the principal sum: £m Surplus cash flows from 2006–2010 will be: (6·8 + 9·1 + 7·4 + 28·1 + 30·4) Annual interest charges in the last five years of debenture (£44·3m x 7%) x 5 Debenture repayment Remaining surplus 81·8 (15·5) 66·3 44·3 22·0 (5 marks) (b) If a debenture issue is made immediately, and sales are the minimum expected, the forecast profits for the first five years of the expansion programme and the interest cover ratio for each of these years will be as follows: Profit and loss accounts for the years ended 31 May 2004 2005 2006 2007 2008 Operating profit (see above) Interest payable Interest cover ratio 19·3 (10·6) 1·8 23·3 (10·6) 2·2 27·8 (10·6) 2·6 32·8 (10·6) 3·1 38·3 (10·6) 3·6 It can be seen that the restrictive covenant concerning the interest cover ratio cannot be complied with until 2008. Further issues that may have been discussed include: – the relatively high balance sheet gearing of the company, following the issue of the debentures. – the lack of clarity concerning available security (at least in the early years before sufficient new premises are acquired). (7 marks) (c) An alternative approach would be to delay the borrowing until the funds are needed rather than to borrow the funds immediately. The advantage of this approach is that it may not be necessary to borrow as much. At the beginning of the expansion programme it is prudent to plan on the basis of the minimum level of sales being achieved. This will identify the maximum level of funding required. However, this may prove to be too pessimistic and, as time progresses, higher sales (and profits) may be achieved. Thus, by delaying, the amount 第 6 页 共 8 页
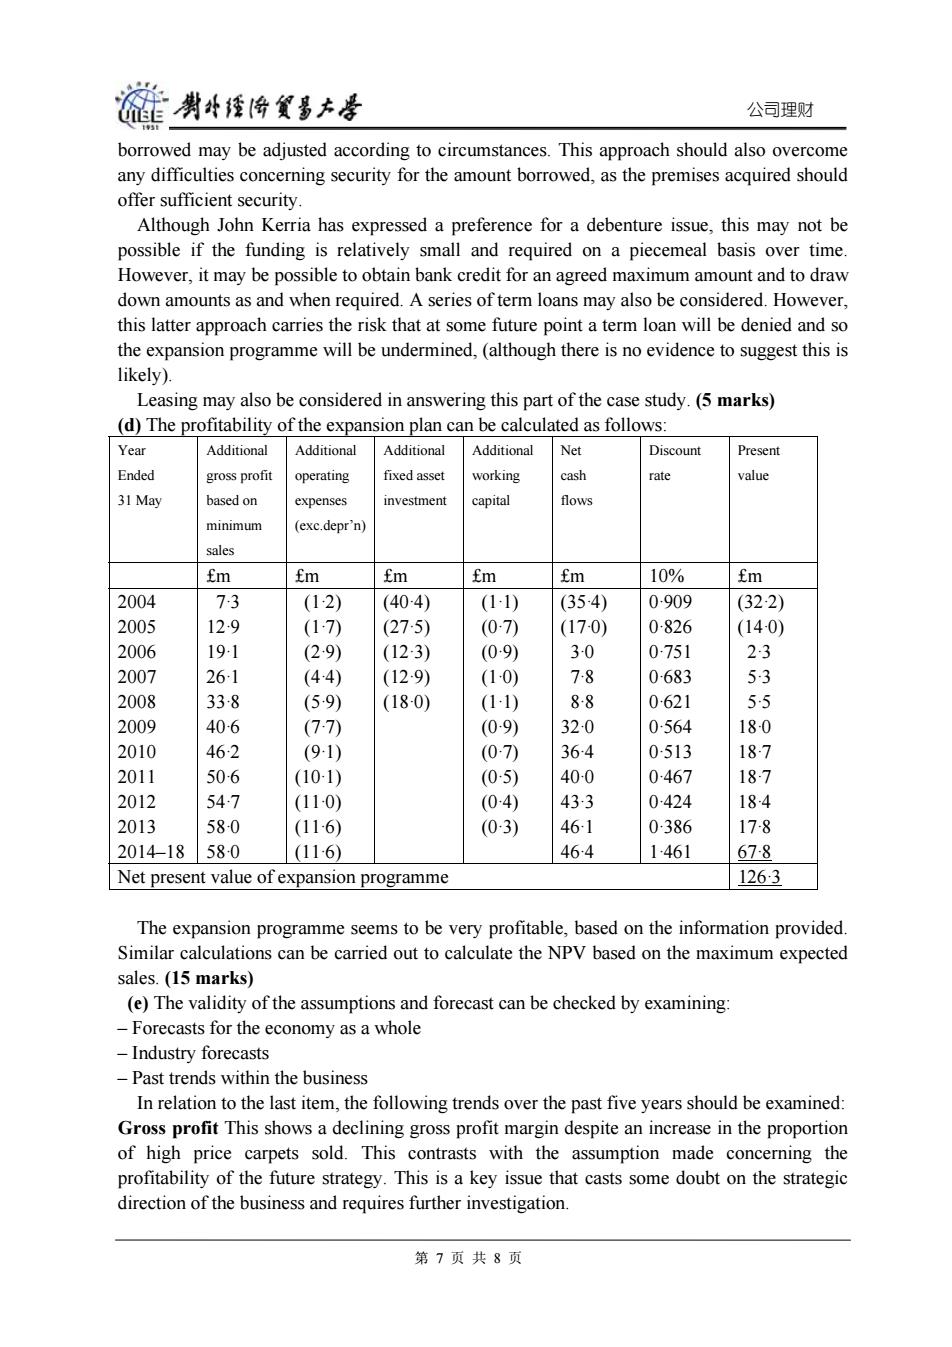
碰剥经悔贸墨大号 公司理财 borrowed may be adjusted according to circumstances.This approach should also overcome any difficulties concerning security for the amount borrowed,as the premises acquired should offer sufficient security. Although John Kerria has expressed a preference for a debenture issue,this may not be possible if the funding is relatively small and required on a piecemeal basis over time. However,it may be possible to obtain bank credit for an agreed maximum amount and to draw down amounts as and when required.A series of term loans may also be considered.However, this latter approach carries the risk that at some future point a term loan will be denied and so the expansion programme will be undermined,(although there is no evidence to suggest this is likely). Leasing may also be considered in answering this part of the case study.(5 marks) (d)The profitability of the expansion plan can be calculated as follows: Year Additional Additional Additional Additional Net Discount Present Ended gross profit operating fixed asset working cash rate value 31 May based on expenses investment capital flows minimum (exc.depr'n) sales fm fm fm fm m 10% £m 2004 73 (12) (404) (11) (354) 0909 (32-2) 2005 129 (17) (27-5) (07) (17-0) 0-826 (14-0) 2006 191 (29) (12-3) (09) 3-0 0751 23 2007 261 (44) (12·9) (10) 78 0-683 53 2008 338 (5·9) (18-0) (11) 88 0-621 55 2009 40-6 (7-7) (09) 32-0 0564 18-0 2010 462 (91) (07) 364 0513 187 2011 50-6 (10-1) (05) 40-0 0467 18-7 2012 547 (110) (04) 433 0424 184 2013 580 (116) (03) 461 0386 17-8 2014-18 580 (11-6) 464 1461 678 Net present value of expansion programme 1263 The expansion programme seems to be very profitable,based on the information provided. Similar calculations can be carried out to calculate the NPV based on the maximum expected sales.(15 marks) (e)The validity of the assumptions and forecast can be checked by examining: Forecasts for the economy as a whole -Industry forecasts -Past trends within the business In relation to the last item,the following trends over the past five years should be examined: Gross profit This shows a declining gross profit margin despite an increase in the proportion of high price carpets sold.This contrasts with the assumption made concerning the profitability of the future strategy.This is a key issue that casts some doubt on the strategic direction of the business and requires further investigation. 第7页共8页
公司理财 borrowed may be adjusted according to circumstances. This approach should also overcome any difficulties concerning security for the amount borrowed, as the premises acquired should offer sufficient security. Although John Kerria has expressed a preference for a debenture issue, this may not be possible if the funding is relatively small and required on a piecemeal basis over time. However, it may be possible to obtain bank credit for an agreed maximum amount and to draw down amounts as and when required. A series of term loans may also be considered. However, this latter approach carries the risk that at some future point a term loan will be denied and so the expansion programme will be undermined, (although there is no evidence to suggest this is likely). Leasing may also be considered in answering this part of the case study. (5 marks) (d) The profitability of the expansion plan can be calculated as follows: Year Ended 31 May Additional gross profit based on minimum sales Additional operating expenses (exc.depr’n) Additional fixed asset investment Additional working capital Net cash flows Discount rate Present value £m £m £m £m £m 10% £m 2004 2005 2006 2007 2008 2009 2010 2011 2012 2013 2014–18 7·3 12·9 19·1 26·1 33·8 40·6 46·2 50·6 54·7 58·0 58·0 (1·2) (1·7) (2·9) (4·4) (5·9) (7·7) (9·1) (10·1) (11·0) (11·6) (11·6) (40·4) (27·5) (12·3) (12·9) (18·0) (1·1) (0·7) (0·9) (1·0) (1·1) (0·9) (0·7) (0·5) (0·4) (0·3) (35·4) (17·0) 3·0 7·8 8·8 32·0 36·4 40·0 43·3 46·1 46·4 0·909 0·826 0·751 0·683 0·621 0·564 0·513 0·467 0·424 0·386 1·461 (32·2) (14·0) 2·3 5·3 5·5 18·0 18·7 18·7 18·4 17·8 67·8 Net present value of expansion programme 126·3 The expansion programme seems to be very profitable, based on the information provided. Similar calculations can be carried out to calculate the NPV based on the maximum expected sales. (15 marks) (e) The validity of the assumptions and forecast can be checked by examining: – Forecasts for the economy as a whole – Industry forecasts – Past trends within the business In relation to the last item, the following trends over the past five years should be examined: Gross profit This shows a declining gross profit margin despite an increase in the proportion of high price carpets sold. This contrasts with the assumption made concerning the profitability of the future strategy. This is a key issue that casts some doubt on the strategic direction of the business and requires further investigation. 第 7 页 共 8 页

碰剥经悔贸昌大是 公司理财 Operating expenses This shows a much higher percentage of operating expenses to sales ratio than is being forecast for the expansion plan. Working capital needs This is currently lower than the forecast figure of 10%of additional sales. Sales The minimum predicted increase in sales over the next ten years is less than the increase in sales achieved over the past five years.The maximum predicted increase in sales is also less than the increase in sales achieved over the past five years. The main concern seems to be the assumptions regarding gross profit and operating expenses, which may require further examination. (8 marks) 第8页共8页
公司理财 Operating expenses This shows a much higher percentage of operating expenses to sales ratio than is being forecast for the expansion plan. Working capital needs This is currently lower than the forecast figure of 10% of additional sales. Sales The minimum predicted increase in sales over the next ten years is less than the increase in sales achieved over the past five years. The maximum predicted increase in sales is also less than the increase in sales achieved over the past five years. The main concern seems to be the assumptions regarding gross profit and operating expenses, which may require further examination. (8 marks) 第 8 页 共 8 页