MATLAB REFERENCE CARD I Variable Assignment Variable Information x=[1,2,3,4..]: Defines a row vector x (horizontal) length(x) Length of vector x or longest matrix dimension x=[12;34..1i Defines a column vector x(vertical) s size(x) If x is a 5 x 4 matrix,s becomes the vector [5,4] a:c size(x,c) The size of the Bb:c The range o tto [a,asb,...c-b,c] numel(x) lements inx(can be any dimension) ce(a,c,n) zeros(m.n Matrix Computations ones(m,n) An m xn matrix of ones rand(s,n) An mxnmatrix of uniformly distributed random numbersE[-1.+1] a+b Adds matrices a and b together,or any scalar b to all elements in a 3-5 a'b ent-wis esmatricesaandb(they must be the same size) Variable Indexing a./b Element-wise divides matrices a and b(they must be the same size) a/b Matrix divides,roughly equal to a*inv(b) Vectors a.b Element-wise power operation:a to the power of b 8 Math Operations x(end) Lastelement sin,cos,tan,asin,acos,atan,log.10g10,exp,sqrt.... x(1:n) First n elements Stand. Last n+1 elements sum(x) ofx,along the dimension c ×(x>0&x<9) All elements of x between 0 and 9 diff(x) Difference between every element of x(yields length n-1) Matrices cumsum(x) Cumulative sum of the elements inx x(i,j) mean(x) Meana0teeenerd x() All of Row i of x with ha x(:,) All of Column j real(x) Real part of all elements in x ×(1:m, First m rows imag(x) Imaginary part of all elements in x Firstn columns abs(x) Absolute value,or magnitude if x is complex x) us (remair Variable Manipulation Constants Removes elementnfrom variable iorj e of x(matters for imaginary data) X The non- conjugate transpose of x NaN max(x)min(x) Greatest element in vector x sm allest element in vector x exp(1) 2.7182818284590..Natural logarithm base t(x)max(x) t greatest elemer Equalities Logical Operators sort(x,c) orts the elements in matrix x along the rt dimension Less than Retums all unique values of x,sorted in ascending order Greater than Retums indices where x is equal to a Not equal to Cta etums the c (must have same nume1) d (element (element-wise) value any(...) true if any result in an element-wise expression is true a11(..) true if all results of an element-wise expression are true 2016 lesse Knight based on MATA Reference Cards by Thomas Pingel,Dept of Geography,Northern linois University,&Carly Fennell,School of Engineering University of Guelph
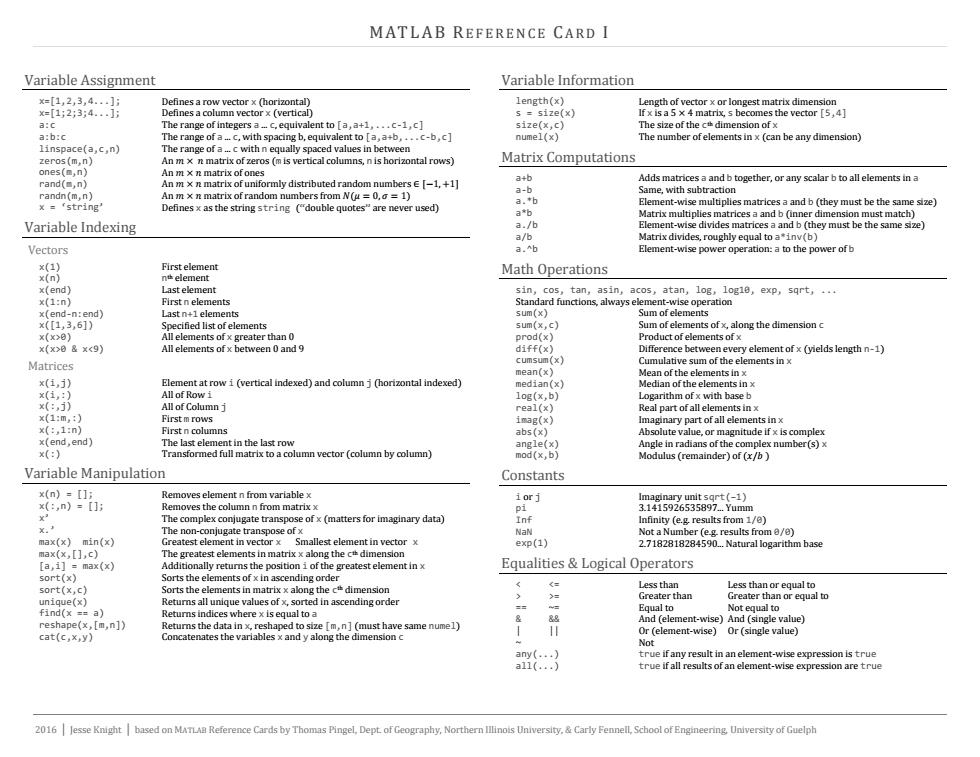
M AT L A B RE F E R E N C E C A R D I 2016 | Jesse Knight | based on MATLAB Reference Cards by Thomas Pingel, Dept. of Geography, Northern Illinois University, & Carly Fennell, School of Engineering, University of Guelph Variable Assignment x=[1,2,3,4...]; Defines a row vector x (horizontal) x=[1;2;3;4...]; Defines a column vector x (vertical) a:c The range of integers a ... c, equivalent to [a,a+1,...c-1,c] a:b:c The range of a ... c, with spacing b, equivalent to [a,a+b,...c-b,c] linspace(a,c,n) The range of a ... c with n equally spaced values in between zeros(m,n) An 𝑚 × 𝑛 matrix of zeros (m is vertical columns, n is horizontal rows) ones(m,n) An 𝑚 × 𝑛 matrix of ones rand(m,n) An 𝑚 × 𝑛 matrix of uniformly distributed random numbers ∈ [−1, +1] randn(m,n) An 𝑚 × 𝑛 matrix of random numbers from 𝑁(𝜇 = 0, 𝜎 = 1) x = ‘string’ Defines x as the string string (“double quotes” are never used) Variable Indexing Vectors x(1) First element x(n) nth element x(end) Last element x(1:n) First n elements x(end-n:end) Last n+1 elements x([1,3,6]) Specified list of elements x(x>0) All elements of x greater than 0 x(x>0 & x >= Greater than Greater than or equal to == ~= Equal to Not equal to & && And (element-wise) And (single value) | || Or (element-wise) Or (single value) ~ Not any(...) true if any result in an element-wise expression is true all(...) true if all results of an element-wise expression are true

MATLAB REFERENCE CARD II Documentation Scripting funcon how to use t Workspace d(sth(str) are also callable) CTRL+C bles in the workspace clear x e Formatting Output save(name)except x sprintf(fat.vars... Saves the varlable(nd ts exe Loads the arable(and possibly others)from the file nae Figures Programming Constructs ure(o re nu ber n ane dle to it Structs:Can g ubplot(m,n,k) as h=su ot(. function fouti out2. 1 yfun(argl,arg2 h:eprop>',x) function.. print- depsc2 f1.eps the e.epg if(..) Plotting elseif(...) d as false. plot(y) only the value e is tre. e15e(.) (v)hut ted "stems end hist( .n) case (... Images iread(str) end Iso that ax(I()) e and min( for 1:n sI to the file na med hot (. ile (.. While oop:repea end 2016|lesse based on Reference Cards by Thomas Pipgel Dent of
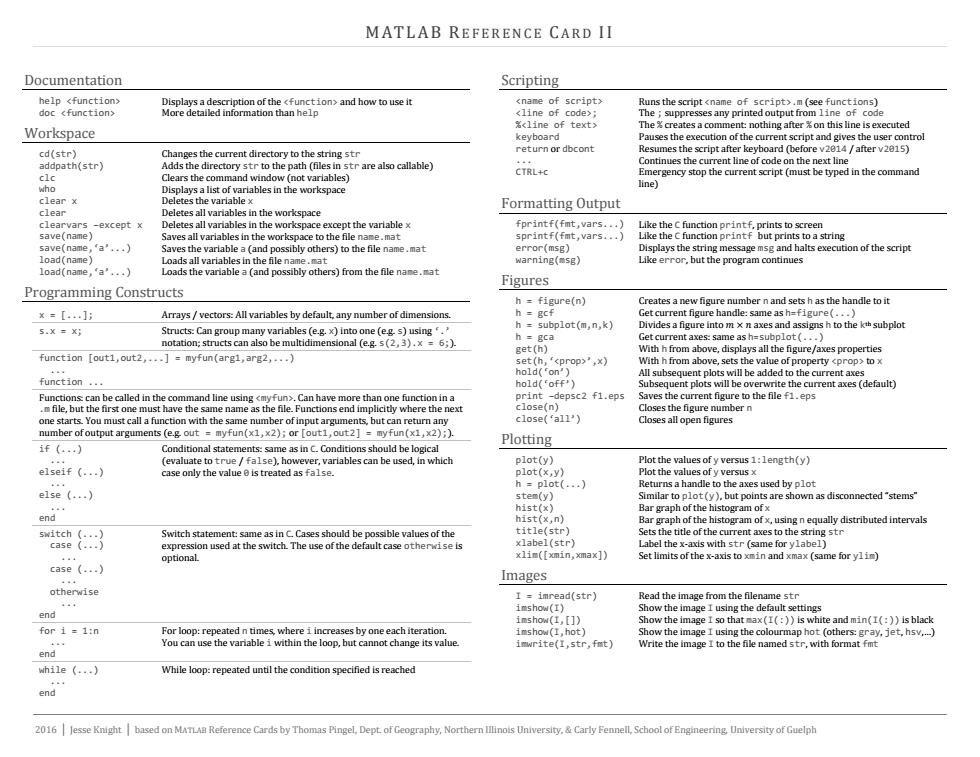
M AT L A B RE F E R E N C E C A R D I I 2016 | Jesse Knight | based on MATLAB Reference Cards by Thomas Pingel, Dept. of Geography, Northern Illinois University, & Carly Fennell, School of Engineering, University of Guelph Documentation help Displays a description of the and how to use it doc More detailed information than help Workspace cd(str) Changes the current directory to the string str addpath(str) Adds the directory str to the path (files in str are also callable) clc Clears the command window (not variables) who Displays a list of variables in the workspace clear x Deletes the variable x clear Deletes all variables in the workspace clearvars –except x Deletes all variables in the workspace except the variable x save(name) Saves all variables in the workspace to the file name.mat save(name,‘a’...) Saves the variable a (and possibly others) to the file name.mat load(name) Loads all variables in the file name.mat load(name,‘a’...) Loads the variable a (and possibly others) from the file name.mat Programming Constructs x = [...]; Arrays / vectors: All variables by default, any number of dimensions. s.x = x; Structs: Can group many variables (e.g. x) into one (e.g. s) using ‘.’ notation; structs can also be multidimensional (e.g. s(2,3).x = 6;). function [out1,out2,...] = myfun(arg1,arg2,...) ... function ... Functions: can be called in the command line using . Can have more than one function in a .m file, but the first one must have the same name as the file. Functions end implicitly where the next one starts. You must call a function with the same number of input arguments, but can return any number of output arguments (e.g. out = myfun(x1,x2); or [out1,out2] = myfun(x1,x2);). if (...) ... elseif (...) ... else (...) ... end Conditional statements: same as in C. Conditions should be logical (evaluate to true / false), however, variables can be used, in which case only the value 0 is treated as false. switch (...) case (...) ... case (...) ... otherwise ... end Switch statement: same as in C. Cases should be possible values of the expression used at the switch. The use of the default case otherwise is optional. for i = 1:n ... end For loop: repeated n times, where i increases by one each iteration. You can use the variable i within the loop, but cannot change its value. while (...) ... end While loop: repeated until the condition specified is reached Scripting Runs the script .m (see functions) ; The ; suppresses any printed output from line of code % The % creates a comment: nothing after % on this line is executed keyboard Pauses the execution of the current script and gives the user control return or dbcont Resumes the script after keyboard (before v2014 / after v2015) ... Continues the current line of code on the next line CTRL+c Emergency stop the current script (must be typed in the command line) Formatting Output fprintf(fmt,vars...) Like the C function printf, prints to screen sprintf(fmt,vars...) Like the C function printf but prints to a string error(msg) Displays the string message msg and halts execution of the script warning(msg) Like error, but the program continues Figures h = figure(n) Creates a new figure number n and sets h as the handle to it h = gcf Get current figure handle: same as h=figure(...) h = subplot(m,n,k) Divides a figure into 𝑚 × 𝑛 axes and assigns h to the kth subplot h = gca Get current axes: same as h=subplot(...) get(h) With h from above, displays all the figure/axes properties set(h,‘’,x) With h from above, sets the value of property to x hold(‘on’) All subsequent plots will be added to the current axes hold(‘off’) Subsequent plots will be overwrite the current axes (default) print –depsc2 f1.eps Saves the current figure to the file f1.eps close(n) Closes the figure number n close(‘all’) Closes all open figures Plotting plot(y) Plot the values of y versus 1:length(y) plot(x,y) Plot the values of y versus x h = plot(...) Returns a handle to the axes used by plot stem(y) Similar to plot(y), but points are shown as disconnected “stems” hist(x) Bar graph of the histogram of x hist(x,n) Bar graph of the histogram of x, using n equally distributed intervals title(str) Sets the title of the current axes to the string str xlabel(str) Label the x-axis with str (same for ylabel) xlim([xmin,xmax]) Set limits of the x-axis to xmin and xmax (same for ylim) Images I = imread(str) Read the image from the filename str imshow(I) Show the image I using the default settings imshow(I,[]) Show the image I so that max(I(:)) is white and min(I(:)) is black imshow(I,hot) Show the image I using the colourmap hot (others: gray, jet, hsv,…) imwrite(I,str,fmt) Write the image I to the file named str, with format fmt