
CHAPTER Eight Economic Growth Technological progress macroeconomics N.Gregory Mankiw College of Management,HUST
macroeconomics N. Gregory Mankiw macro College of Management, HUST CHAPTER Eight Economic Growth : Technological progress
Learning objectives Technological progress in the Solow model Policies to promote growth Endogenous growth: Two simple models in which the rate of technological progress is endogenous CHAPTER 5 Economic Growth Il slide 1
CHAPTER 5 Economic Growth II slide 1 Learning objectives ▪ Technological progress in the Solow model ▪ Policies to promote growth ▪ Endogenous growth: Two simple models in which the rate of technological progress is endogenous
Content 1.Technological progress in Solow model 2.Policies to promote growth 2.1 Evaluating the saving rate 2.2 Policies to promote saving rate 2.3 Allocating the economy's investment 2.4 Encouraging technological progress 3.Endogenous growth theory 3.1 Basic model 3.2 Two sector model 4.Chapter summary CHAPTER 5 Economic Growth ll slide 2
CHAPTER 5 Economic Growth II slide 2 Content 1. Technological progress in Solow model 2. Policies to promote growth 2.1 Evaluating the saving rate 2.2 Policies to promote saving rate 2.3 Allocating the economy’s investment 2.4 Encouraging technological progress 3. Endogenous growth theory 3.1 Basic model 3.2 Two sector model 4. Chapter summary
Introduction In the Solow model of Chapter 4, the production technology is held constant income per capita is constant in the steady state. Neither point is true in the real world: 1929-2001:U.S.real GDP per person grew by a factor of 4.8,or 2.2%per year. examples of technological progress abound (see next slide) CHAPTER 5 Economic Growth ll slide 3
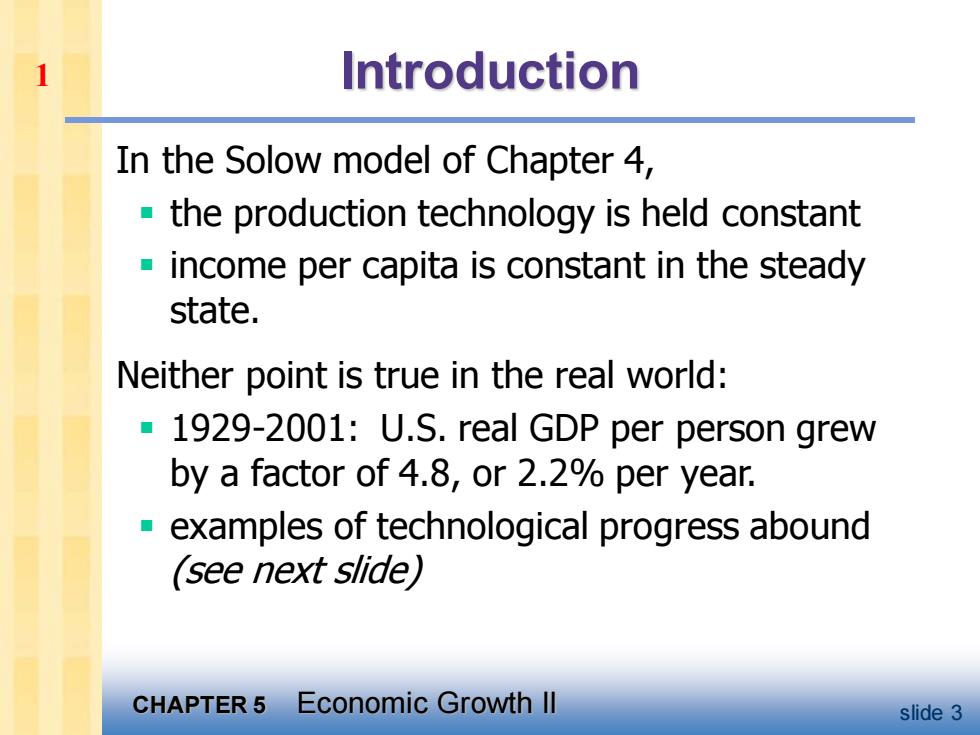
CHAPTER 5 Economic Growth II slide 3 Introduction In the Solow model of Chapter 4, ▪ the production technology is held constant ▪ income per capita is constant in the steady state. Neither point is true in the real world: ▪ 1929-2001: U.S. real GDP per person grew by a factor of 4.8, or 2.2% per year. ▪ examples of technological progress abound (see next slide) 1
Examples of technological progress ■ 1970:50,000 computers in the world 2000:51%of U.S.households have 1 or more computers -The real price of computer power has fallen an average of 30%per year over the past three decades. The average car built in 1996 contained more computer processing power than the first lunar landing craft in 1969. Modems are 22 times faster today than two decades ago. 1981:213 computers connected to the Internet 2000:60 million computers connected to the Internet CHAPTER 5 Economic Growth Il slide 4
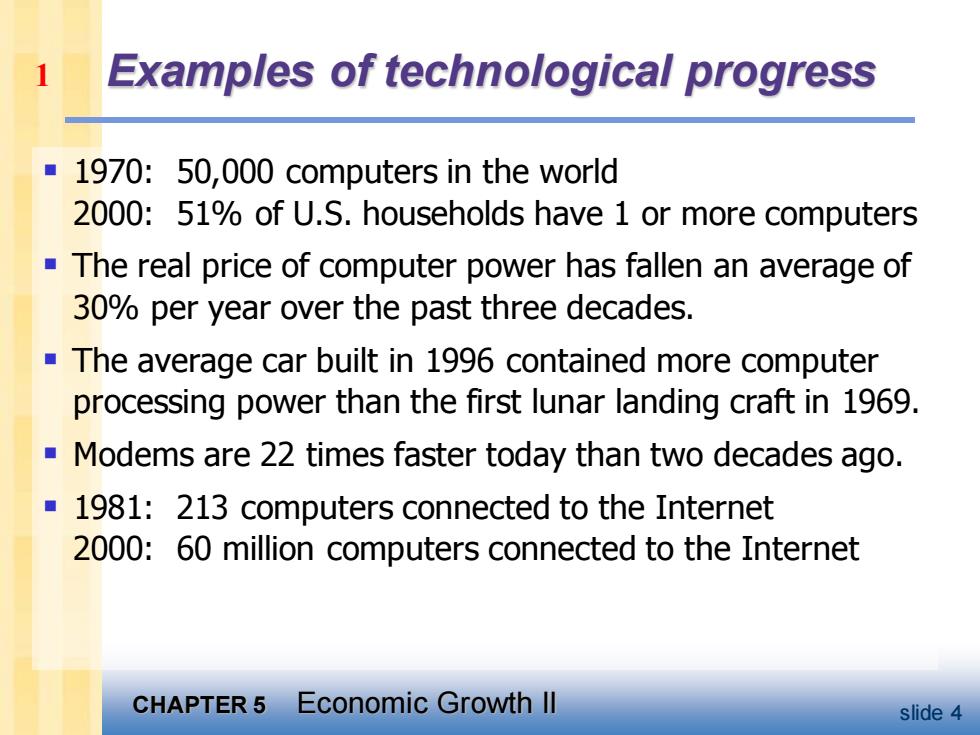
CHAPTER 5 Economic Growth II slide 4 Examples of technological progress ▪ 1970: 50,000 computers in the world 2000: 51% of U.S. households have 1 or more computers ▪ The real price of computer power has fallen an average of 30% per year over the past three decades. ▪ The average car built in 1996 contained more computer processing power than the first lunar landing craft in 1969. ▪ Modems are 22 times faster today than two decades ago. ▪ 1981: 213 computers connected to the Internet 2000: 60 million computers connected to the Internet 1
Tech.progress in the Solow model A new variable:E=labor efficiency Assume: Technological progress is labor-augmenting: it increases labor efficiency at the exogenous rate g. △E E CHAPTER 5 Economic Growth ll slide 5
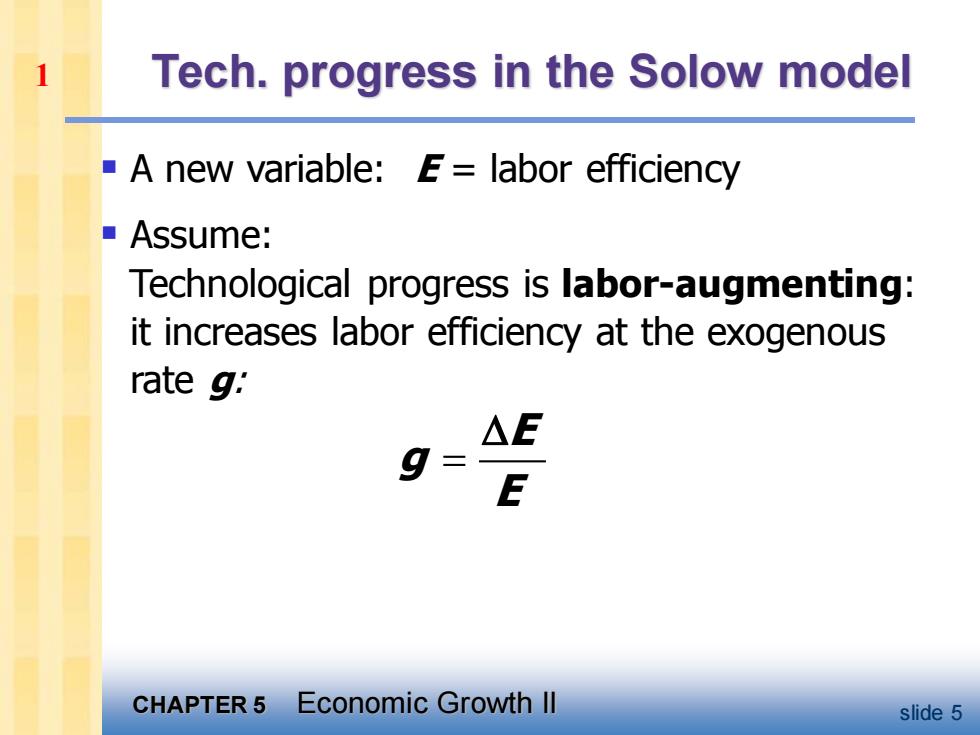
CHAPTER 5 Economic Growth II slide 5 Tech. progress in the Solow model ▪ A new variable: E = labor efficiency ▪ Assume: Technological progress is labor-augmenting: it increases labor efficiency at the exogenous rate g: E g E = 1
1 Tech.progress in the Solow model -We now write the production function as: Y=F(K,L×E) where LxE the number of effective workers. Hence,increases in labor efficiency have the same effect on output as increases in the labor force. CHAPTER 5 Economic Growth ll slide 6
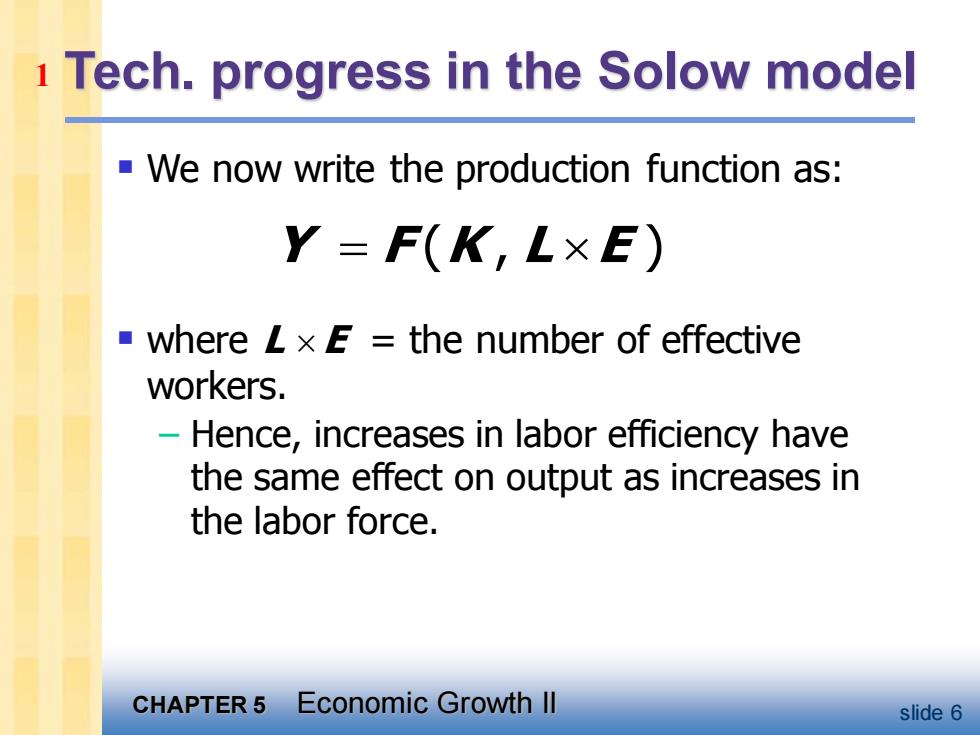
CHAPTER 5 Economic Growth II slide 6 Tech. progress in the Solow model ▪ We now write the production function as: ▪ where L E = the number of effective workers. – Hence, increases in labor efficiency have the same effect on output as increases in the labor force. Y F K L E = ( , ) 1

1 Tech.progress in the Solow model ■Notation: y=YLE output per effective worker k=KLE capital per effective worker Production function per effective worker: y=f(k) -Saving and investment per effective worker: sy=sf(k) CHAPTER 5 Economic Growth Il slide 7
CHAPTER 5 Economic Growth II slide 7 Tech. progress in the Solow model ▪ Notation: y = Y/LE = output per effective worker k = K/LE = capital per effective worker ▪ Production function per effective worker: y = f(k) ▪ Saving and investment per effective worker: s y = s f(k) 1
1 Tech.progress in the Solow model (+n+g)k break-even investment: the amount of investment necessary to keep k constant. Consists of: k to replace depreciating capital n to provide capital for new workers gk to provide capital for the new "effective"workers created by technological progress CHAPTER 5 Economic Growth ll slide 8
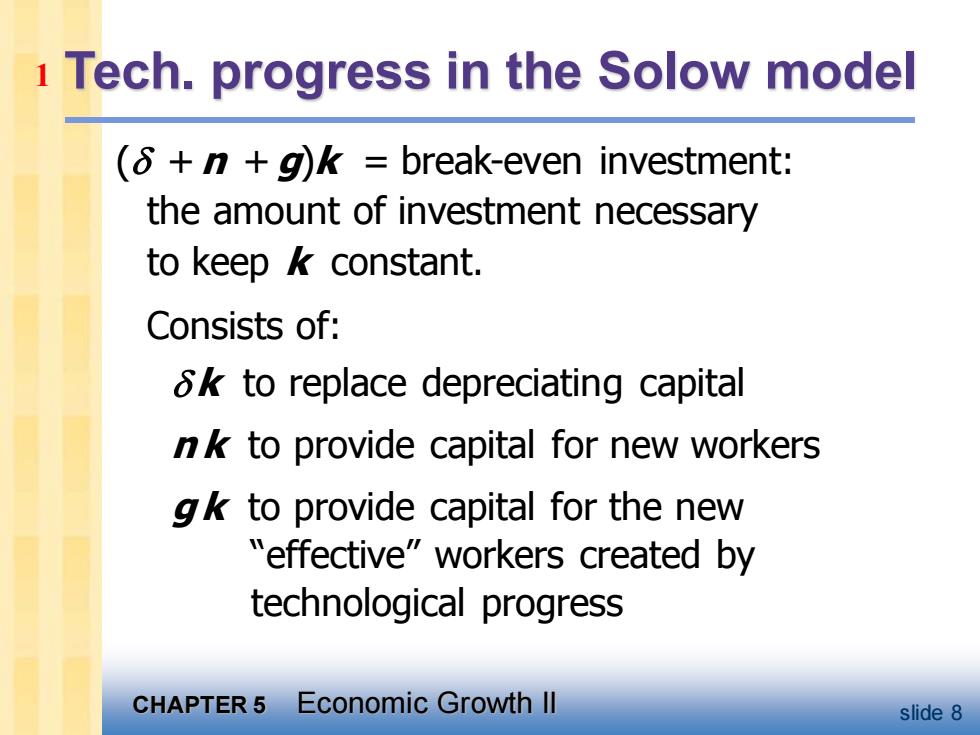
CHAPTER 5 Economic Growth II slide 8 Tech. progress in the Solow model ( + n + g)k = break-even investment: the amount of investment necessary to keep k constant. Consists of: k to replace depreciating capital n k to provide capital for new workers gk to provide capital for the new “effective” workers created by technological progress 1
i Tech.progress in the Solow model Investment, △k=sfk)-(6+n+g)k break-even investment (6+n+g)k sf(k) K* Capital per worker,k CHAPTER 5 Economic Growth ll slide 9
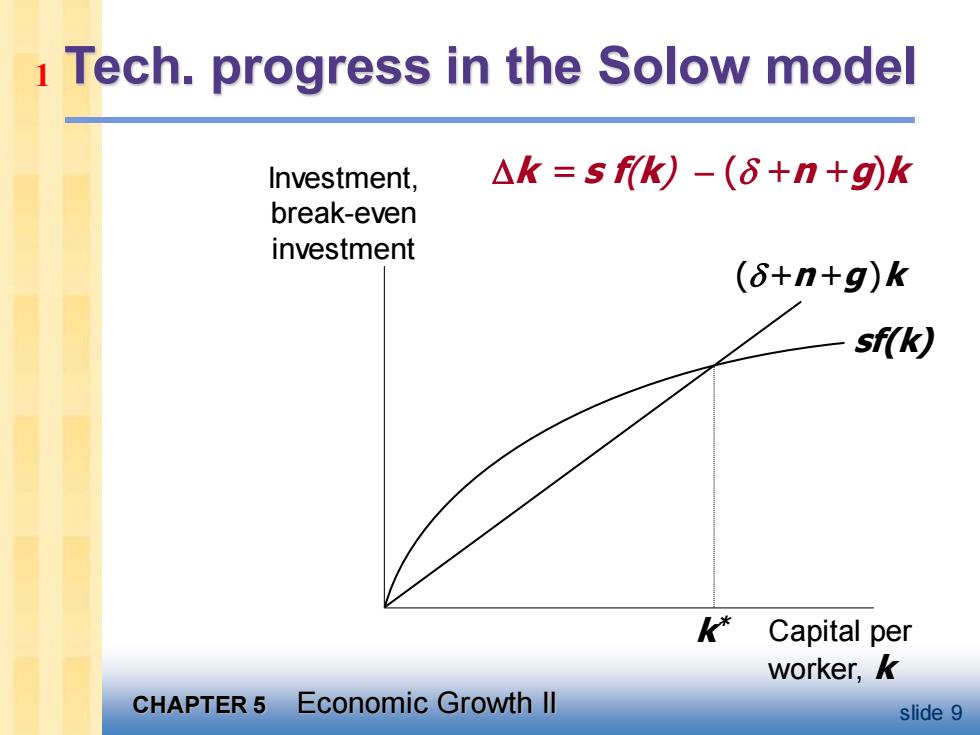
CHAPTER 5 Economic Growth II slide 9 Tech. progress in the Solow model Investment, break-even investment Capital per worker, k sf(k) ( +n +g)k k * k = s f(k) − ( +n +g)k 1