Lecture 6 Establishing Causality Between Biomedical Signals IEEE TRANSACTIONS ON BIOMEDICAL ENGINEERING,VOL.54,NO.12,pp.2214- 2222 DECEMBER 2007
Lecture 6 Establishing Causality Between Biomedical Signals IEEE TRANSACTIONS ON BIOMEDICAL ENGINEERING, VOL. 54, NO. 12, pp. 2214- 2222 DECEMBER 2007
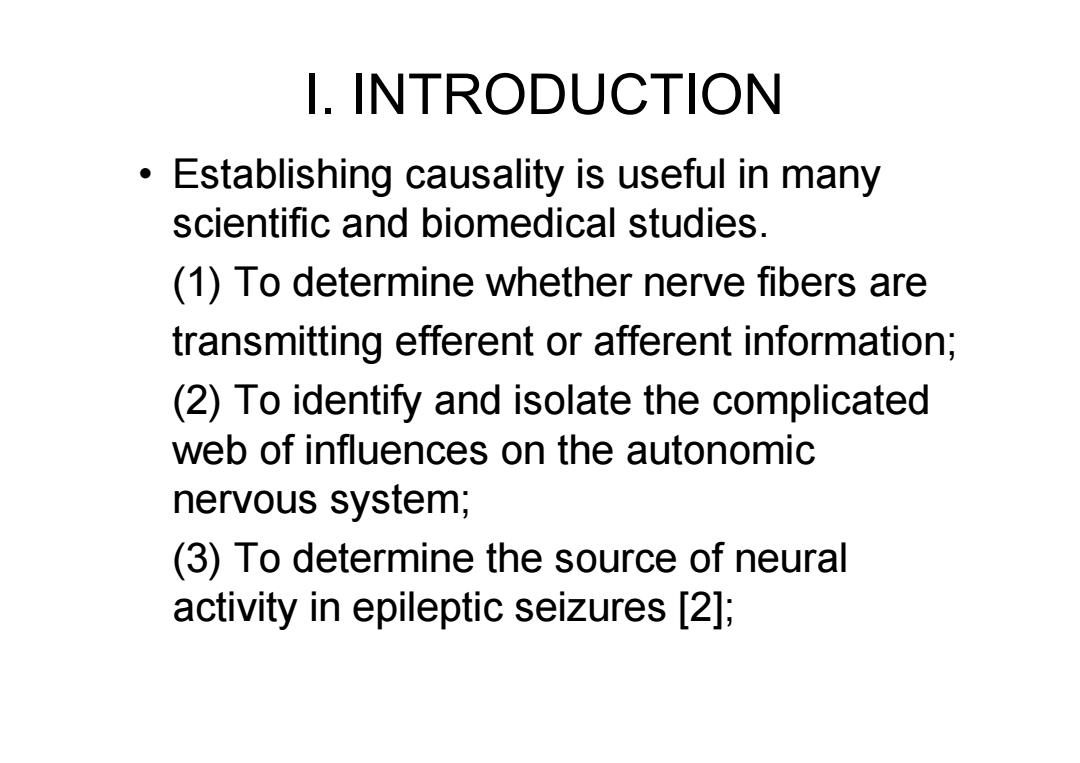
I.INTRODUCTION Establishing causality is useful in many scientific and biomedical studies. (1)To determine whether nerve fibers are transmitting efferent or afferent information; (2)To identify and isolate the complicated web of influences on the autonomic nervous system; (3)To determine the source of neural activity in epileptic seizures [2];
I. INTRODUCTION • Establishing causality is useful in many scientific and biomedical studies. (1) To determine whether nerve fibers are transmitting efferent or afferent information; (2) To identify and isolate the complicated web of influences on the autonomic nervous system; (3) To determine the source of neural activity in epileptic seizures [2];
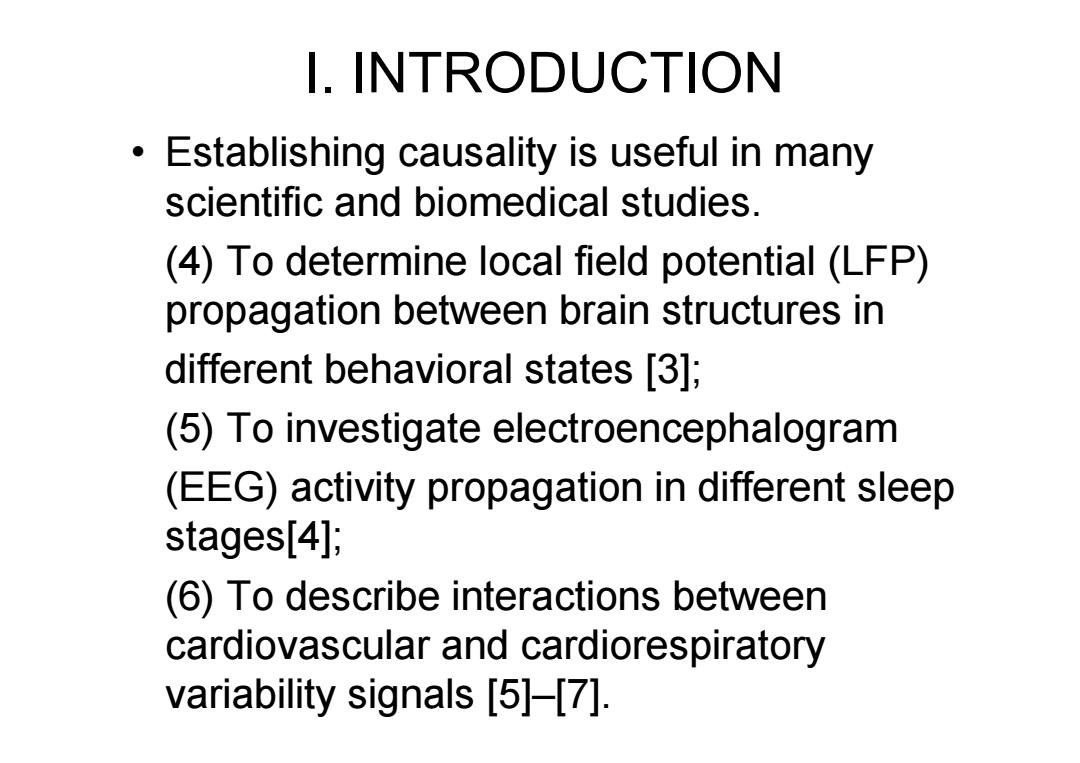
I.INTRODUCTION Establishing causality is useful in many scientific and biomedical studies. (4)To determine local field potential (LFP) propagation between brain structures in different behavioral states [3]; (5)To investigate electroencephalogram (EEG)activity propagation in different sleep stages[4]; (6)To describe interactions between cardiovascular and cardiorespiratory variability signals [5]-[7]
I. INTRODUCTION • Establishing causality is useful in many scientific and biomedical studies. (4) To determine local field potential (LFP) propagation between brain structures in different behavioral states [3]; (5) To investigate electroencephalogram (EEG) activity propagation in different sleep stages[4]; (6) To describe interactions between cardiovascular and cardiorespiratory variability signals [5]–[7]
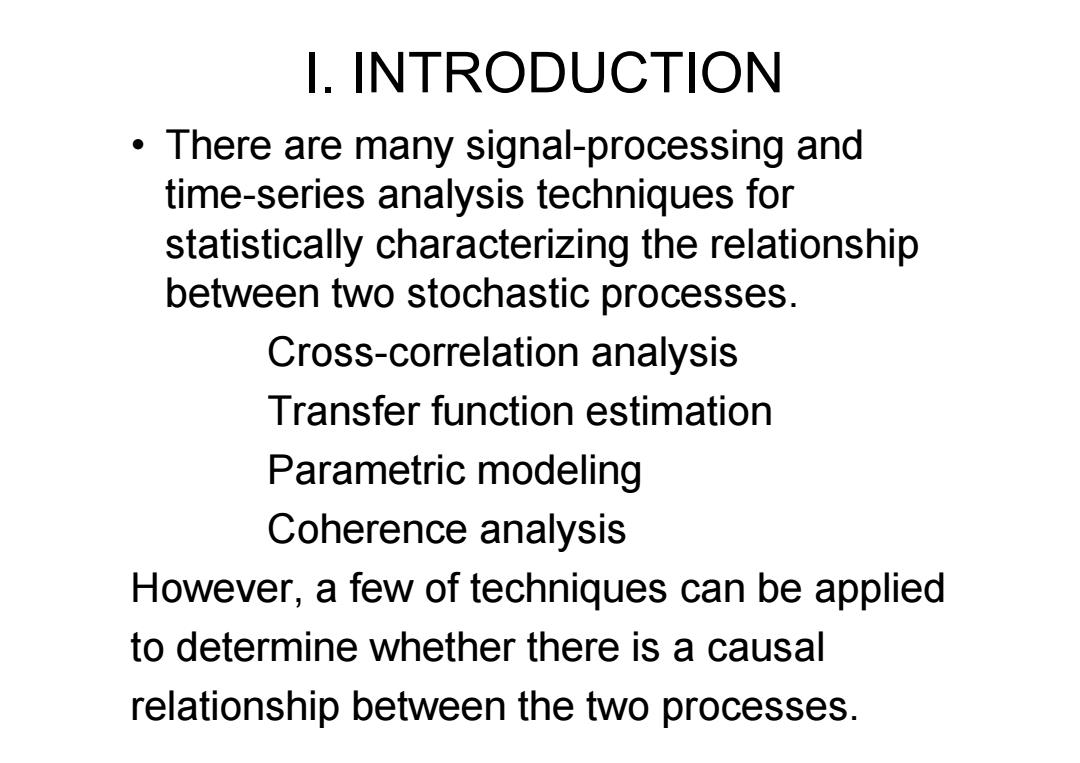
I.INTRODUCTION There are many signal-processing and time-series analysis techniques for statistically characterizing the relationship between two stochastic processes. Cross-correlation analysis Transfer function estimation Parametric modeling Coherence analysis However,a few of techniques can be applied to determine whether there is a causal relationship between the two processes
I. INTRODUCTION • There are many signal-processing and time-series analysis techniques for statistically characterizing the relationship between two stochastic processes. Cross-correlation analysis Transfer function estimation Parametric modeling Coherence analysis However, a few of techniques can be applied to determine whether there is a causal relationship between the two processes
I.INTRODUCTION To determine whether there is a causal relationship. (1)Wiener recognized the importance of the temporal ordering in the inference of casual relations from a pure statistical point of view [8]. (2)Granger's causality measure based on vector autoregressive models [9]and improved Granger methods
I. INTRODUCTION To determine whether there is a causal relationship. (1) Wiener recognized the importance of the temporal ordering in the inference of casual relations from a pure statistical point of view [8]. (2) Granger’s causality measure based on vector autoregressive models [9] and improved Granger methods
I.INTRODUCTION Causality cannot generally be determined from Signal analysis alone; However,we may be able to statistically distinguish between several possible causal relationships with cross-correlation analysis
I. INTRODUCTION Causality cannot generally be determined from Signal analysis alone; However, we may be able to statistically distinguish between several possible causal relationships with cross-correlation analysis
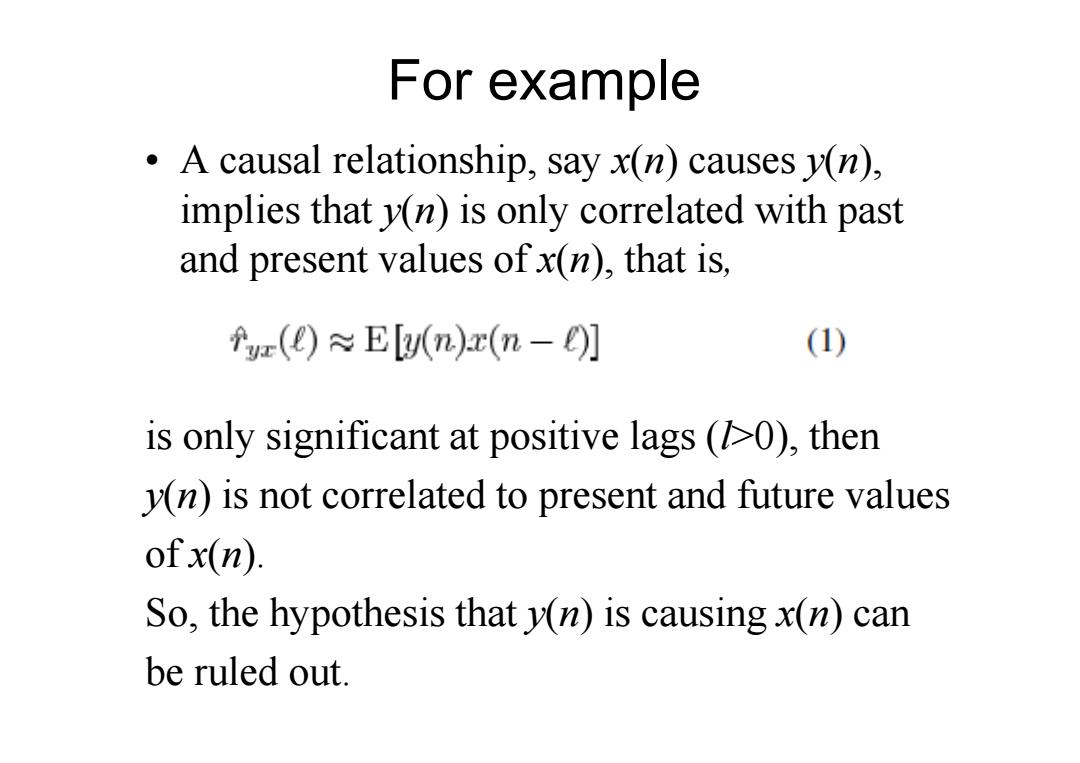
For example A causal relationship,say x(n)causes v(n), implies that y(n)is only correlated with past and present values ofx(n),that is, fa()≈E[n)x(n-)] (1) is only significant at positive lags (10),then v(n)is not correlated to present and future values ofx(n). So,the hypothesis that y(n)is causing x(n)can be ruled out
For example • A causal relationship, say x(n) causes y(n), implies that y(n) is only correlated with past and present values of x(n), that is, is only significant at positive lags (l>0), then y(n) is not correlated to present and future values of x(n). So, the hypothesis that y(n) is causing x(n) can be ruled out
I.INTRODUCTION However,if the processes are correlated at both positive and negative lags,then the processes do not have a clear causal relationship and we cannot make any conclusions. Unfortunately,this often occurs even when the processes are known to have a simple causal relationship
I. INTRODUCTION • However, if the processes are correlated at both positive and negative lags, then the processes do not have a clear causal relationship and we cannot make any conclusions. • Unfortunately, this often occurs even when the processes are known to have a simple causal relationship
The exsiting causality analysis methods (1)Wiener's pure statistical point of view [8]. (2)Granger's causality measure based on vector auto regressive models. (3)Saito decomposed coherence into two directed coherencies. (4)Baccala introduced partial directed coherence based on Saito's directed coherence(DC). (5)Kaminski proposed a multivariate spectral measure called the directed transfer function (DTF)[12]. (6)Group delay
The exsiting causality analysis methods (1) Wiener’s pure statistical point of view [8]. (2) Granger’s causality measure based on vector auto regressive models. (3) Saito decomposed coherence into two directed coherencies. (4) Baccala introduced partial directed coherence based on Saito’s directed coherence(DC). (5) Kaminski proposed a multivariate spectral measure called the directed transfer function (DTF)[12]. (6) Group delay

About the delay method The statistically model of the signals: x(n)=s(n)+v(n) (2) y(n)=As(n-d)+w(n) (3) x(n),y(n):observed signals; v(n),w(n):mutually uncorrelated white noise processes. s(n):original signal.d:the delay of interest
About the delay method • The statistically model of the signals: x(n) , y(n): observed signals; v(n),w(n): mutually uncorrelated white noise processes. s(n): original signal. d: the delay of interest