2018/4/27 国上活大坐 Overview of Lectures 国上清大学 Course Code:AV314 0.Overview 14/15 Performance(a,b) Term:Undergraduate,Third year Spring Term 16.Aircraft certification Credit:3 2.Overall configuration 17.Aviation economics Hours:51 weight estimation 18.System integration and d weight estimation configuration management Fuselage design 19.Multidisciplinary design 6/7/8 Aerodynamic design(a,b,c) ootimization Aircraft Design (飞行器设计) .hat and ing 20.Military aircraft design-overview 21.Environmental issues 10.Landing gear and Aircraft systems 22.Design skills 11.Power plant Wenbin Song 12.Stability and control School of Aeronautics and Astronautics 13.Loads,materials and structures Shanghai Jiao Tong University swb@sjtu.edu.cn ertin ong Song Performance Topics 圆上清文大些 Overview 国上道大坐 Role of performance analysis Aircraft performance analysis treat aircraft as a point mass,not a Basic concepts and equations rigid body as is done in aircraft stability analysis analysis for different segmentsin a typical flight mission, -Takeoff analysis Airra perfomancer of a -Steady level flight -Steady climbing and descending flight -Level turning flight Gliding flight Acrodynamic fores Engine data Weight estimations -Landina analysis ·Conclusions Aircraft performance calculations itevop☐Payload range☐Takooff Landing Cruise 8oaoT二Wenbin ong Role of Performance Analysis 图上洋大峰 Inputs/Outputs for Performance Calculations 园上海发大坐 Throughout the aircraft life cycle from design,manufacture,flight test to ope Pret)etc sign stagerequirement analysis,engine data(thrust, Engine data from engine supplier Weight estimation including C.G.locations from initial -Manufacture validation of design,full set of technical manuals sizing Flight testsCross validation with wind tunnel data,certificate documents,fault analysis Takeoff and initial climb Climb to operating altitude ·Cruise Descend Approach and landing ·Payload range graph sy-Dr.Wenbin Song 1
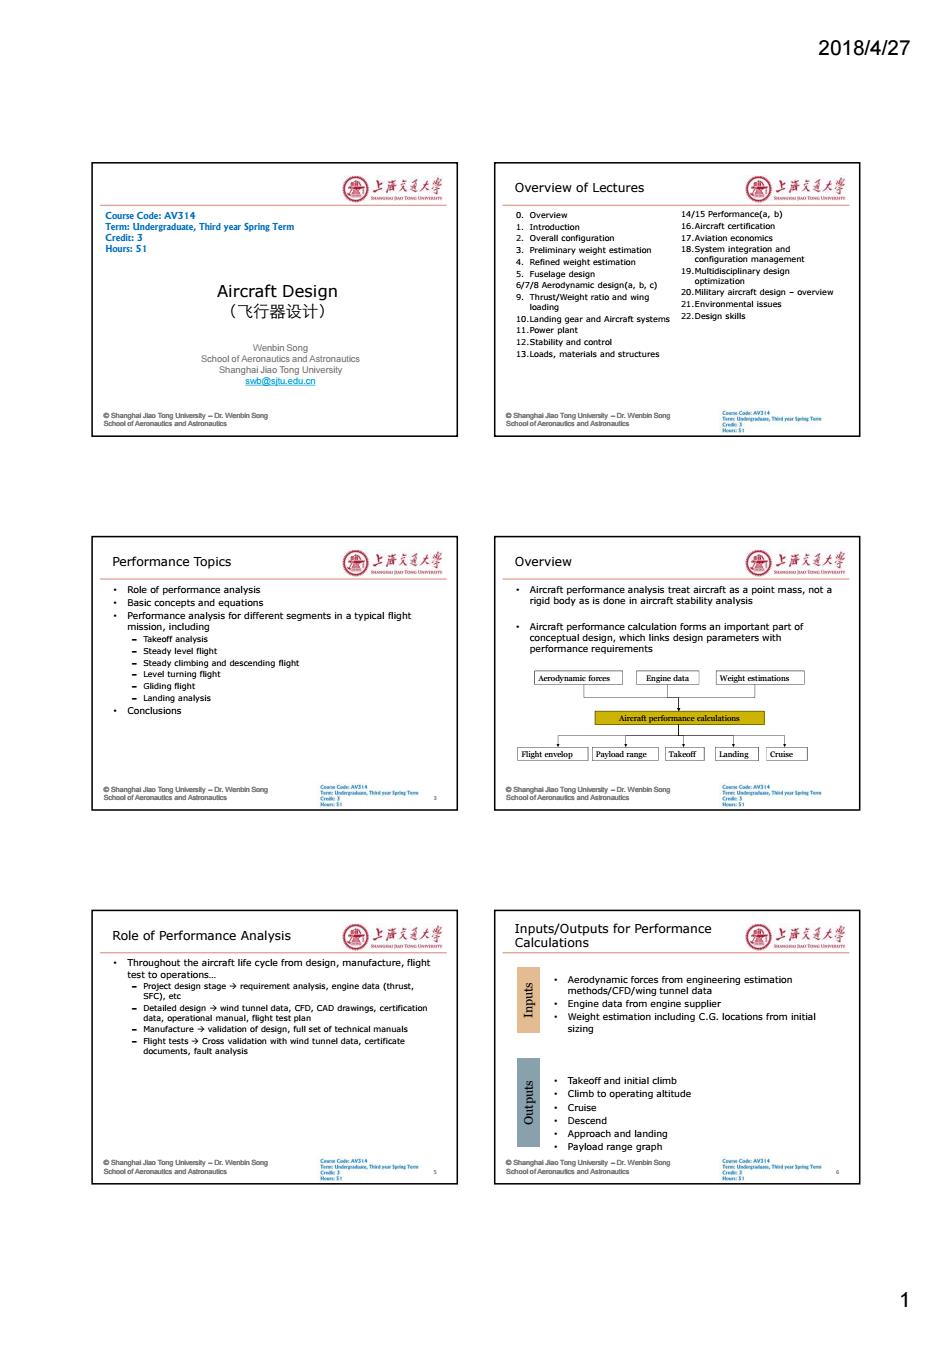
2018/4/27 1 © Shanghai Jiao Tong University – Dr. Wenbin Song School of Aeronautics and Astronautics Wenbin Song School of Aeronautics and Astronautics Shanghai Jiao Tong University swb@sjtu.edu.cn Aircraft Design (飞行器设计) Course Code: AV314 Term: Undergraduate, Third year Spring Term Credit: 3 Hours: 51 © Shanghai Jiao Tong University – Dr. Wenbin Song School of Aeronautics and Astronautics Overview of Lectures 0. Overview 1. Introduction 2. Overall configuration 3. Preliminary weight estimation 4. Refined weight estimation 5. Fuselage design 6/7/8 Aerodynamic design(a, b, c) 9. Thrust/Weight ratio and wing loading 10.Landing gear and Aircraft systems 11.Power plant 12.Stability and control 13.Loads, materials and structures 14/15 Performance(a, b) 16.Aircraft certification 17.Aviation economics 18.System integration and configuration management 19.Multidisciplinary design optimization 20.Military aircraft design – overview 21.Environmental issues 22.Design skills © Shanghai Jiao Tong University – Dr. Wenbin Song School of Aeronautics and Astronautics Performance Topics • Role of performance analysis • Basic concepts and equations • Performance analysis for different segments in a typical flight mission, including – Takeoff analysis – Steady level flight – Steady climbing and descending flight – Level turning flight – Gliding flight – Landing analysis • Conclusions 3 © Shanghai Jiao Tong University – Dr. Wenbin Song School of Aeronautics and Astronautics Overview • Aircraft performance analysis treat aircraft as a point mass, not a rigid body as is done in aircraft stability analysis • Aircraft performance calculation forms an important part of conceptual design, which links design parameters with performance requirements Aerodynamic forces Engine data Weight estimations Aircraft performance calculations Flight envelop Payload range Takeoff Landing Cruise © Shanghai Jiao Tong University – Dr. Wenbin Song School of Aeronautics and Astronautics Role of Performance Analysis • Throughout the aircraft life cycle from design, manufacture, flight test to operations… – Project design stage requirement analysis, engine data (thrust, SFC), etc – Detailed design wind tunnel data, CFD, CAD drawings, certification data, operational manual, flight test plan – Manufacture validation of design, full set of technical manuals – Flight tests Cross validation with wind tunnel data, certificate documents, fault analysis 5 © Shanghai Jiao Tong University – Dr. Wenbin Song School of Aeronautics and Astronautics Inputs/Outputs for Performance Calculations • Aerodynamic forces from engineering estimation methods/CFD/wing tunnel data • Engine data from engine supplier • Weight estimation including C.G. locations from initial sizing • Takeoff and initial climb • Climb to operating altitude • Cruise • Descend • Approach and landing • Payload range graph 6 Inputs Outputs
2018/4/27 Basic Concepts-ISA 国上活大坐 Basic Concepts-various speeds 国上清大学 International Standard Atmosphere-a model of air,developed from ideal gas law ISA-international standard atmosphere Sea level(SL)data Definition of various speed 。 -instrument airspeed,readings from the speedometer without Li-2ih instrument corrections -AV:measurement errors of speedometer,given by manufacture -V:indicated airspeed,V=V+AV -AVp:installation correction,depends on the where the speedometer is installed -Vc:calibrated speed,Vc=V+AVe 士 -Ve:equivalent airspeed,the true airspeed converted to sea level n+ condition,g=ov?=pove,Ve is calculated from Vc using Ve=Vc-AVc,where AVcis the correction due to compressibility :5冠 -Vr:calculated from Ve Basic Concepts-cont. 圈上活大坐 Basic Concepts -cont. 国上清大坐 Ve:Ground speed,the aircraft speed relative to the ground.It ·In Summary calculated from TAS and wind speed For takeoff and landing,head wind take++++ For climb,cruise,and descend,head wind take---- 土im.strument error CAS IAS t installation error ±position error Ve CAS compressibility correction Va TAS= EAS G Ground speed,true airspeed and wind Airspeed as a function of altitude oornWen on 10 Basic Concepts-cont. 图上洋大峰 Basic Equations of Motion 国上清大学 。 (Geometry)altitude (H)-the absolute altitude above sea level Kinematic equations in earth coordinate system Pressure altitude(H),the ISA(geometry)altitude with the same pressure level dXa -For a hot day,lower than geometry altitude dr -For cold day,higher than geometry altitude dt =V V cos6 cos a Vsin. =H=0-11000m -H=h-153B46a1-22557×10-5H0m XoYoZo =-V cos 0sin ta. y -H=(1+总)-689714T网)) -H=(1+)4-22.628△T) sty-Dr.Wenbin Song y-Dr.Wenbin Song 2
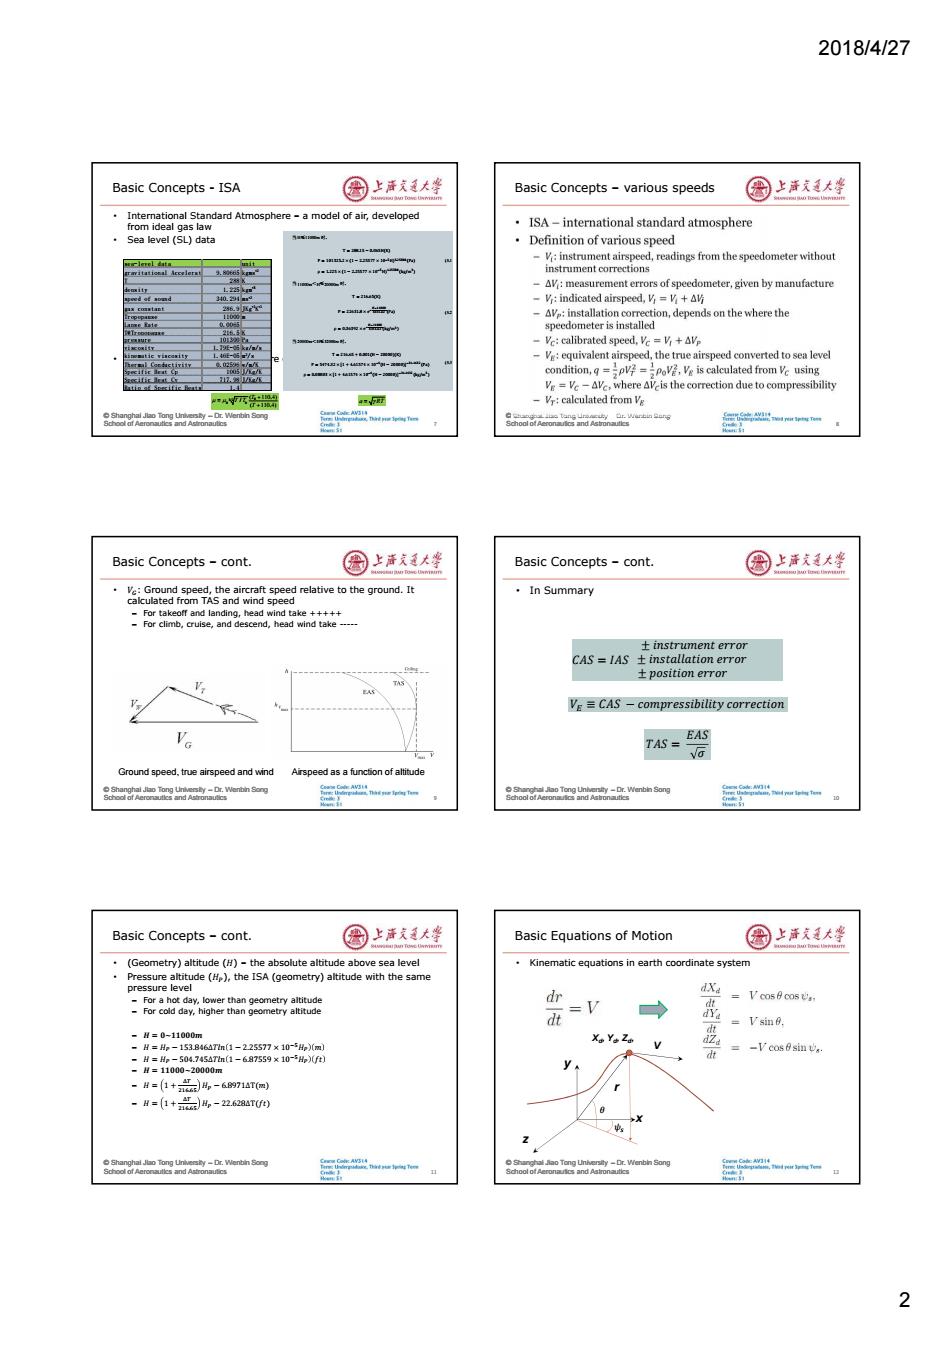
2018/4/27 2 © Shanghai Jiao Tong University – Dr. Wenbin Song School of Aeronautics and Astronautics Basic Concepts - ISA • International Standard Atmosphere – a model of air, developed from ideal gas law • Sea level (SL) data • Viscosity and speed of sound are given as 7 sea-level data unit gravitational Acceleration 9.80665 kgms-2 T 288 K density 1.225 kgm-3 speed of sound 340.294 ms-2 gas constant 286.9 JKg-1K-1 Tropopause 11000 m Lapse Rate 0.0065 T@Tropopause 216.5 K pressure 101300 Pa viscosity 1.79E-05 kg/m/s kinematic viscosity 1.46E-05 m2 /s Thermal Conductivity 0.02596 w/m/K Specific Heat Cp 1005 J/Kg/K Specific Heat Cv 717.98 J/Kg/K Ratio of Specific Heats 1.4 当 H≤11000m 时, T = 288.15 − 0.065H(K) P = 101325.2 × (1 − 2.25577 × 10⁻⁵H)5.25588 (Pa) ρ = 1.225 × (1 − 2.25577 × 10⁻⁵H)4.25588 (kg/m3 ) (5.1 当 11000m<H≤20000m 时, T = 216.65(K) P = 22631.8 × e− 𝐻−11000 6341.62 (Pa) ρ = 0.36392 × e− 𝐻−11000 6341.62 (kg/m3 ) (5.2 当 20000m<H≤32000m 时, T = 216.65 + 0.001(H − 20000)(K) P = 5474.32 × [1 + 4.61574 × 10⁻⁶(H − 20000)]−34.1632 (Pa) ρ = 0.08803 × [1 + 4.61574 × 10⁻⁶ (H − 20000)]−34.1632 (kg/m3 ) (5.3 a RT 3/2 0 0 0 ( 110.4) / ( 110.4) T T T T © Shanghai Jiao Tong University – Dr. Wenbin Song School of Aeronautics and Astronautics Basic Concepts – various speeds 8 i © Shanghai Jiao Tong University – Dr. Wenbin Song School of Aeronautics and Astronautics Basic Concepts – cont. • 𝑉ீ: Ground speed, the aircraft speed relative to the ground. It calculated from TAS and wind speed – For takeoff and landing, head wind take +++++ – For climb, cruise, and descend, head wind take ----- 9 Ground speed, true airspeed and wind Airspeed as a function of altitude © Shanghai Jiao Tong University – Dr. Wenbin Song School of Aeronautics and Astronautics Basic Concepts – cont. • In Summary 10 𝐶𝐴𝑆 = 𝐼𝐴𝑆 ± 𝑖𝑛𝑠𝑡𝑟𝑢𝑚𝑒𝑛𝑡 𝑒𝑟𝑟𝑜𝑟 ± 𝑖𝑛𝑠𝑡𝑎𝑙𝑙𝑎𝑡𝑖𝑜𝑛 𝑒𝑟𝑟𝑜𝑟 ± 𝑝𝑜𝑠𝑖𝑡𝑖𝑜𝑛 𝑒𝑟𝑟𝑜𝑟 𝑉ா ≡ 𝐶𝐴𝑆 − 𝑐𝑜𝑚𝑝𝑟𝑒𝑠𝑠𝑖𝑏𝑖𝑙𝑖𝑡𝑦 𝑐𝑜𝑟𝑟𝑒𝑐𝑡𝑖𝑜𝑛 𝑇𝐴𝑆 = 𝐸𝐴𝑆𝜎 © Shanghai Jiao Tong University – Dr. Wenbin Song School of Aeronautics and Astronautics Basic Concepts – cont. • (Geometry) altitude (𝐻) – the absolute altitude above sea level • Pressure altitude (𝐻), the ISA (geometry) altitude with the same pressure level – For a hot day, lower than geometry altitude – For cold day, higher than geometry altitude – 𝑯 = 𝟎~𝟏𝟏𝟎𝟎𝟎𝒎 – 𝐻 = 𝐻 − 153.846Δ𝑇𝑙𝑛 1 − 2.25577 × 10ିହ𝐻 𝑚 – 𝐻 = 𝐻 − 504.745Δ𝑇𝑙𝑛 1 − 6.87559 × 10ିହ𝐻 𝑓𝑡 – 𝑯 = 𝟏𝟏𝟎𝟎𝟎~𝟐𝟎𝟎𝟎𝟎𝒎 – 𝐻 = 1 + ் ଶଵ.ହ 𝐻 − 6.8971ΔT(𝑚) – 𝐻 = 1 + ் ଶଵ.ହ 𝐻 − 22.628ΔT(𝑓𝑡) 11 © Shanghai Jiao Tong University – Dr. Wenbin Song School of Aeronautics and Astronautics Basic Equations of Motion • Kinematic equations in earth coordinate system 12 V r x y z Xd , Yd , Zd , 𝜃 𝜓௦
2018/4/27 Basic Equations of Motion (cont.) 园上活道大学 Typical Flight Profile of a Civil Jet 国上清大学 Equations of motion in flight path coordinate system =Poos(o +p)cos 3-Q-Gsin 8. -P严c0s(a+Cp)sin 3sin,+sin(a+》cos +Y coe%-Xsl?-Gcos8. 4 一mcos坐 P-cas(a+)sin 3cos.+sin(a+p)sin +Y'sin: Body axis F Horizontal axis 任务时间,任亮感酒 W am Song 国上清文大些 Takeoff Sequence 圆上洋廷大整 Vs:stall speed (in take-off configuration) V1:critical power failure speed VR:rotation speed,this can equal V1 Vmu:minimum unstick speed,VR may not be sufficient to lift off due to limit on rotation angle VLOF:lift-off speed,the aircraft becomes airborne V2:take-off climb speed,achieved at 35ft screen height TAKE-OFF PERFORMANCE Wertin org o Wenbin ong Take-off Options with Engine Failure 图上清文通大学 Take-off distance-with one engine failed 园上洋文大学 Balanced field length dimbingthore angine faled enaccelerate-go distance Rejected tke-off (accelerate-sop) fv-o Fig.10.Taieoff ctons withengne fare. sy-Dr.Wenbin Song 3
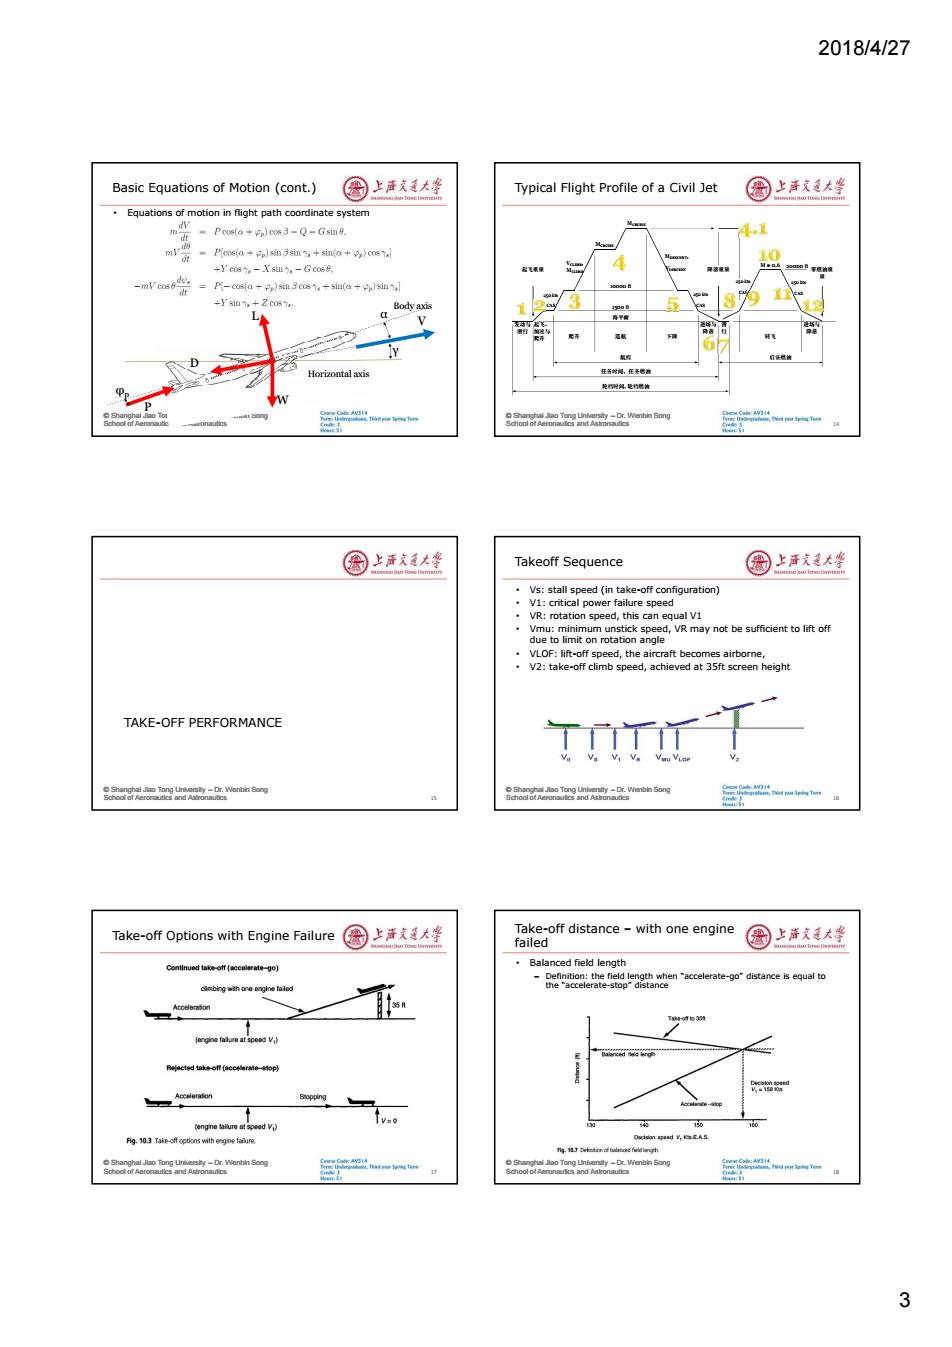
2018/4/27 3 © Shanghai Jiao Tong University – Dr. Wenbin Song School of Aeronautics and Astronautics Basic Equations of Motion (cont.) • Equations of motion in flight path coordinate system L D W V Horizontal axis γ α φp P Body axis © Shanghai Jiao Tong University – Dr. Wenbin Song School of Aeronautics and Astronautics Typical Flight Profile of a Civil Jet 14 250 kts CAS 发动与 滑行 起飞、 加速与 爬升 爬升 巡航 下降 进场与 降落 滑 行 进场与 降落 转飞 航程 任务时间,任务燃油 轮档时间, 轮档燃油 后备燃油 起飞重量 降落重量 零燃油重 量 10000 ft 1500 ft 海平面 20000 ft 250 kts CAS 250 kts CAS VCLIMB, MCLIMB MCRUISE MCRUISE MDESCENT, VDESCENT M = 0.6 250 kts CAS © Shanghai Jiao Tong University – Dr. Wenbin Song School of Aeronautics and Astronautics TAKE-OFF PERFORMANCE 15 © Shanghai Jiao Tong University – Dr. Wenbin Song School of Aeronautics and Astronautics Takeoff Sequence • Vs: stall speed (in take-off configuration) • V1: critical power failure speed • VR: rotation speed, this can equal V1 • Vmu: minimum unstick speed, VR may not be sufficient to lift off due to limit on rotation angle • VLOF: lift-off speed, the aircraft becomes airborne, • V2: take-off climb speed, achieved at 35ft screen height 16 © Shanghai Jiao Tong University – Dr. Wenbin Song School of Aeronautics and Astronautics Take-off Options with Engine Failure 17 © Shanghai Jiao Tong University – Dr. Wenbin Song School of Aeronautics and Astronautics Take-off distance – with one engine failed • Balanced field length – Definition: the field length when “accelerate-go” distance is equal to the “accelerate-stop” distance 18
2018/4/27 Take-off Run,Take-off Distance and Take-off path in detail Accelerate-Stop Distance 因上声克通大学 国上清大学 Take-off distance max(ASDOEI,TODOEI,1.15TORAEO) Available take-off distance Take-off path TORA:Take-off run available runway length available TO ight path -TODA:Take-off distance available runway length available clearway if available ASDA:A AEO 8aoTe2e二Werbin Song Aircraft characteristics and Airport planning 圈上活大坐 Take-off Distance all engines operating (Ia) 国上活大孝 Aircraft manufactures provide runway chart U -Sea-level,standard day -Balanced field lenoth -Should be adjusted based on TOW,altitude,pressure,surface conditions.etc. FAR Takeoff Field/Runway Length definition max(ASDOEI,TODOEI,1.15TORAEO) TOR(Takeoff Run)sTORA (Takeoff Run Available) TOD(Takeoff Distance)s TODA (Takeoff Distance Available) T=D+M(dV/dt)+uR R=Mg-L D-0.5qSCp ASD(Accelerate-Stop Distance)sASDA(Accelerate-Stop Distance Available) M(dv/dn)-F=T-D-D-T-D-M(Mg-L)Cp=a+bCi (dV]d)=(T/W-)+(p/(2WJS)-a-bGi-iC.)v2g Take-off Distance Take-off Distance all engines operating (Ib) 国上洋大坐 all engines operating (II) 园上海发大坐 Ground roll distance can be computed by integral Transition flight path -d 。 Approximation can be assumed by (5+) T=0.75T “(4+2) -D+D-=0.02+01C 2 5+2 -0.02+0.01c-) is BPR of the turbofan engine sty-Dr.Wenbin Song y-Dr.Wenbin Song 4
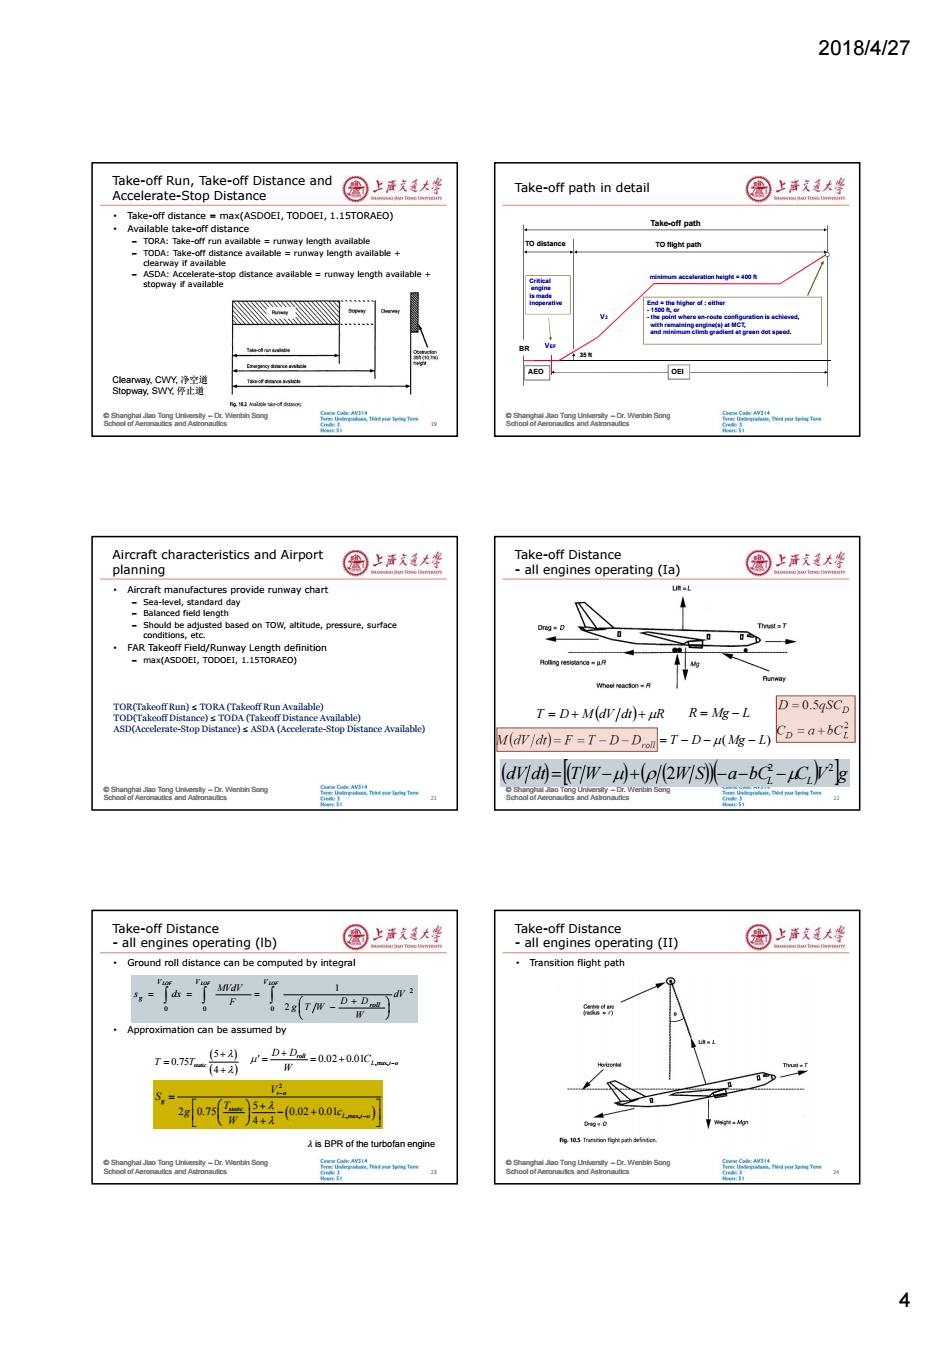
2018/4/27 4 © Shanghai Jiao Tong University – Dr. Wenbin Song School of Aeronautics and Astronautics Take-off Run, Take-off Distance and Accelerate-Stop Distance • Take-off distance = max(ASDOEI, TODOEI, 1.15TORAEO) • Available take-off distance – TORA: Take-off run available = runway length available – TODA: Take-off distance available = runway length available + clearway if available – ASDA: Accelerate-stop distance available = runway length available + stopway if available 19 Clearway, CWY, 净空道 Stopway, SWY, 停止道 © Shanghai Jiao Tong University – Dr. Wenbin Song School of Aeronautics and Astronautics Take-off path in detail BR 35 ft TO distance TO flight path Take-off path VEF Critical engine is made inoperative AEO OEI V2 minimum acceleration height = 400 ft End = the higher of : either - 1500 ft, or - the point where en-route configuration is achieved, with remaining engine(s) at MCT, and minimum climb gradient at green dot speed. © Shanghai Jiao Tong University – Dr. Wenbin Song School of Aeronautics and Astronautics Aircraft characteristics and Airport planning • Aircraft manufactures provide runway chart – Sea-level, standard day – Balanced field length – Should be adjusted based on TOW, altitude, pressure, surface conditions, etc. • FAR Takeoff Field/Runway Length definition – max(ASDOEI, TODOEI, 1.15TORAEO) 21 TOR(Takeoff Run) ≤ TORA (Takeoff Run Available) TOD(Takeoff Distance) ≤ TODA (Takeoff Distance Available) ASD(Accelerate-Stop Distance) ≤ ASDA (Accelerate-Stop Distance Available) © Shanghai Jiao Tong University – Dr. Wenbin Song School of Aeronautics and Astronautics Take-off Distance - all engines operating (Ia) 22 T D M dV dt R R Mg L M dV dt F T D D T D (Mg L) roll D D 0.5qSC 2 D L C a bC dV dt T W W S a bCL CLV g 2 2 2 © Shanghai Jiao Tong University – Dr. Wenbin Song School of Aeronautics and Astronautics Take-off Distance - all engines operating (lb) • Ground roll distance can be computed by integral • Approximation can be assumed by 23 LOF LOF V LOF roll V V g dV W D D g T W F MVdV s dx 0 2 0 0 2 1 5 0.75 4 T Tstatic L t o roll C W D D ,max, 0.02 0.01 2 ,max, 5 2 0.75 0.02 0.01 4 t o g static L t o V S T g c W 𝜆 is BPR of the turbofan engine © Shanghai Jiao Tong University – Dr. Wenbin Song School of Aeronautics and Astronautics Take-off Distance - all engines operating (II) • Transition flight path 24
2018/4/27 Take-off distance 园上注庆大坐 Take-off Distance all engines all engines operating (III) operating (IV) 国上清大学 Transition to Climb Aircraft accelerate from VLOF to V2 Simple estimation can be made by assuming that -▣=0g□ma¥ -VTRANS=(VLOF+V2)/2 -Flying along an arc n=L/Mg 1=0.5-p-Vs5-0.9.Cima cos0≈1 L=Mg cos0+MVjmus/r r='g(-l月 Screen height ST=ry hr=r00/2 =G+-2 ong Take-off distance-all engines operating (V) 国上活大坐 国上活文大蜂 Climb after transition to screen height Climb distance:the ground distance from the end of transition to the screen height sc=(screen height-h)/tanyc where,ht is the height at the end of transition,yc is the best climb angle Total distance for take-off is the sum of ground roll,transition, and climb distance STEADY CLIMB DESCEND FLIGHT oon Wenbn ong Typical Climb Profile and Speed 图上洋大峰 Initial Climb to 1500ft after Takeoff (I) 国上洋大学 Z0) M=0.86 Initial climb is typically divided into four segments 36 constant Mach number climb Tahlemsement definitioes U/C Rating 4 constant equivalent airspeed climb En-route Up 0 0 150250320 500 Vg(kts) Take-off climb performance is usually defined by second segment performance requirement which is the most critical Climb carried out mainly at constant equivalent airspeed or constant Mach number y-Dr.Wenbin Song 5
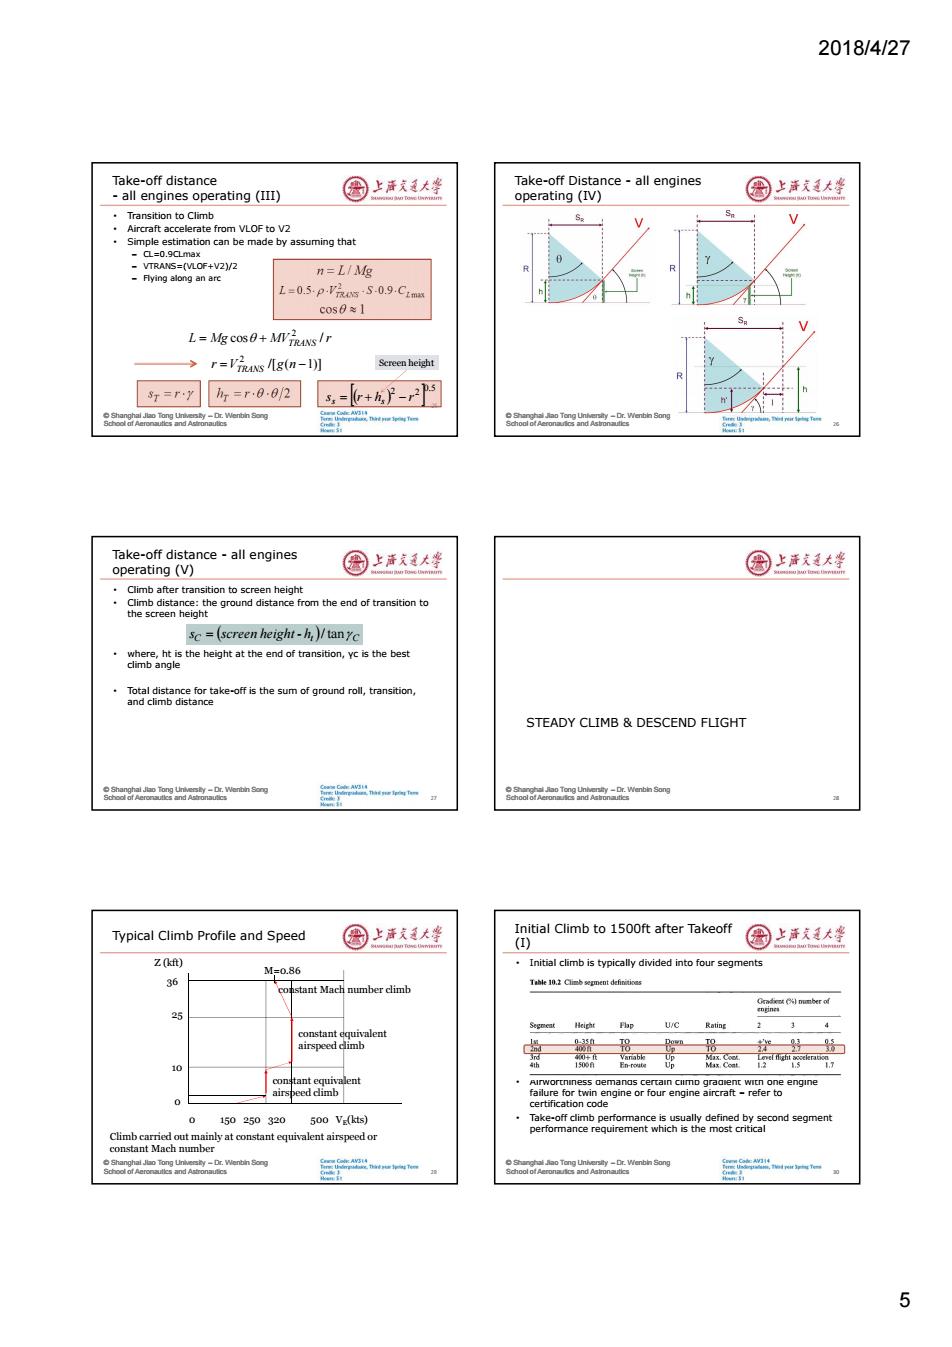
2018/4/27 5 © Shanghai Jiao Tong University – Dr. Wenbin Song School of Aeronautics and Astronautics Take-off distance - all engines operating (III) • Transition to Climb • Aircraft accelerate from VLOF to V2 • Simple estimation can be made by assuming that – CL=0.9CLmax – VTRANS=(VLOF+V2)/2 – Flying along an arc 25 L Mg MV r TRANS cos / 2 n L / Mg max 2 L 0.5 VTRANS S 0.9 CL /[ ( 1)] 2 r VTRANS g n cos 1 s r T h r 2 T 0.5 2 2 s r h r s s Screen height © Shanghai Jiao Tong University – Dr. Wenbin Song School of Aeronautics and Astronautics Take-off Distance - all engines operating (IV) 26 © Shanghai Jiao Tong University – Dr. Wenbin Song School of Aeronautics and Astronautics Take-off distance - all engines operating (V) • Climb after transition to screen height • Climb distance: the ground distance from the end of transition to the screen height • where, ht is the height at the end of transition, γc is the best climb angle • Total distance for take-off is the sum of ground roll, transition, and climb distance 27 C t C s screen height - h / tan © Shanghai Jiao Tong University – Dr. Wenbin Song School of Aeronautics and Astronautics STEADY CLIMB & DESCEND FLIGHT 28 © Shanghai Jiao Tong University – Dr. Wenbin Song School of Aeronautics and Astronautics Typical Climb Profile and Speed 29 Climb carried out mainly at constant equivalent airspeed or constant Mach number constant Mach number climb 0 150 250 320 500 VE (kts) Z (kft) 36 25 10 0 constant equivalent airspeed climb constant equivalent airspeed climb M=0.86 © Shanghai Jiao Tong University – Dr. Wenbin Song School of Aeronautics and Astronautics Initial Climb to 1500ft after Takeoff (I) • Initial climb is typically divided into four segments • Airworthiness demands certain climb gradient with one engine failure for twin engine or four engine aircraft – refer to certification code • Take-off climb performance is usually defined by second segment performance requirement which is the most critical 30
2018/4/27 Initial Climb to 1500ft after Takeoff 圈上声哀通大学 Climb Performance:further analysis (II) 国上活大学 Climb rate(vertical velocity)can be obtained by analyzing forces ·Given a climb angle: T=D+W sine L L=mcos日冬W Best rate of climb and Best angle of cin Horizonta Btrate of cimb provides the max climl 。-哈- Weos00 Time to climb and fuel to climb -Time to cime a certain distance and Thrust is of the static value ng fuel used can be calculated as aw;"sFcarr -Drag of the basic configuration The asymmetric drag due to a failed engine, mtion can be used to 国上清文大些 Equations for Level Cruise(®上f大 Horizontal axis y=0 Pp STEADY LEVEL FLIGHT Equilibrium equations Rate of change of aircraft weight T=D+Wsiny=D dw =-SFC.T L=Wcosy=W Wertin org Steady Level Cruise Analysis 国上清大学 Thrust required for level flight jet aircraft 园上海发大坐 Analysis for unaccelerating level flight Minimum thrust for given aircraft weight can be found from T=D=qS(CDo+KC2) ·Therefore, Therefore L=W=qSCL a(T/W)__W2K-0 w7下S于pw3 These equations can be used in further analysis -Minimum cruise thrust requirement for jet aircraft ant=gNc。and C=受 -Minimum cruise power requirement for propeller aircraft At any given weight,the aircraft can be flown at the optimal lift V=忌停nd品=六=器+得))将 coefficient for minimum drag by varying velocity or air density (altitude). Qucstion one:What is formula for total drag? sy-Dr.Wenbin Song 6
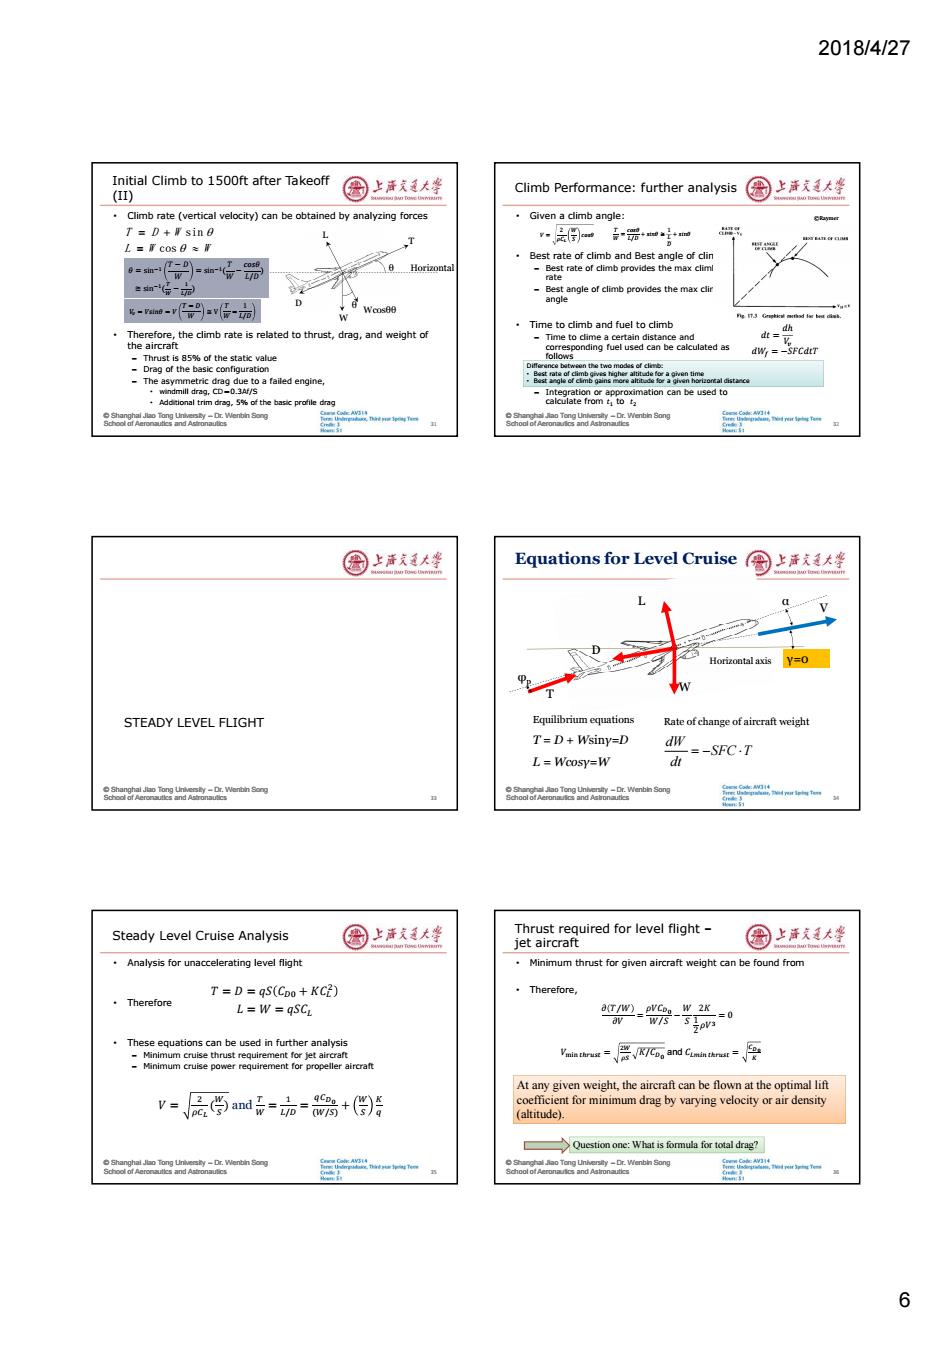
2018/4/27 6 © Shanghai Jiao Tong University – Dr. Wenbin Song School of Aeronautics and Astronautics Horizontal T W Wcosθθ θ θ L D Initial Climb to 1500ft after Takeoff (II) • Climb rate (vertical velocity) can be obtained by analyzing forces • Therefore, the climb rate is related to thrust, drag, and weight of the aircraft – Thrust is 85% of the static value – Drag of the basic configuration – The asymmetric drag due to a failed engine, • windmill drag, CD=0.3Af/S • Additional trim drag, 5% of the basic profile drag 31 T D W sin L W cos W 𝜃 = sinିଵ 𝑇 − 𝐷 𝑊 = sinିଵ( 𝑇𝑊 − 𝑐𝑜𝑠𝜃 𝐿/𝐷 ) ≅ sinିଵ( ்ௐ − ଵ / ) 𝑉௩ = 𝑉𝑠𝑖𝑛𝜃 = 𝑉 𝑇 − 𝐷 𝑊 ≅ V 𝑇𝑊 − 1 𝐿/𝐷 © Shanghai Jiao Tong University – Dr. Wenbin Song School of Aeronautics and Astronautics Climb Performance: further analysis • Given a climb angle: • Best rate of climb and Best angle of clime – Best rate of climb provides the max climb rate – Best angle of climb provides the max climb angle • Time to climb and fuel to climb – Time to clime a certain distance and corresponding fuel used can be calculated as follows – Integration or approximation can be used to calculate from 𝑡ଵ to 𝑡ଶ 32 ©Raymer 𝑉 = 2𝜌𝐶 𝑊 𝑆 𝑐𝑜𝑠𝜃 𝑇𝑊 = 𝑐𝑜𝑠𝜃 𝐿/𝐷 + 𝑠𝑖𝑛𝜃 ≅ 1 𝐿𝐷 + 𝑠𝑖𝑛𝜃 𝑑𝑡 = 𝑑ℎ𝑉௩ 𝑑𝑊 = −𝑆𝐹𝐶𝑑𝑡𝑇 Difference between the two modes of climb: • Best rate of climb gives higher altitude for a given time • Best angle of climb gains more altitude for a given horizontal distance © Shanghai Jiao Tong University – Dr. Wenbin Song School of Aeronautics and Astronautics STEADY LEVEL FLIGHT 33 © Shanghai Jiao Tong University – Dr. Wenbin Song School of Aeronautics and Astronautics 34 Equilibrium equations T = D + Wsinγ=D L = Wcosγ=W Equations for Level Cruise Rate of change of aircraft weight SFC T dt dW L D W V Horizontal axis γ=0 α φp T © Shanghai Jiao Tong University – Dr. Wenbin Song School of Aeronautics and Astronautics Steady Level Cruise Analysis • Analysis for unaccelerating level flight • Therefore • These equations can be used in further analysis – Minimum cruise thrust requirement for jet aircraft – Minimum cruise power requirement for propeller aircraft 35 𝑇 = 𝐷 = 𝑞𝑆 𝐶 + 𝐾𝐶ଶ 𝐿 = 𝑊 = 𝑞𝑆𝐶 𝑉 = ଶఘಽ (ௐ ௌ ) and ்ௐ = ଵ / = ವబ (ௐ/ௌ) + ௐ ௌ © Shanghai Jiao Tong University – Dr. Wenbin Song School of Aeronautics and Astronautics Thrust required for level flight – jet aircraft • Minimum thrust for given aircraft weight can be found from • Therefore, 36 𝜕 𝑇 𝑊⁄𝜕𝑉 = 𝜌𝑉𝐶 𝑊 𝑆⁄ − 𝑊 𝑆 2𝐾 1 2 𝜌𝑉ଷ = 0 𝑉୫୧୬ ௧௨௦௧ = ଶௐ ఘௌ 𝐾/𝐶 and 𝐶 ௧௨௦௧ = ವబ At any given weight, the aircraft can be flown at the optimal lift coefficient for minimum drag by varying velocity or air density (altitude). Question one: What is formula for total drag?
2018/4/27 Thrust required for level flight- propeller aircraft 国上活大坐 Breguet Range Equation 国上清大学 Minimum power required for propeller aircraft can be derived by first calculate the power Rate of weight change dw =-SFC.T=-SFC.(D+Wsiny) P=DV =qS(CDo+KC2)v=pV3S(Coo+KC2) d VSCoo pVS Similar to the derivation on previous slide SFC 1 ·Therefore KW2 dt=dx/V=dx/aM aM R=k= aM(L/D)dw :What is formula for total drag? SFCl+/D小sin习W Question two:Will the total drag be higher than flying at min thrust? .<<1,because y<<1 Song Breguet Equations Simplification 圆上清道大坐 Payload Range Graph 国上活支大峰 ·During Cruise Range is related to fuel/weight ratio -SFC remains roughly constant(0.5 Ibs/hr/lb) -Constant M -L/D also roughly constant RaM(LD)oe -Cruising in tropopause,a =constant SFC SFC Therefore Maximum payload R=[k= aM(L/D)dw →R=aM/D)og SFC W SFC Maximum takeoff weight Maximum fuel capacity Range(nm) More Analysis on Cruise 图上洋大峰 园上海发大坐 Minimum thrust level cruise aat-器and m-受 Minimum power level cruise D=qS(Co0+KC2)=qS(Cn。+Co。) Veow=层3G。and C=受 D=qS(Cpo+KC2)=qS(CDo+3CDo) LEVEL TURNING FLIGHT The velocity for minimum power is0.76 times the velocity for minimum thrust cruise,while lift coefficient is~73%higher for minimum power flight.But total drag for min power is not twice that for min drag! 7
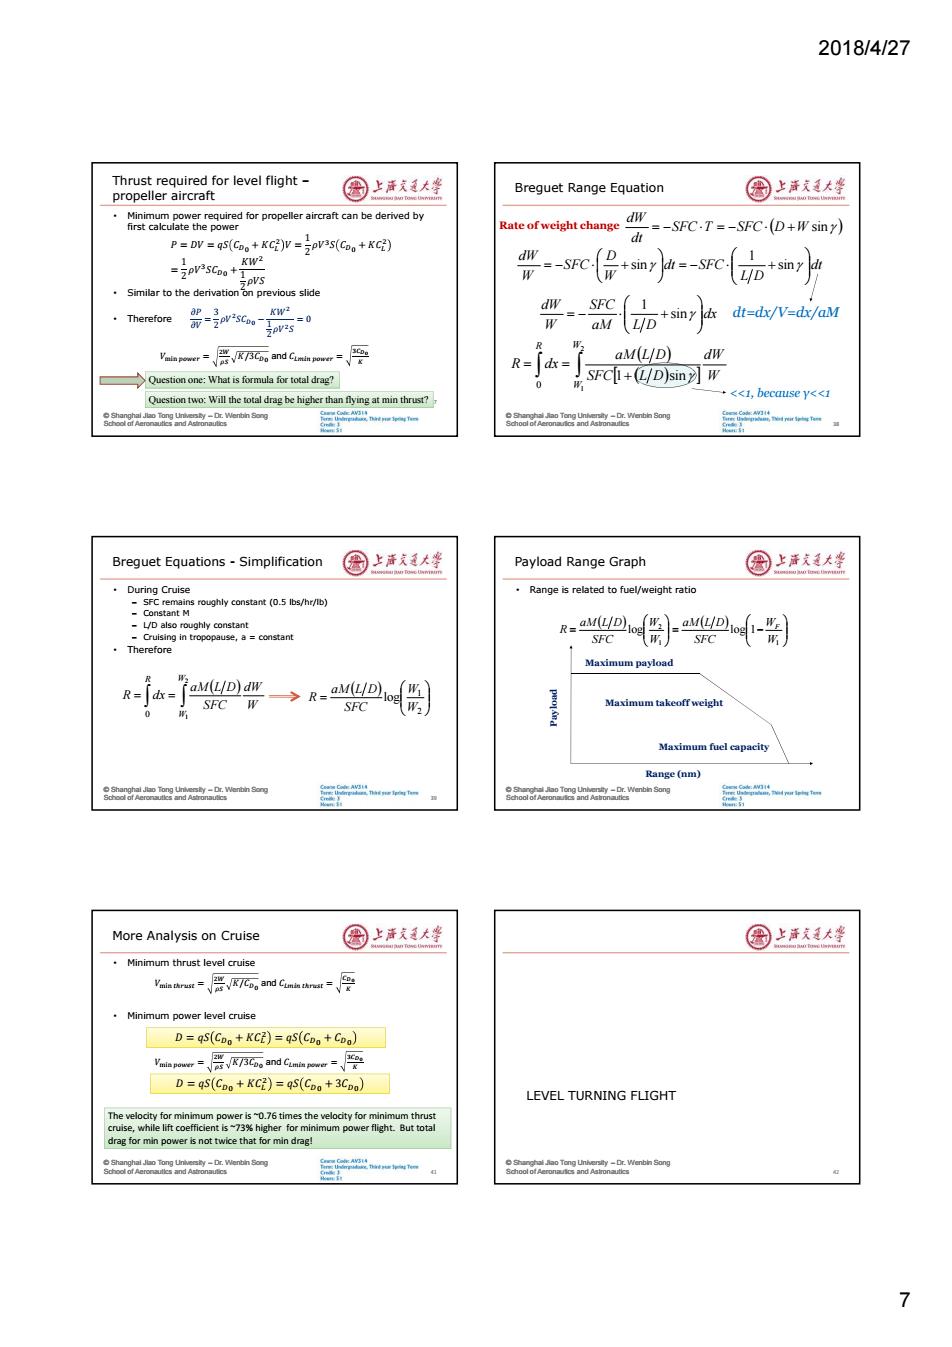
2018/4/27 7 © Shanghai Jiao Tong University – Dr. Wenbin Song School of Aeronautics and Astronautics Thrust required for level flight – propeller aircraft • Minimum power required for propeller aircraft can be derived by first calculate the power • Similar to the derivation on previous slide • Therefore 37 𝑃 = 𝐷𝑉 = 𝑞𝑆 𝐶 + 𝐾𝐶ଶ 𝑉 = 1 2 𝜌𝑉ଷ 𝑆 𝐶 + 𝐾𝐶ଶ = 1 2 𝜌𝑉ଷ 𝑆𝐶 + 𝐾𝑊ଶ 1 2 𝜌𝑉𝑆 𝜕𝑃 𝜕𝑉 = 3 2 𝜌𝑉ଶ 𝑆𝐶 − 𝐾𝑊ଶ 1 2 𝜌𝑉ଶ𝑆 = 0 𝑉୫୧୬ ௪ = ଶௐ ఘௌ 𝐾/3𝐶 and 𝐶 ௪ = ଷವబ Question one: What is formula for total drag? Question two: Will the total drag be higher than flying at min thrust? © Shanghai Jiao Tong University – Dr. Wenbin Song School of Aeronautics and Astronautics Breguet Range Equation 38 Rate of weight change dt=dx/V=dx/aM <<1, because γ<<1 SFC T SFC D W sin dt dW dt L D dt SFC W D SFC W dW sin 1 sin dx aM L D SFC W dW sin 1 W dW SFC L D aM L D R dx W W R 2 1 1 sin 0 © Shanghai Jiao Tong University – Dr. Wenbin Song School of Aeronautics and Astronautics Breguet Equations - Simplification • During Cruise – SFC remains roughly constant (0.5 lbs/hr/lb) – Constant M – L/D also roughly constant – Cruising in tropopause, a = constant • Therefore 39 W dW SFC aM L D R dx W W R 2 1 0 2 1 log W W SFC aM L D R © Shanghai Jiao Tong University – Dr. Wenbin Song School of Aeronautics and Astronautics Payload Range Graph • Range is related to fuel/weight ratio 1 1 2 log log 1 W W SFC aM L D W W SFC aM L D R F Maximum payload Maximum takeoff weight Maximum fuel capacity Range (nm) Payload © Shanghai Jiao Tong University – Dr. Wenbin Song School of Aeronautics and Astronautics More Analysis on Cruise • Minimum thrust level cruise • Minimum power level cruise 41 𝐷 = 𝑞𝑆 𝐶 + 𝐾𝐶ଶ = 𝑞𝑆 𝐶 + 𝐶 𝐷 = 𝑞𝑆 𝐶 + 𝐾𝐶ଶ = 𝑞𝑆 𝐶 + 𝐶 𝐷 = 𝑞𝑆 𝐶 + 𝐾𝐶ଶ = 𝑞𝑆 𝐶 + 3𝐶 𝐷 = 𝑞𝑆 𝐶 + 𝐾𝐶ଶ = 𝑞𝑆 𝐶 + 3𝐶 𝑉୫୧୬ ௧௨௦௧ = ଶௐ ఘௌ 𝐾/𝐶 and 𝐶 ௧௨௦௧ = ವబ 𝑉୫୧୬ ௪ = ଶௐ ఘௌ 𝐾/3𝐶 and 𝐶 ௪ = ଷವబ The velocity for minimum power is ~0.76 times the velocity for minimum thrust cruise, while lift coefficient is ~73% higher for minimum power flight. But total drag for min power is not twice that for min drag! © Shanghai Jiao Tong University – Dr. Wenbin Song School of Aeronautics and Astronautics LEVEL TURNING FLIGHT 42
2018/4/27 Analysis of Level Turning 国上活大坐 Analysis of Level Turning (Cont.) 国上清大坐 Tum-rate or rate of turn (ROT) eleration ·Turning radius -Angular velocity Force analysis R= -Vertical lift component equals gvn2i -Smaller V and higher n gives smaller Therefore turning rate Two types of turning,depends on time period h=wn2_9-1 -Instantaneous,for short period of time (W/g)v V Sustained turning,for an extended L-w penod or time : Song Instantaneous Turning 圈上活大坐 Sustained Turning 国上道大坐 Instantaneous turn aircraft is allowed to slow down during the In sustained turning,the aircraft is not allowed to slow down or tum lose altitude,which implies that .Comer speed is important for dog fight Therefore T=D and L=nW 。 Drag is greater than ust OMVIS ALII Based on this,the following equation holds Tuming rate higher T=D qS(Cpo+KC2)with CL nW than sustained n整 qs This gives the load factor n lterative process is reouired to solve this as K and n are n= both functions of the C Sustained Turning Rate 图上洋大峰 园上海发大坐 In a sustained tuming given flight condi(speed,altitude, a9oai2nsaisryheol6geqaion T四 n= wD Maximum n can be achieved with min Drag From minimum drag level flight analysis,there is Vmin thrust= 、√KTCpo and CLmin thrust=, .The maximum sined-tun load factor can be solved using GLIDING FLIGHT L=nW =qs =WR-1_gVm-1 -(wg)v 8
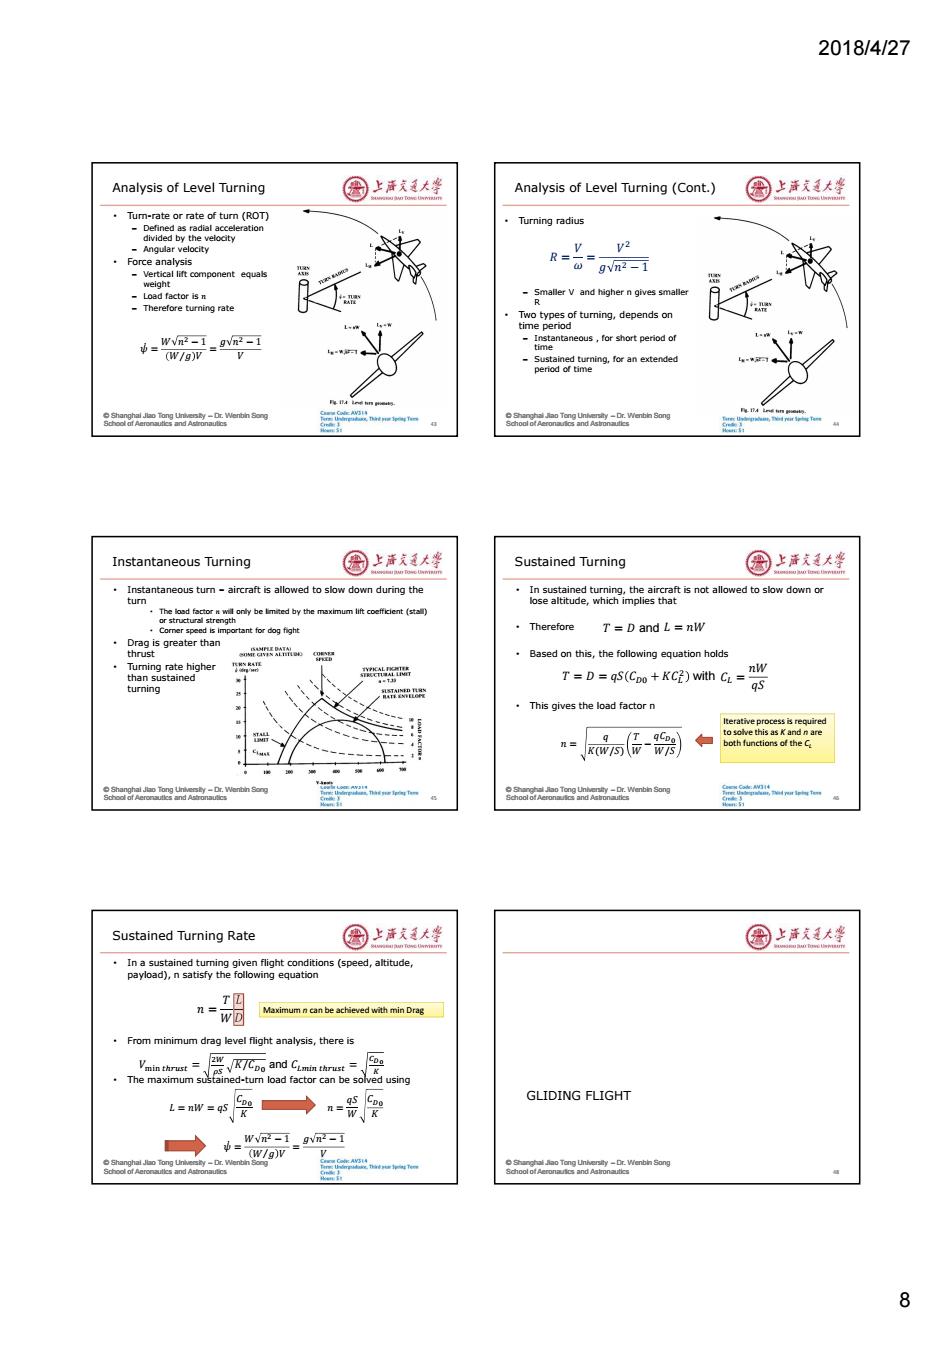
2018/4/27 8 © Shanghai Jiao Tong University – Dr. Wenbin Song School of Aeronautics and Astronautics Analysis of Level Turning • Turn-rate or rate of turn (ROT) – Defined as radial acceleration divided by the velocity – Angular velocity • Force analysis – Vertical lift component equals weight – Load factor is 𝑛 – Therefore turning rate 43 𝜓̇ = 𝑊 𝑛ଶ − 1 𝑊 𝑔⁄ 𝑉 = 𝑔 𝑛ଶ − 1 𝑉 © Shanghai Jiao Tong University – Dr. Wenbin Song School of Aeronautics and Astronautics Analysis of Level Turning (Cont.) • Turning radius – Smaller V and higher n gives smaller R • Two types of turning, depends on time period – Instantaneous , for short period of time – Sustained turning, for an extended period of time 44 𝑅 = 𝑉𝜔 = 𝑉 ଶ 𝑔 𝑛ଶ − 1 © Shanghai Jiao Tong University – Dr. Wenbin Song School of Aeronautics and Astronautics Instantaneous Turning • Instantaneous turn – aircraft is allowed to slow down during the turn • The load factor 𝑛 will only be limited by the maximum lift coefficient (stall) or structural strength • Corner speed is important for dog fight • Drag is greater than thrust • Turning rate higher than sustained turning 45 © Shanghai Jiao Tong University – Dr. Wenbin Song School of Aeronautics and Astronautics Sustained Turning • In sustained turning, the aircraft is not allowed to slow down or lose altitude, which implies that • Therefore • Based on this, the following equation holds • This gives the load factor n 46 𝑇 = 𝐷 and 𝐿 = 𝑛𝑊 𝑇 = 𝐷 = 𝑞𝑆 𝐶 + 𝐾𝐶ଶ with 𝐶 = 𝑛𝑊 𝑞𝑆 𝑛 = 𝑞 𝐾(𝑊/𝑆) 𝑇𝑊 − 𝑞𝐶 𝑊/𝑆 Iterative process is required to solve this as K and n are both functions of the CL © Shanghai Jiao Tong University – Dr. Wenbin Song School of Aeronautics and Astronautics Sustained Turning Rate • In a sustained turning given flight conditions (speed, altitude, payload), n satisfy the following equation • From minimum drag level flight analysis, there is • The maximum sustained-turn load factor can be solved using 𝑛 = 𝑇 𝑊 𝐿 𝐷 𝐿 = 𝑛𝑊 = 𝑞𝑆 𝐶 𝐾 𝑉୫୧୬ ௧௨௦௧ = ଶௐ ఘௌ 𝐾/𝐶 and 𝐶 ௧௨௦௧ = ವబ 𝑛 = 𝑞𝑆𝑊 𝐶 𝐾 𝜓̇ = 𝑊 𝑛ଶ − 1 𝑊 𝑔⁄ 𝑉 = 𝑔 𝑛ଶ − 1 𝑉 Maximum n can be achieved with min Drag © Shanghai Jiao Tong University – Dr. Wenbin Song School of Aeronautics and Astronautics GLIDING FLIGHT 48
2018/4/27 Straight Gliding Flight 国上活大坐 Glide Ratio 国上清大学 Conditions for straight gliding flight Glide ratio is defined as the ratio between horizontal distance The thrust is set to zero(no fuel left?) travelled and altitude lost -The direction of the gliding angle is negative 。 Glide ratio is equal to the lift-to-drag ratio D=Wsiny L=Wcosy Max glide ratio gives the maximum range for gliding flight, therefore requires flying at max L/D-min CD L Wcosy D= Wsiny Vain thrutCpo and Cmirst T=0 Horizontal axis rn enbin Song Sink Rate 国上活大坐 Turning Gliding Flight 国上活支大峰 Another parameters of interest for gliding flight when sailplane turns at a bank angle the following relation -Determine the time that a glider may remain in the air holds (a component of the lift is used to turn) -Vertical velocity,Vv 台需 Lcos0 Wcosy This leads to a modified sink rate V=Vsin y=siny W、2cosy W 2 cos3 yCp PCL PC3 1 w 2 %兰esp0J下pCi/C3 %兰 W 2 Spc/c蹈 。 Minimum sink rate can be obtained by maximizing C/C,which leads to Sink Rate and Glide Ratio 图上洋大峰 园上海发大坐 Difference between sink rate and glide ratio 3C LANDING PERFORMANCE The velocity for min sink rate is 76%of that for best glide ratio 9
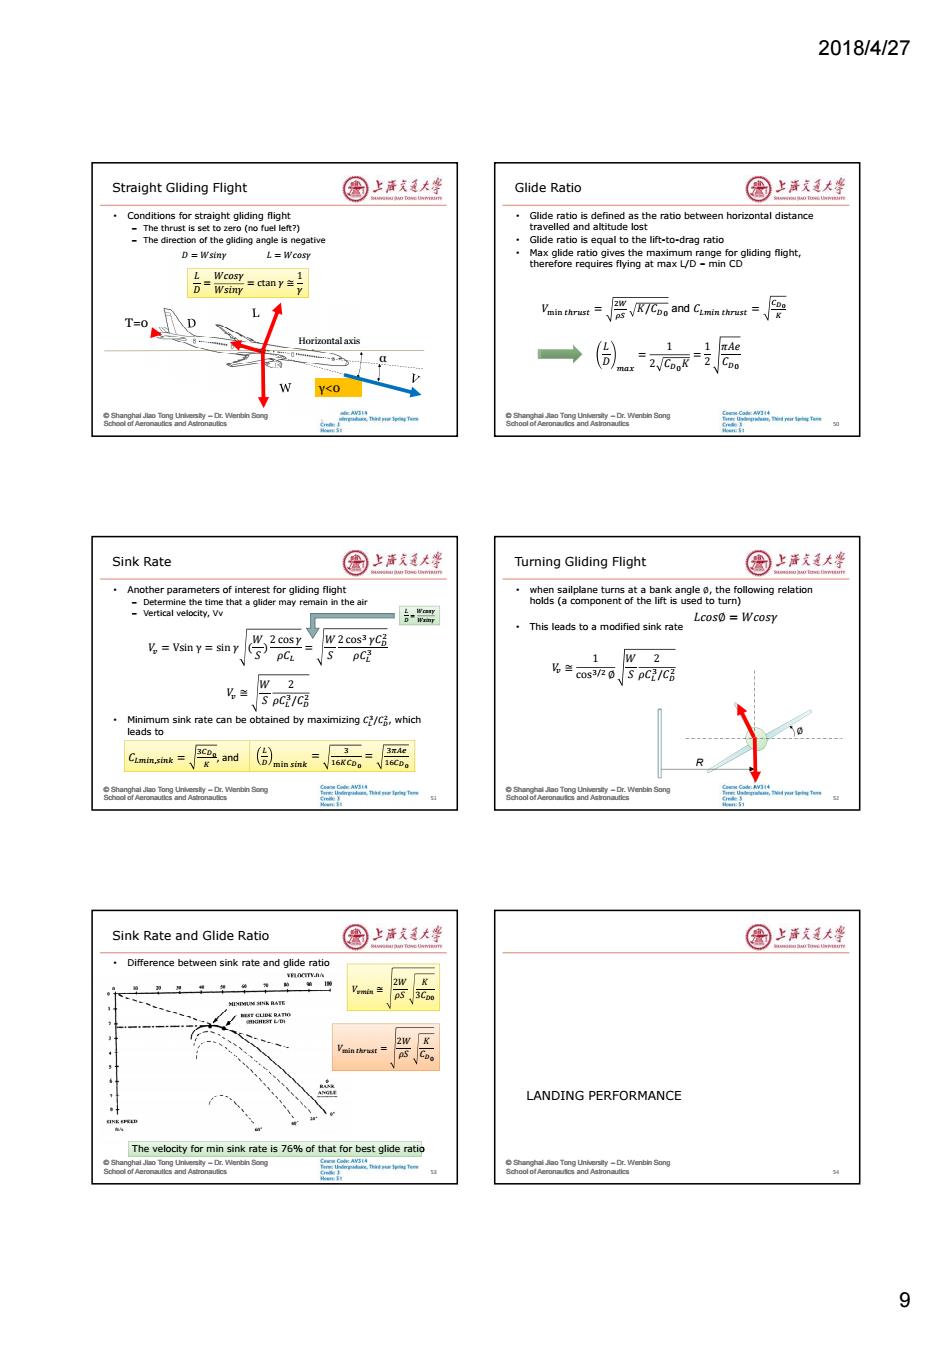
2018/4/27 9 © Shanghai Jiao Tong University – Dr. Wenbin Song School of Aeronautics and Astronautics Straight Gliding Flight • Conditions for straight gliding flight – The thrust is set to zero (no fuel left?) – The direction of the gliding angle is negative Horizontal axis γ<0 α T=0 𝐷 = 𝑊𝑠𝑖𝑛𝛾 𝐿 = 𝑊𝑐𝑜𝑠𝛾 𝐿𝐷 = 𝑊𝑐𝑜𝑠𝛾 𝑊𝑠𝑖𝑛𝛾 = ctan 𝛾 ≅ 1 𝛾 𝐿𝐷 = 𝑊𝑐𝑜𝑠𝛾 𝑊𝑠𝑖𝑛𝛾 = ctan 𝛾 ≅ 1 𝛾 © Shanghai Jiao Tong University – Dr. Wenbin Song School of Aeronautics and Astronautics Glide Ratio • Glide ratio is defined as the ratio between horizontal distance travelled and altitude lost • Glide ratio is equal to the lift-to-drag ratio • Max glide ratio gives the maximum range for gliding flight, therefore requires flying at max L/D – min CD 50 𝑉୫୧୬ ௧௨௦௧ = ଶௐ ఘௌ 𝐾/𝐶 and 𝐶 ௧௨௦௧ = ವబ 𝐿 𝐷 ௫ = 1 2 𝐶𝐾 = 1 2 𝜋𝐴𝑒 𝐶 © Shanghai Jiao Tong University – Dr. Wenbin Song School of Aeronautics and Astronautics Sink Rate • Another parameters of interest for gliding flight – Determine the time that a glider may remain in the air – Vertical velocity, Vv • Minimum sink rate can be obtained by maximizing 𝐶ଷ /𝐶 ଶ , which leads to 51 𝑉௩ = Vsin γ = sin 𝛾 ( 𝑊 𝑆 ) 2 cos 𝛾 𝜌𝐶 = 𝑊 𝑆 2 cosଷ 𝛾𝐶 ଶ 𝜌𝐶ଷ 𝑉௩ ≅ 𝑊 𝑆 2 𝜌𝐶ଷ /𝐶 ଶ 𝐶,௦ = ଷವబ 𝐶,௦ = ଷವబ , and ୫୧୬ ௦ = ଷ ଵವబ = ଷగ ଵವబ ୫୧୬ ௦ = ଷ ଵವబ = ଷగ ଵವబ 𝐿𝐷 = 𝑊𝑐𝑜𝑠𝛾 𝑊𝑠𝑖𝑛𝛾 © Shanghai Jiao Tong University – Dr. Wenbin Song School of Aeronautics and Astronautics Turning Gliding Flight • when sailplane turns at a bank angle ∅, the following relation holds (a component of the lift is used to turn) • This leads to a modified sink rate 52 𝐿𝑐𝑜𝑠∅ = 𝑊𝑐𝑜𝑠𝛾 ∅ R 𝑉௩ ≅ 1 cosଷ/ଶ ∅ 𝑊 𝑆 2 𝜌𝐶ଷ /𝐶 ଶ © Shanghai Jiao Tong University – Dr. Wenbin Song School of Aeronautics and Astronautics Sink Rate and Glide Ratio • Difference between sink rate and glide ratio 53 𝑉 ≅ 2𝑊 𝜌𝑆 𝐾 3𝐶 𝑉௩ ≅ 2𝑊 𝜌𝑆 𝐾 3𝐶 𝑉 = 2𝑊 𝜌𝑆 𝐾 𝐶 𝑉୫୧୬ ௧௨௦௧ = 2𝑊 𝜌𝑆 𝐾 𝐶 The velocity for min sink rate is 76% of that for best glide ratio © Shanghai Jiao Tong University – Dr. Wenbin Song School of Aeronautics and Astronautics LANDING PERFORMANCE 54
2018/4/27 Approach and Landing Sequence 因上声克通大警 Approach 国上清大学 The landing phase is split into several segments The approach path is typically made at 3'to the horizontal Approach -Fare Ground roll Approach speed is defined as (1.2~1.3)Vs Landing distance is the sum of distances required by each phase SA=(obstacle height-hg)/tany hE =r-Y4YA12 oo etin ong rn enbin Song Flare-Air Run 国上活大坐 Ground Run Distance 国上活支大峰 A simplified approach assumes that the angular acceleration may On the simplest level,assuming constant deceleration(-a),the be ignored distance covered from V to 0 is V/2 T+Wsiny-D=mdv/dt T-D+wy=mVdv/dx=(W/2g)dv/dx ·On the next level,, L-Weosy=md(Rdy/dt)/dt= L-W=o dv/dt=(/2g)dva/dx=(T/W)-(D/W)-(F/W) 0 5. dv/dx=2g[(T-D)/L+y] (D/W)=Cp.P.6V/2(W/S) Assuming T=o,and y,takes the average value (F/W)=msr (1-L/W)=mroke [1-CLP.6V-/2(W/S)] V-V2=2g[-(D/L)w+Y.]s. 。=(/2g-V2]/[-DL)r+Y.》 Ground distance can be computed from the above equation V=(1.2-1.25y. V,=13W, S.=[(W/S)/(49Pa6CLm)/[-(D/L)+Y] 8oaoT二Wenbin ong Other Aircraft Performance Most Important Aircraft Performance Characteristics 图上洋大峰 Characteristics 圈上海文大学 Common set of performance measures Capabilities of aircraft can be mostly represented by Turn rate,corner speed,load factor etc -Maximum speed Other performance measures of merit Stalling speed -Control speed and altitude separately Besting climbing speed prns,ormle are ypa Best glide speed Rate of climb -Performance with Thrust vectoring -Ceilings -Store release -Maximum rang and speed for maximum range -Dynamic turn and speed endurance sy-Dr.Wenbin Song 10
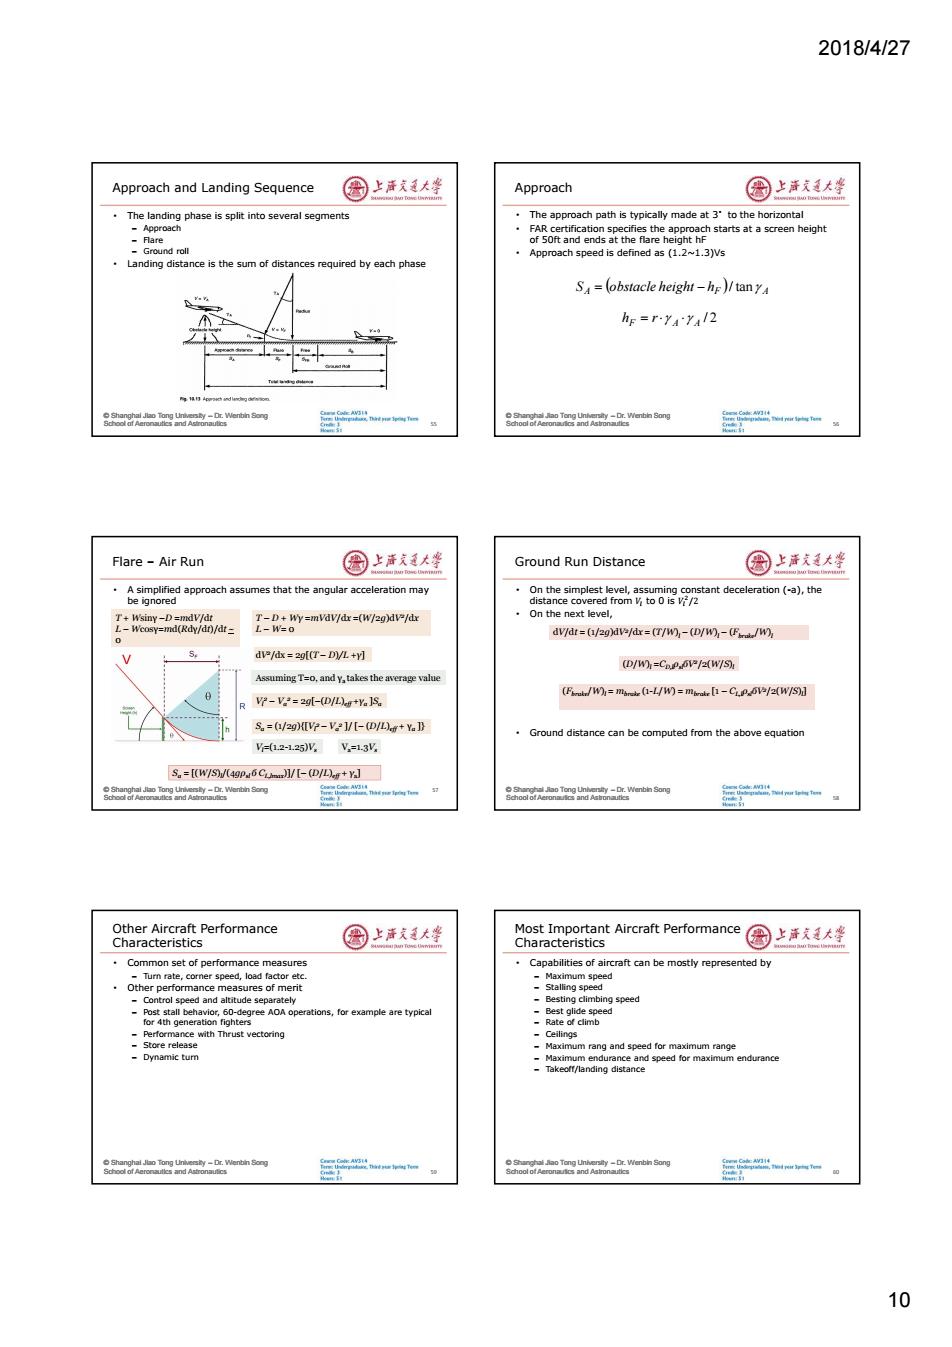
2018/4/27 10 © Shanghai Jiao Tong University – Dr. Wenbin Song School of Aeronautics and Astronautics Approach and Landing Sequence • The landing phase is split into several segments – Approach – Flare – Ground roll • Landing distance is the sum of distances required by each phase 55 © Shanghai Jiao Tong University – Dr. Wenbin Song School of Aeronautics and Astronautics Approach • The approach path is typically made at 3°to the horizontal • FAR certification specifies the approach starts at a screen height of 50ft and ends at the flare height hF • Approach speed is defined as (1.2~1.3)Vs 56 SA obstacle height hF A / tan hF r A A / 2 © Shanghai Jiao Tong University – Dr. Wenbin Song School of Aeronautics and Astronautics Flare – Air Run • A simplified approach assumes that the angular acceleration may be ignored 57 T + Wsinγ –D =mdV/dt L – Wcosγ=md(Rdγ/dt)/dt ~ 0 T – D + Wγ =mVdV/dx =(W/2g)dV2 /dx L – W= 0 dV2 /dx = 2g[(T – D)/L +γ] Vl2 – Va 2 = 2g[–(D/L)eff +γa ]Sa Assuming T=0, and γa takes the average value Sa = (1/2g){[Vl2 – Va 2 ]/ [– (D/L)eff + γa ]} Vl=(1.2-1.25)Vs Va=1.3Vs Sa = [(W/S)l/(4gρsl б CL,lmax)]/ [– (D/L)eff + γa ] © Shanghai Jiao Tong University – Dr. Wenbin Song School of Aeronautics and Astronautics Ground Run Distance • On the simplest level, assuming constant deceleration (-a), the distance covered from 𝑉 to 0 is 𝑉ଶ /2 • On the next level, • Ground distance can be computed from the above equation 58 dV/dt = (1/2g)dV2 /dx = (T/W)l – (D/W)l – (Fbrake/W)l (D/W)l =CD,lρslбV2 /2(W/S)l (Fbrake/W)l = mbrake (1-L/W) = mbrake [1 – CL,lρslбV2 /2(W/S)l] © Shanghai Jiao Tong University – Dr. Wenbin Song School of Aeronautics and Astronautics Other Aircraft Performance Characteristics • Common set of performance measures – Turn rate, corner speed, load factor etc. • Other performance measures of merit – Control speed and altitude separately – Post stall behavior, 60-degree AOA operations, for example are typical for 4th generation fighters – Performance with Thrust vectoring – Store release – Dynamic turn 59 © Shanghai Jiao Tong University – Dr. Wenbin Song School of Aeronautics and Astronautics Most Important Aircraft Performance Characteristics • Capabilities of aircraft can be mostly represented by – Maximum speed – Stalling speed – Besting climbing speed – Best glide speed – Rate of climb – Ceilings – Maximum rang and speed for maximum range – Maximum endurance and speed for maximum endurance – Takeoff/landing distance 60