2018/3/11 国上活大坐 Overview of Lectures 国上清大学 0.Overview 14/15 Performance(a,b) 16.Aircraft certification 2.Overall configuration 17.Aviation economics 18.System integration and estimation configuration management Aircraft Design Fuselage design 19.Multidisciplinary design 6/7/8 Aerodynamic design(a,b,c) ootimization (飞行器设计) .hat and ing 20.Military aircraft design-overview 21.Environmental issues 10.Landing gear and Aircraft systems 22.Desian skills 11.Power plant Wenbin Song 12.Stability and control School of Aeronautics and Astronautics 13.Loads,materials and structures Shangy o r nd 0171 Soor an0 Weight estimate needs to be refined 圈上活大坐 Detailed Mass Calculation 国上道大坐 The first weight estimate has been made based on mission profile, Descriotion engine properties,aerodynamic characters,data from similar aircraft-it is fast,but it is relatively crude aces (tailcl Notes: The weight estimate needs to be refined -Calculate weight based on cor 1.For fuselage mounted ent o M Wing,engine,fuselsge,control surfaces.tall,systemns ng control surfaces and flaps main undercarriage,the Geometry parameters,historical data and empirical interpolstions are used Engine+nacelle M Undercarriage(induding nose and main) -Weight calculation will be progressively refined,with the availability of S8sednd Surface controls CAD data Propulsion system 2.For initial calculations M Fixed equipment (electrical and Op (residual value+ost safety equipment) M Operational empty M Crew M Payload E eagaea2-w58 Fuselage group 国上洋大坐 Wing Group 圆上海文大华 The wing mass can be estimated by Symbol Description M=0.02126(S M fuselaze mass n. in which,R=M+Mr+ 2-MENG'「2-AMas-Bar 0.4-B 04-B Anfm四x.speed M6=0.039-(2-Lp-D√o)5 The fuselage mass needs to be adjusted with configurations eending type 2 n be Configuration Type +8% Pressurized cabin a-engine,39%-38% 4% Fuselare moanted ensines inne 7¥ Fuselage mounted +10 .4% Fuselage free from discontinulty 1
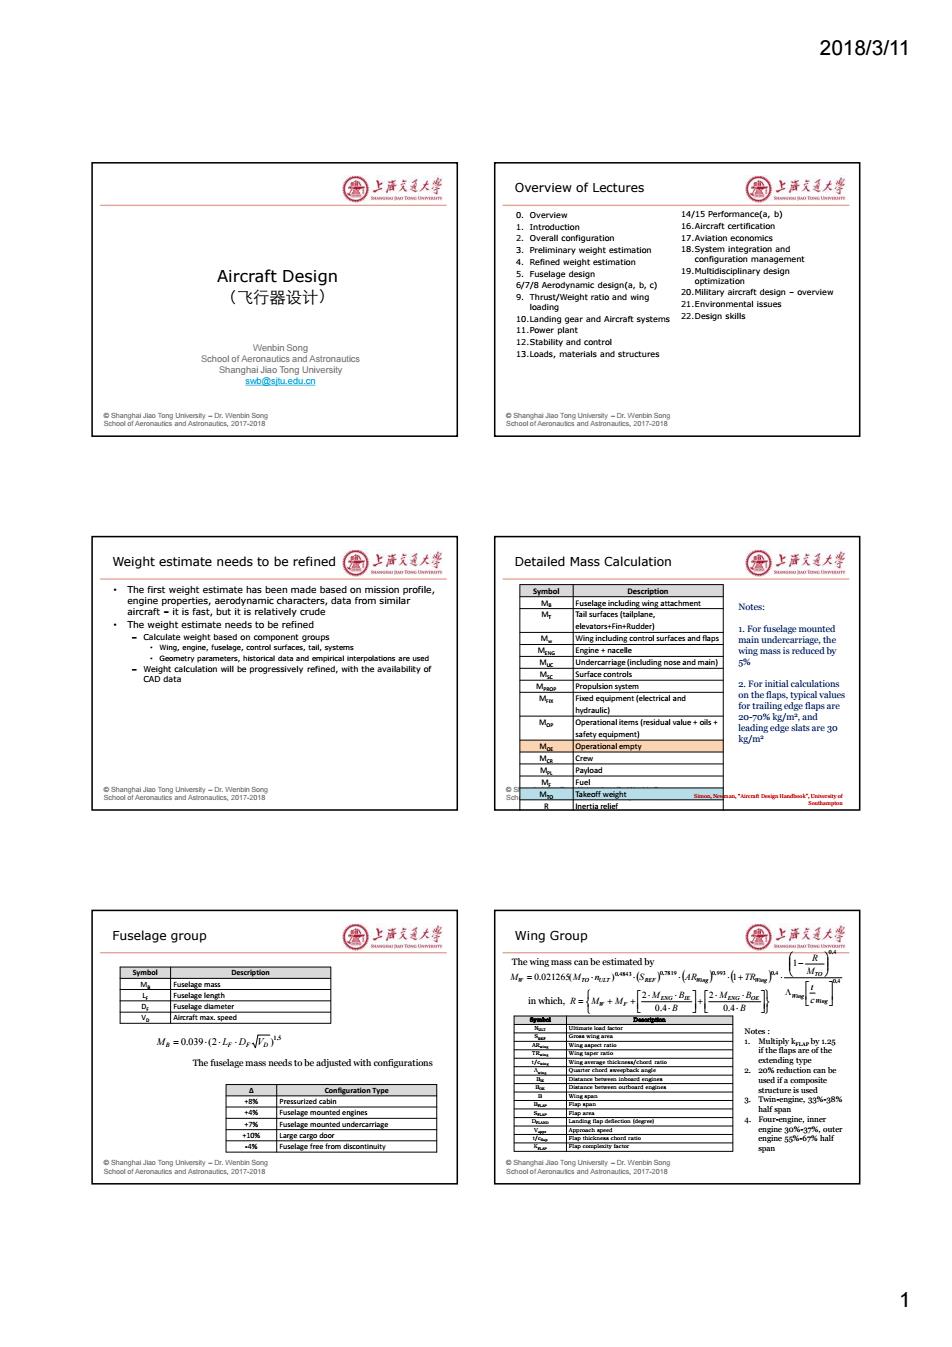
2018/3/11 1 © Shanghai Jiao Tong University – Dr. Wenbin Song School of Aeronautics and Astronautics, 2017-2018 Wenbin Song School of Aeronautics and Astronautics Shanghai Jiao Tong University swb@sjtu.edu.cn Aircraft Design (飞行器设计) © Shanghai Jiao Tong University – Dr. Wenbin Song School of Aeronautics and Astronautics, 2017-2018 Overview of Lectures 0. Overview 1. Introduction 2. Overall configuration 3. Preliminary weight estimation 4. Refined weight estimation 5. Fuselage design 6/7/8 Aerodynamic design(a, b, c) 9. Thrust/Weight ratio and wing loading 10.Landing gear and Aircraft systems 11.Power plant 12.Stability and control 13.Loads, materials and structures 14/15 Performance(a, b) 16.Aircraft certification 17.Aviation economics 18.System integration and configuration management 19.Multidisciplinary design optimization 20.Military aircraft design – overview 21.Environmental issues 22.Design skills © Shanghai Jiao Tong University – Dr. Wenbin Song School of Aeronautics and Astronautics, 2017-2018 Weight estimate needs to be refined • The first weight estimate has been made based on mission profile, engine properties, aerodynamic characters, data from similar aircraft – it is fast, but it is relatively crude • The weight estimate needs to be refined – Calculate weight based on component groups • Wing, engine, fuselage, control surfaces, tail, systems • Geometry parameters, historical data and empirical interpolations are used – Weight calculation will be progressively refined, with the availability of CAD data © Shanghai Jiao Tong University – Dr. Wenbin Song School of Aeronautics and Astronautics, 2017-2018 Detailed Mass Calculation Symbol Description MB Fuselage including wing attachment MT Tail surfaces (tailplane, elevators+Fin+Rudder) Mw Wing including control surfaces and flaps MENG Engine + nacelle MUC Undercarriage (including nose and main) MSC Surface controls MPROP Propulsion system MFIX Fixed equipment (electrical and hydraulic) MOP Operational items (residual value + oils + safety equipment) MOE Operational empty MCR Crew MPL Payload MF Fuel MTO Takeoff weight R Inertia relief Notes: 1. For fuselage mounted main undercarriage, the wing mass is reduced by 5% 2. For initial calculations on the flaps, typical values for trailing edge flaps are 20-70% kg/m2 , and leading edge slats are 30 kg/m2 Simon, Newman, “Aircraft Design Handbook”, University of Southampton © Shanghai Jiao Tong University – Dr. Wenbin Song School of Aeronautics and Astronautics, 2017-2018 Fuselage group Symbol Description MB Fuselage mass LF Fuselage length DF Fuselage diameter VD Aircraft max. speed Δ Configuration Type +8% Pressurized cabin +4% Fuselage mounted engines +7% Fuselage mounted undercarriage +10% Large cargo door -4% Fuselage free from discontinuity 1.5 0.039 (2 ) MB LF DF VD The fuselage mass needs to be adjusted with configurations © Shanghai Jiao Tong University – Dr. Wenbin Song School of Aeronautics and Astronautics, 2017-2018 Wing Group 0.4 0.4 0.4843 0.7819 0.993 0.4 1 0.021265( ) 1 Wing Wing TO W TO ULT REF Wing Wing c t M R M M n S AR TR B M B B M B R M M ENG IE ENG OE W F 0.4 2 0.4 2 The wing mass can be estimated by in which, Symbol Description NULT Ultimate load factor SREF Gross wing area ARwing Wing aspect ratio TRwing Wing taper ratio t/cwing Wing average thickness/chord ratio Λwing Quarter chord sweepback angle BIE Distance between inboard engines BOE Distance between outboard engines B Wing span BFLAP Flap span SFLAP Flap area DFLAND Landing flap deflection (degree) Vappr Approach speed t/cflap Flap thickness chord ratio KFLAP Flap complexity factor Notes : 1. Multiply kFLAP by 1.25 if the flaps are of the extending type 2. 20% reduction can be used if a composite structure is used 3. Twin-engine, 33%-38% half span 4. Four-engine, inner engine 30%-37%, outer engine 55%-67% half span
2018/3/11 Wing group-flap mass 国上清庆大坐 Tail Group 国上清大学 The flap mass can be estimated by The tail mass can be estimated by MT Mn My Suk +Syky l mass Area of Fin Rudder 115 115 130D0 Notes: Values for ku and ky ranges from 22-32 kg/m",typical values are ku=25. k=28kg/m Mass of Nacelle,Landing Gear 国上活大坐 Propulsion group 国上清支大峰 Nacelle mass can be estimated by 6.8-T (T600kW) 1.43-M。 (M.10000kg) Symbol Description MyNacele mass In which, =87+.4-BPR TTotal Statk Engine Thrust Landing gear mass Symbol Descrlption M Engine bare mass Muc [4.45%(Existing Breaks) TEngine Static Thrust .35%(Modern Breaks) BPR Bypass Ratlo Surface controls(movable surfaceson the wing not included in the flaps) Mg=0.4-M% Notes Notes: c52017.2018 Fixed Equipment and Operational Items 国上清大学 Fuel Tank Volume 图上活大坐 Fixed equipment includes flight control systems and furnishings 14% Short-Haul Volume=o.33L[S,+Sz+o.5(S,+S,)l Mediio-Haul 8% Long-Haul Operational Items incude Base area S, Crew provisions including maps and flight manuals-okg Cammuter Service 045 Short-range service 0.68 Base area S2 snack-ocly Service. 227 Medium -range servoe 1.36 Medium-Ranre Servce6 25 Long-月ange Ser1ce 25 b. LonE-Range Service 862 M o.151 058 mbol Over-water&extended capaory (r) 2
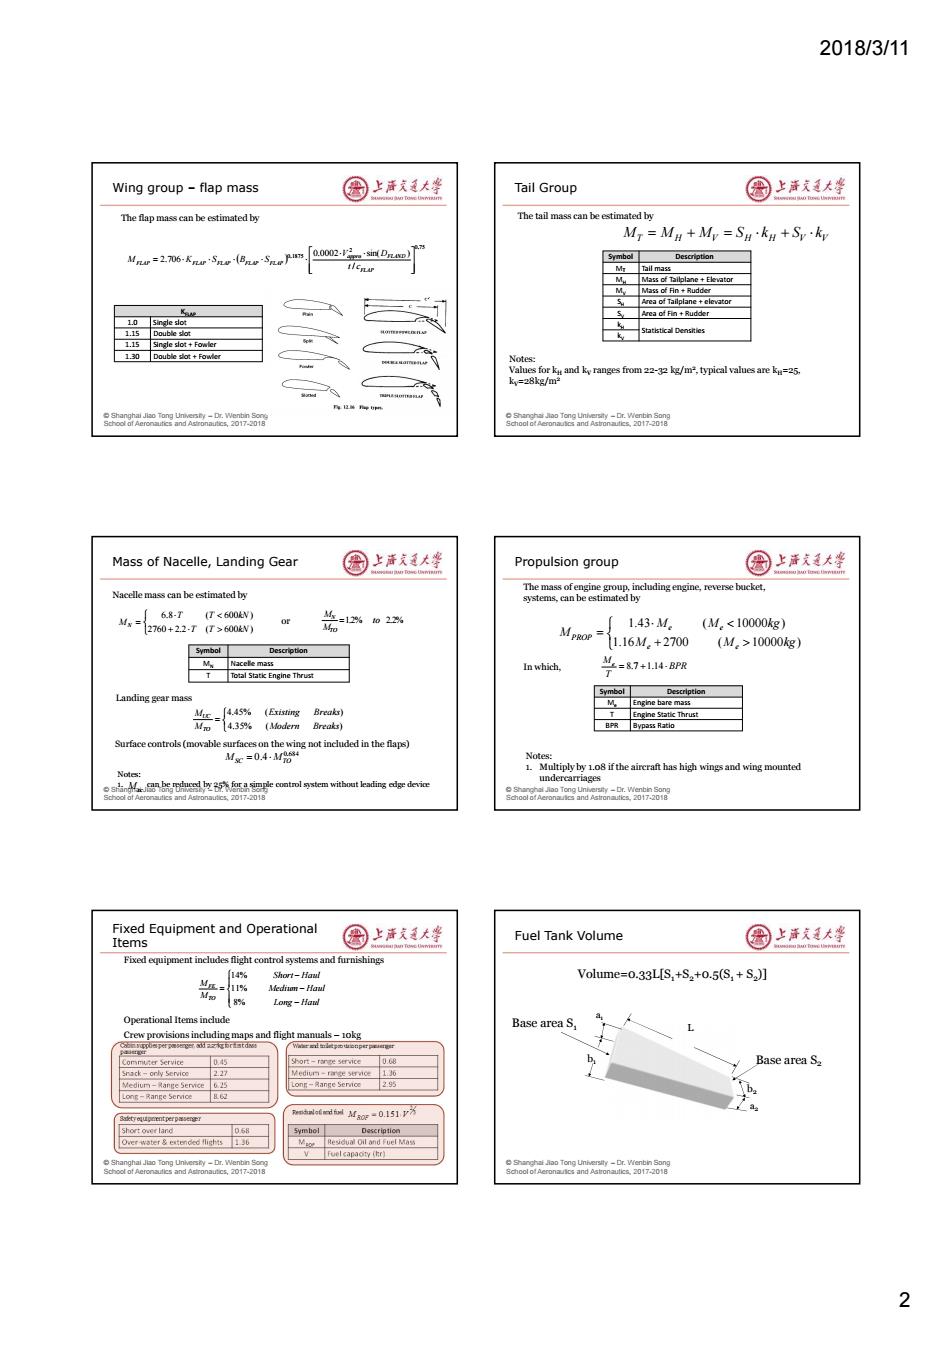
2018/3/11 2 © Shanghai Jiao Tong University – Dr. Wenbin Song School of Aeronautics and Astronautics, 2017-2018 Wing group – flap mass 0.75 2 0.1875 / 0.0002 sin( ) 2.706 FLAP appro FLAND FLAP FLAP FLAP FLAP FLAP t c V D M K S B S The flap mass can be estimated by KFLAP 1.0 Single slot 1.15 Double slot 1.15 Single slot + Fowler 1.30 Double slot + Fowler © Shanghai Jiao Tong University – Dr. Wenbin Song School of Aeronautics and Astronautics, 2017-2018 Tail Group Symbol Description MT Tail mass MH Mass of Tailplane + Elevator MV Mass of Fin + Rudder SH Area of Tailplane + elevator SV Area of Fin + Rudder kH Statistical Densities kV T H V H H V V M M M S k S k The tail mass can be estimated by Notes: Values for kH and kV ranges from 22-32 kg/m2 , typical values are kH=25, kV =28kg/m2 © Shanghai Jiao Tong University – Dr. Wenbin Song School of Aeronautics and Astronautics, 2017-2018 Mass of Nacelle, Landing Gear Symbol Description MN Nacelle mass T Total Static Engine Thrust 2760 2.2 ( 600 ) 6.8 ( 600 ) T T kN T T kN M N Nacelle mass can be estimated by 1.2% to 2.2% M M TO N or Landing gear mass 4.35% ( ) 4.45% ( ) Modern Breaks Existing Breaks M M TO UC Surface controls (movable surfaces on the wing not included in the flaps) 0.684 0.4 MSC MTO Notes: 1. can be reduced by 25% for a simple control system without leading edge device Msc © Shanghai Jiao Tong University – Dr. Wenbin Song School of Aeronautics and Astronautics, 2017-2018 Propulsion group Symbol Description Me Engine bare mass T Engine Static Thrust BPR Bypass Ratio The mass of engine group, including engine, reverse bucket, systems, can be estimated by BPR T Me 8.7 1.14 1.16 2700 ( 10000 ) 1.43 ( 10000 ) M M kg M M kg M e e e e PROP In which, Notes: 1. Multiply by 1.08 if the aircraft has high wings and wing mounted undercarriages © Shanghai Jiao Tong University – Dr. Wenbin Song School of Aeronautics and Astronautics, 2017-2018 Fixed Equipment and Operational Items Fixed equipment includes flight control systems and furnishings Long Haul Medium Haul Short Haul M M TO FE 8% 11% 14% Operational Items include Crew provisions including maps and flight manuals – 10kg 3 2 MROF 0.151V Commuter Service 0.45 Snack – only Service 2.27 Medium – Range Service 6.25 Long – Range Service 8.62 Cabin supplies per passenger, add 2.27kg for first class passenger Short – range service 0.68 Medium – range service 1.36 Long – Range Service 2.95 Water and toilet provision per passenger Short over land 0.68 Over-water & extended flights 1.36 Safety equipment per passenger Symbol Description MROF Residual Oil and Fuel Mass V Fuel capacity (ltr) Residual oil and fuel © Shanghai Jiao Tong University – Dr. Wenbin Song School of Aeronautics and Astronautics, 2017-2018 Fuel Tank Volume Volume=0.33L[S1+S2+0.5(S1 + S2 )] L b1a1 b2 a2 Base area S1 Base area S2
2018/3/11 Locating the Wing Group CG 图上声文大些 Locating the Fuselage Group CG 国上活大学 Fuselage centerline wingC.G.ato.7(X.-Xg) 0.42-0.45L 0.47L X水 front spar at 0.25C rear spar at o.6C 0.35b/2 YMAC Wing -mounted engin Fuselage-mounted engines Tail Group CG location 园上声文道大些 Landing Gear Weight and CG Location 圆上洋廷大整 -0.42c 0.42c b/2 Locating the landing gear Wing-mounted and using the 0.38b/ engines 0.17L weight 0.38h/ 0.55L estimates shown permits 0.42c. 2 0.42c Wing-mounted engines determination of the landing 门…8… gear CG 0.55h 0.14L 0.6L Aft-fuselage-mounted engines 038b/2 Fuselage-mounted uies and Asengines7-2018 Determination of Collective C.G 国圆上清发大坐 Results:Aircraft Weight Table 园上海文大学 fuselage skin main landing gear CG at rear spar and ozz(b/ang groupCG at o.X.X) fuel tank front spar at o.25C 0.35b/2+ 0.45b/2 mdi由tn Fudi Weiht I,) -b/2 M y-Dr.wer 3
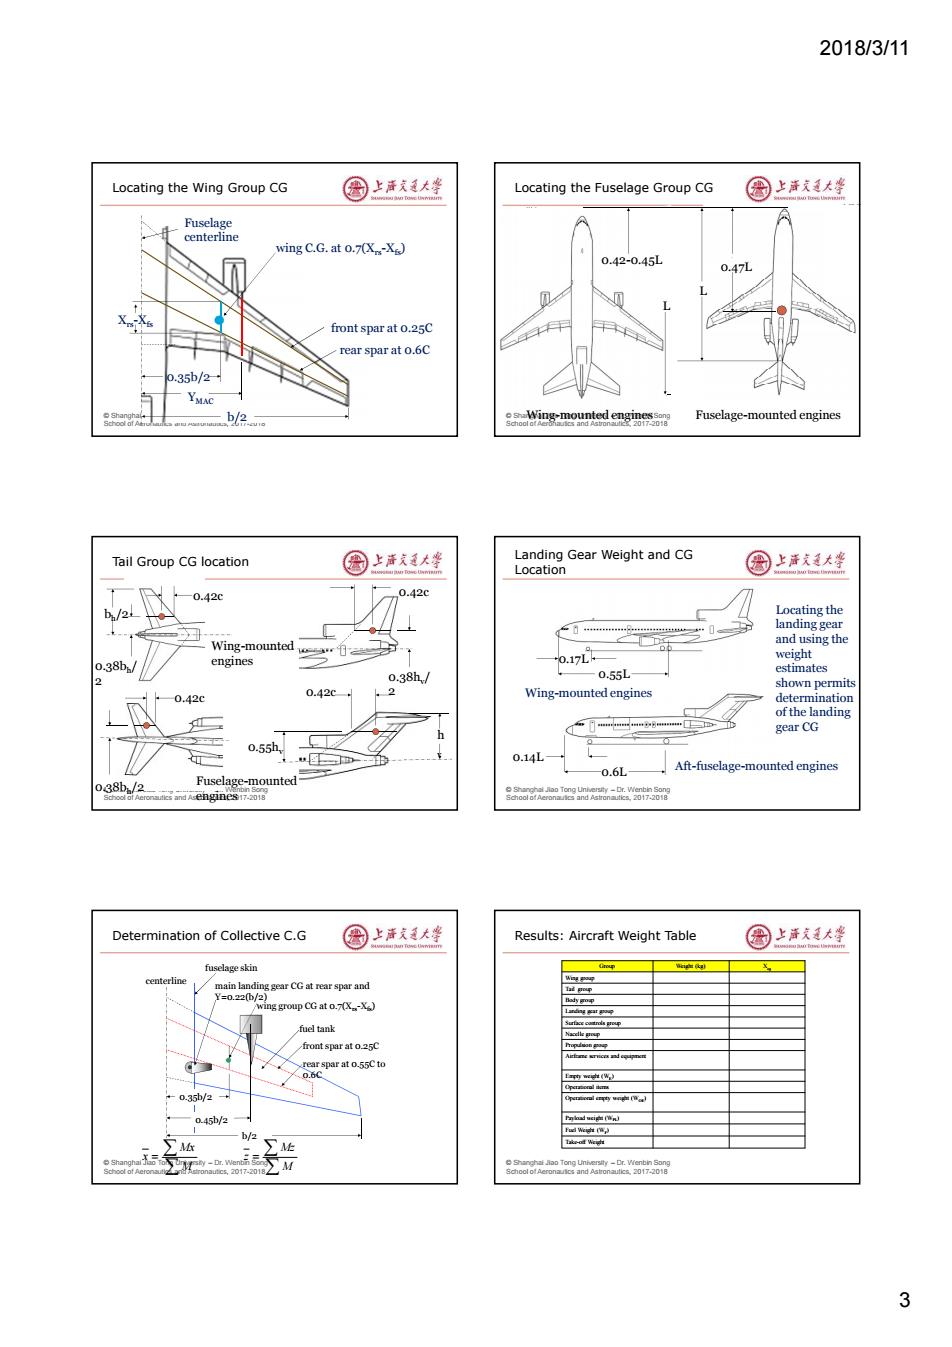
2018/3/11 3 © Shanghai Jiao Tong University – Dr. Wenbin Song School of Aeronautics and Astronautics, 2017-2018 b/2 0.35b/2 YMAC wing C.G. at 0.7(Xrs-Xfs) front spar at 0.25C rear spar at 0.6C Fuselage centerline Xrs-Xfs Locating the Wing Group CG © Shanghai Jiao Tong University – Dr. Wenbin Song School of Aeronautics and Astronautics, 2017-2018 0.42-0.45L L L 0.47L Wing-mounted engines Fuselage-mounted engines Locating the Fuselage Group CG © Shanghai Jiao Tong University – Dr. Wenbin Song School of Aeronautics and Astronautics, 2017-2018 0.42c bh /2 0.38bh / 2 0.55hv h v 0.42c 0.42c 0.38hv / 2 0.42c 0.38bh /2 Wing-mounted engines Fuselage-mounted engines Tail Group CG location © Shanghai Jiao Tong University – Dr. Wenbin Song School of Aeronautics and Astronautics, 2017-2018 0.17L 0.55L 0.6L 0.14L Locating the landing gear and using the weight estimates shown permits determination of the landing gear CG Wing-mounted engines Aft-fuselage-mounted engines Landing Gear Weight and CG Location © Shanghai Jiao Tong University – Dr. Wenbin Song School of Aeronautics and Astronautics, 2017-2018 0.35b/2 0.45b/2 b/2 front spar at 0.25C rear spar at 0.55C to 0.6C fuel tank wing group CG at 0.7(Xrs-Xfs) centerline fuselage skin main landing gear CG at rear spar and Y=0.22(b/2) Determination of Collective C.G M Mx x M Mz z © Shanghai Jiao Tong University – Dr. Wenbin Song School of Aeronautics and Astronautics, 2017-2018 Group Weight (kg) Xcg Wing group Tail group Body group Landing gear group Surface controls group Nacelle group Propulsion group Airframe services and equipment Empty weight (WE ) Operational items Operational empty weight (WOE) Payload weight (WPL) Fuel Weight (WF ) Take-off Weight Results: Aircraft Weight Table
2018/3/11 Locating the Center of Gravity Elevation View 园上声充通大学 Locating the Center of Gravity- Plan View 国上清大峰 XEG XO ·MAC XWG XLEMAC XLEMAC r nd 7 Aircraft Balance Diagram -(I) 圆上活文大坐 Aircraft Balance Diagram (II) 圆上活大蜂 Aircraft weight varies with the load and flight Variations of C.G.position affects 、 A-A:decided froma operational empty weight Stability A-B.or A'B':window seats being the andn rand tall sua taken by passengers C.G.variation will be presented in the balance diagram B-C.or B'C':aisles seats being taken E,cargo loaded into front eargo bay I.J.cargo loaded for the most rearward C.G.location rAer Aircraft Balance Diagram (III) 圆上洋道大坐 Aircraft Payload-Range Diagram 国上洋大学 Start from Aircraft OEM Fuel being added until reaching the volume capacity Maximum payload maybe set by either fuselage space or by structural strength Aircraft is designed to a MTOW After which,compromise must be made between payload and range The diagram is also limited by the allowable maximum landing mass (MLM) 4
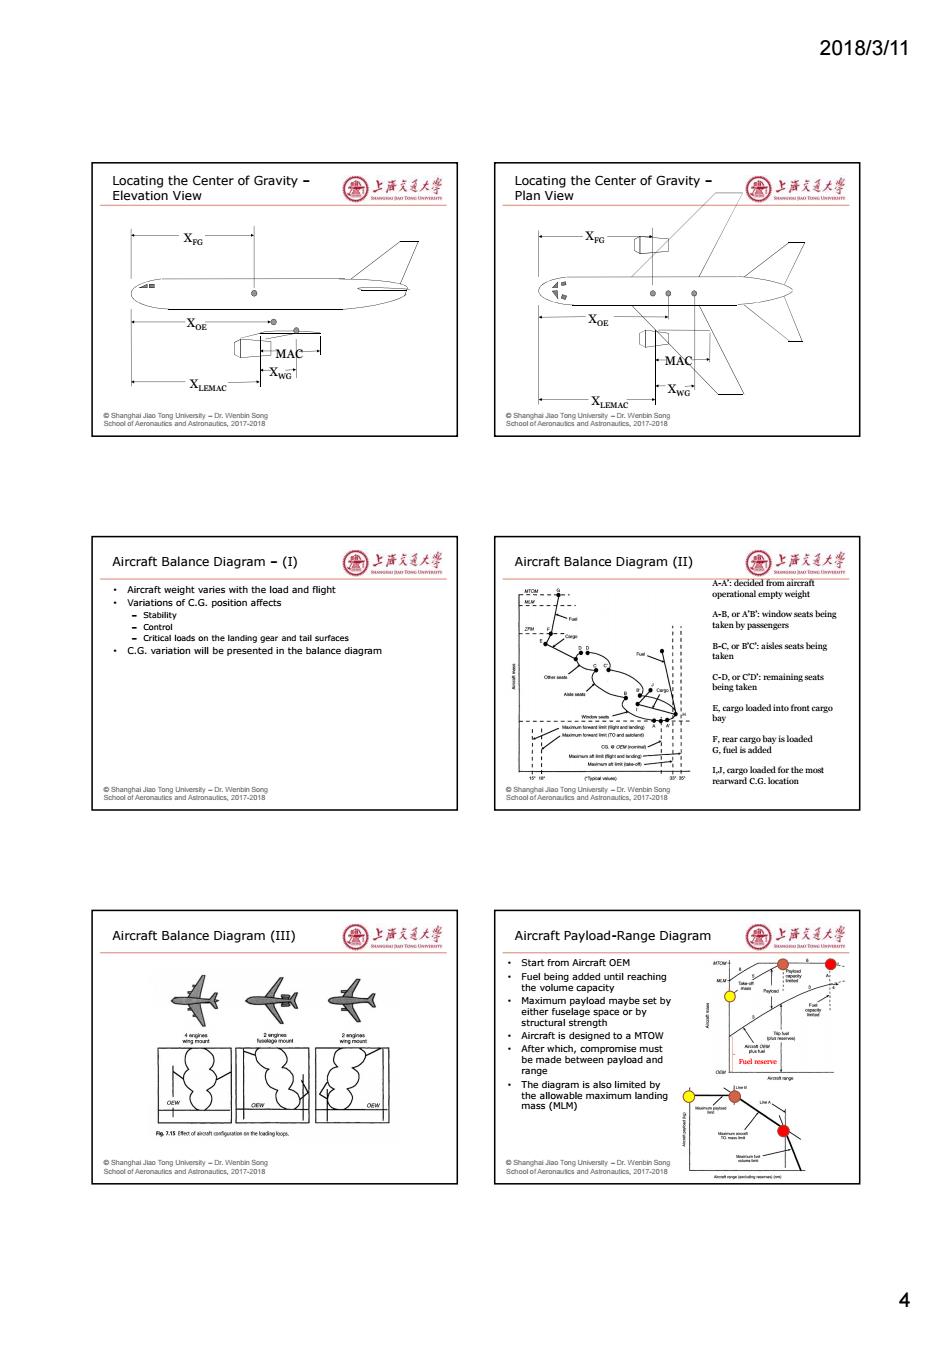
2018/3/11 4 © Shanghai Jiao Tong University – Dr. Wenbin Song School of Aeronautics and Astronautics, 2017-2018 XFG XOE XLEMAC MAC XWG Locating the Center of Gravity – Elevation View © Shanghai Jiao Tong University – Dr. Wenbin Song School of Aeronautics and Astronautics, 2017-2018 XFG XOE XLEMAC XWG MAC Locating the Center of Gravity – Plan View © Shanghai Jiao Tong University – Dr. Wenbin Song School of Aeronautics and Astronautics, 2017-2018 Aircraft Balance Diagram – (I) • Aircraft weight varies with the load and flight • Variations of C.G. position affects – Stability – Control – Critical loads on the landing gear and tail surfaces • C.G. variation will be presented in the balance diagram © Shanghai Jiao Tong University – Dr. Wenbin Song School of Aeronautics and Astronautics, 2017-2018 Aircraft Balance Diagram (II) A-A’: decided from aircraft operational empty weight A-B, or A’B’: window seats being taken by passengers B-C, or B’C’: aisles seats being taken C-D, or C’D’: remaining seats being taken E, cargo loaded into front cargo bay F, rear cargo bay is loaded G, fuel is added I,J, cargo loaded for the most rearward C.G. location © Shanghai Jiao Tong University – Dr. Wenbin Song School of Aeronautics and Astronautics, 2017-2018 Aircraft Balance Diagram (III) © Shanghai Jiao Tong University – Dr. Wenbin Song School of Aeronautics and Astronautics, 2017-2018 Aircraft Payload-Range Diagram • Start from Aircraft OEM • Fuel being added until reaching the volume capacity • Maximum payload maybe set by either fuselage space or by structural strength • Aircraft is designed to a MTOW • After which, compromise must be made between payload and range • The diagram is also limited by the allowable maximum landing mass (MLM) Fuel reserve
2018/3/11 Summary 圆上活发美大坐 国上清大学 Aircraft structural design strongly affected by the load factor Aircraft component breakdown and parametric estimation C.G.positioning very important for control,stability, payload/range e diagram to decide how far can ar Backup Slides o r nd 0171 Soor an0 Aerodynamic Force 圈上活大坐 The V-n Diagram 国上清大坐 L L=nW Civil aircraft:25g1.5(safety factor) design limit,n>o limit load CLmax limit maximum factor,n speed limit L=nW Lcosf Airworthiness:M+o. w f 0 Ve Load factor n=L/W W. design limit,n<o W1S)2 and 8oa6o0e四k-a88 5
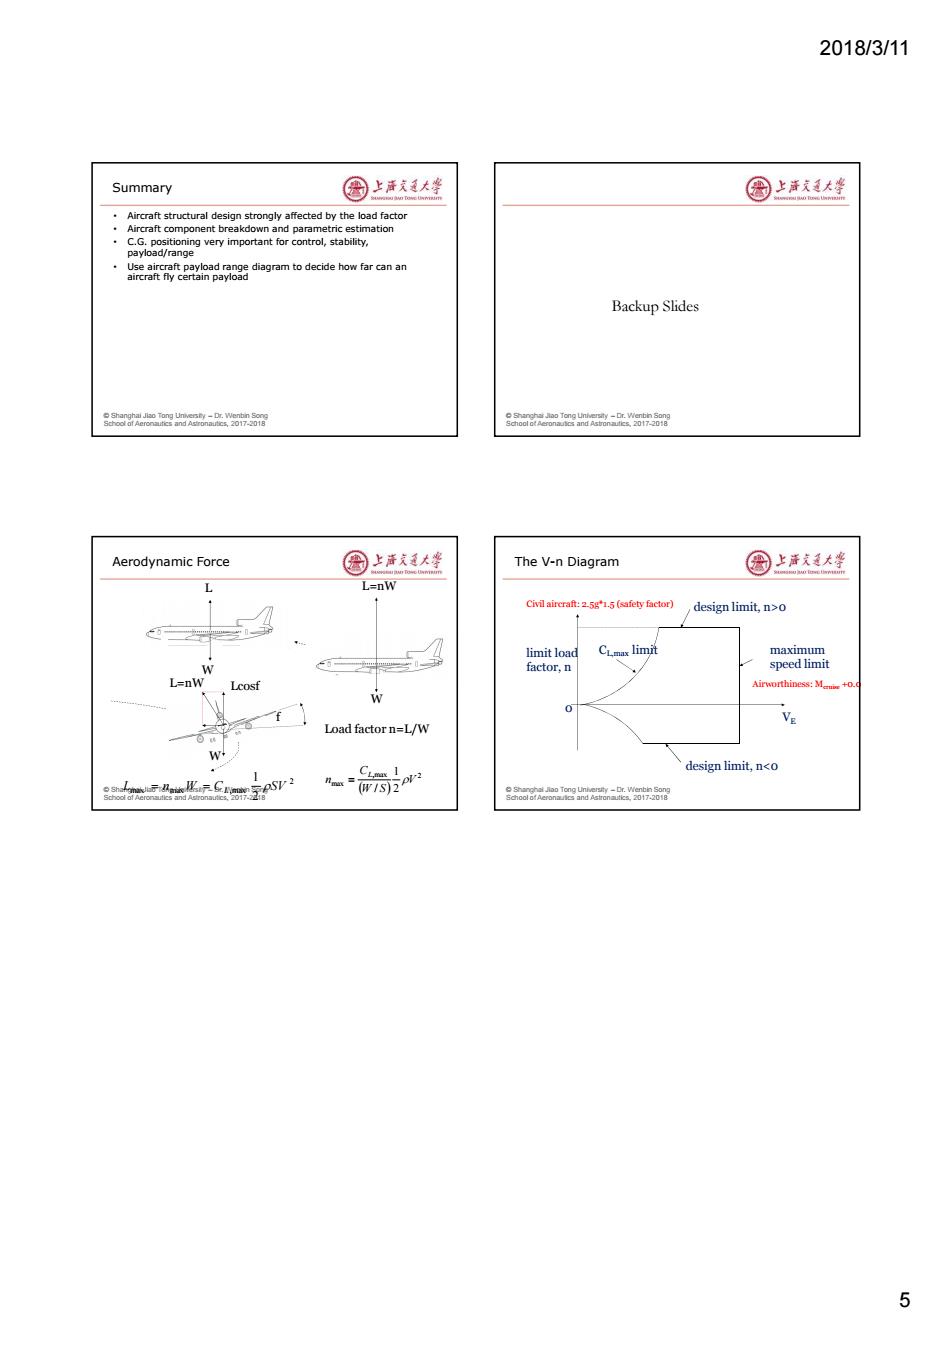
2018/3/11 5 © Shanghai Jiao Tong University – Dr. Wenbin Song School of Aeronautics and Astronautics, 2017-2018 Summary • Aircraft structural design strongly affected by the load factor • Aircraft component breakdown and parametric estimation • C.G. positioning very important for control, stability, payload/range • Use aircraft payload range diagram to decide how far can an aircraft fly certain payload © Shanghai Jiao Tong University – Dr. Wenbin Song School of Aeronautics and Astronautics, 2017-2018 Backup Slides © Shanghai Jiao Tong University – Dr. Wenbin Song School of Aeronautics and Astronautics, 2017-2018 L W L=nW W L=nW W f Lcosf Load factor n=L/W Aerodynamic Force 2 max max ,max 2 1 L n W CL SV ,max 2 max 2 1 / V W S C n L © Shanghai Jiao Tong University – Dr. Wenbin Song School of Aeronautics and Astronautics, 2017-2018 maximum speed limit limit load factor, n0 VE CL,max limit design limit, n>0 design limit, n<0 The V-n Diagram Airworthiness: Mcruise +0.05 Civil aircraft: 2.5g*1.5 (safety factor)