2016/12/21 大纲 第8章非参数回归 参考:王星2014非参数统计chap8 ·核光滑回归 ·局部多项式回归 ·稳健回归 ·*K近邻回归 ·*正交序列回归 ·*B-Spline 1.非参数回归 Parametric partial parametric .The aim of a regression analysis is to producea reasonable analysis 8o公Po Y =m(X)+o(x.)s. example.a linear mode y=x/'B+E, i=1,…,N Ualle () aaceonpaonad y,=m(x,+E, 1=1,…,N 之h2 obe y=x,B+m:(3)+ i=1,…,N Motivation 光滑回归的基本原理 提供更丰富的用于表达变量关系的祝角,表达非线性结构 eto be made whou )=n() (2) 不需要在固定的参数形式下获得预测 Every smoothing method to be described is of the form(2). .It provides a tool for finding spurious observations by studying the W.(x)=K.(x-X)/i(x) (3) nfluence of isolated points 提供了一种发现异常观测并研究它可能影响的方法 where j(x)=nK(x-),and K(u)=hK(u/h) 面刷整案存在染大或两食对快大适行有您指鱼时。它的适 symmetric real function which integrates to. 1
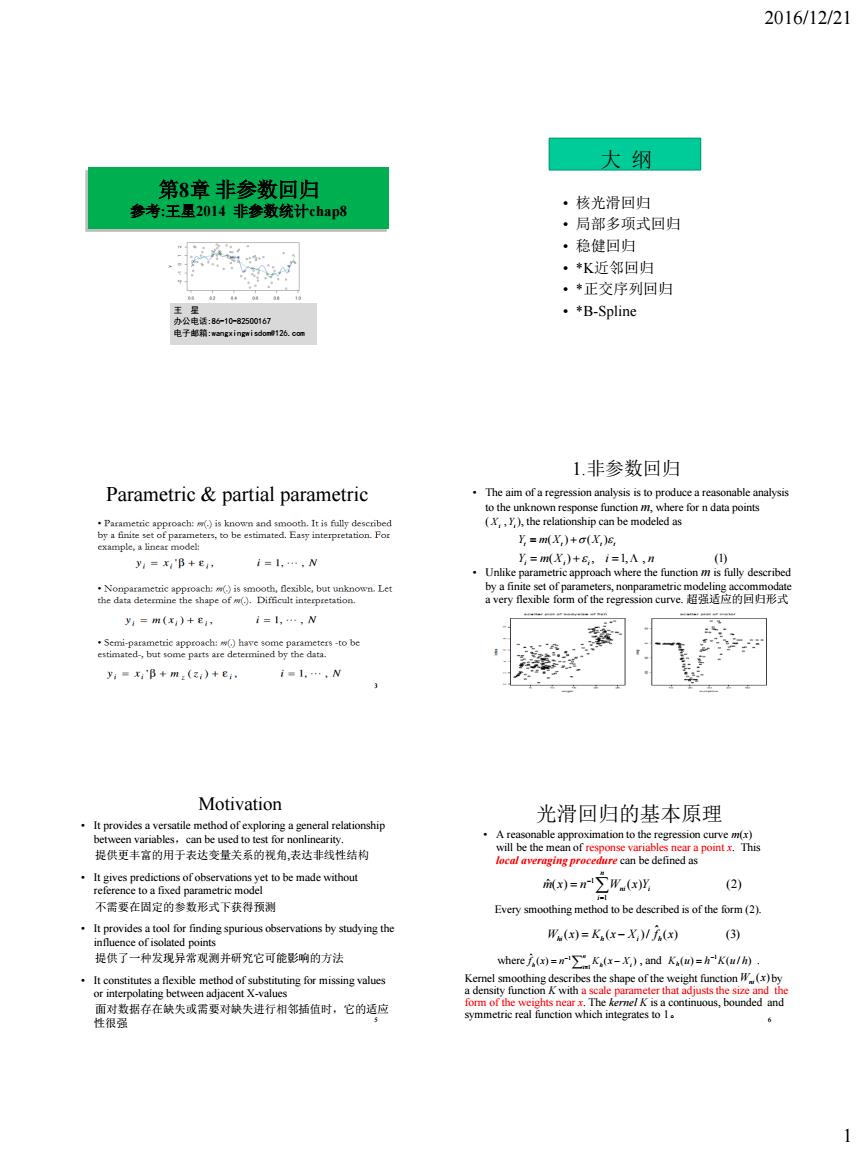
2016/12/21 1 第8章 非参数回归 参考:王星2014 非参数统计chap8 王 星 办公电话:86-10-82500167 电子邮箱:wangxingwisdom@126.com 大 纲 • 核光滑回归 • 局部多项式回归 • 稳健回归 • *K近邻回归 • *正交序列回归 • *B-Spline Parametric & partial parametric 3 4 1.非参数回归 • The aim of a regression analysis is to produce a reasonable analysis to the unknown response function m, where for n data points ( ), the relationship can be modeled as • Unlike parametric approach where the function m is fully described by a finite set of parameters, nonparametric modeling accommodate a very flexible form of the regression curve. 超强适应的回归形式 Xi Yi , Y m(X ) , i 1, , n (1) i i i ( ) ( ) Y m X X t t t t 5 Motivation • It provides a versatile method of exploring a general relationship between variables,can be used to test for nonlinearity. 提供更丰富的用于表达变量关系的视角,表达非线性结构 • It gives predictions of observations yet to be made without reference to a fixed parametric model 不需要在固定的参数形式下获得预测 • It provides a tool for finding spurious observations by studying the influence of isolated points 提供了一种发现异常观测并研究它可能影响的方法 • It constitutes a flexible method of substituting for missing values or interpolating between adjacent X-values 面对数据存在缺失或需要对缺失进行相邻插值时,它的适应 性很强 6 光滑回归的基本原理 • A reasonable approximation to the regression curve m(x) will be the mean of response variables near a point x. This local averaging procedure can be defined as Every smoothing method to be described is of the form (2). where , and . W (x) ni ( ) ( / ) 1 Kh u h K u h Kernel smoothing describes the shape of the weight function by a density function K with a scale parameter that adjusts the size and the form of the weights near x. The kernel K is a continuous, bounded and symmetric real function which integrates to 1。 ˆ( ) ( ) (2) 1 1 n i ni Yi m x n W x ( ) (3) ˆ W (x) K (x X )/ f x hi h i h n i h h Xi f x n K x 1 1 ( ) ( ) ˆ

2016/12/21 Kemel Smoothing核光滑 .The Nadaray-son esmator is defined by )=∑u-y (④ x-X 这里lkpac+wF:OF1A同 Figure 3.The ette 飞路估计中情的这择响卷手现信。带度的影响比较大 局部回归Loca Regression 2.局部多项式回归 同忆标准非参数型: y■m(X)+E。i■l,A,n -r+oe- 在特估计点附近做局部多项式拟合: w1()一k(】 -左,化-x-) 为了实现局部多项式估,我们无法择现武的阶数 品部多项式的的表示为: 复杂性, min(y-XB)'w(y-xB) 2
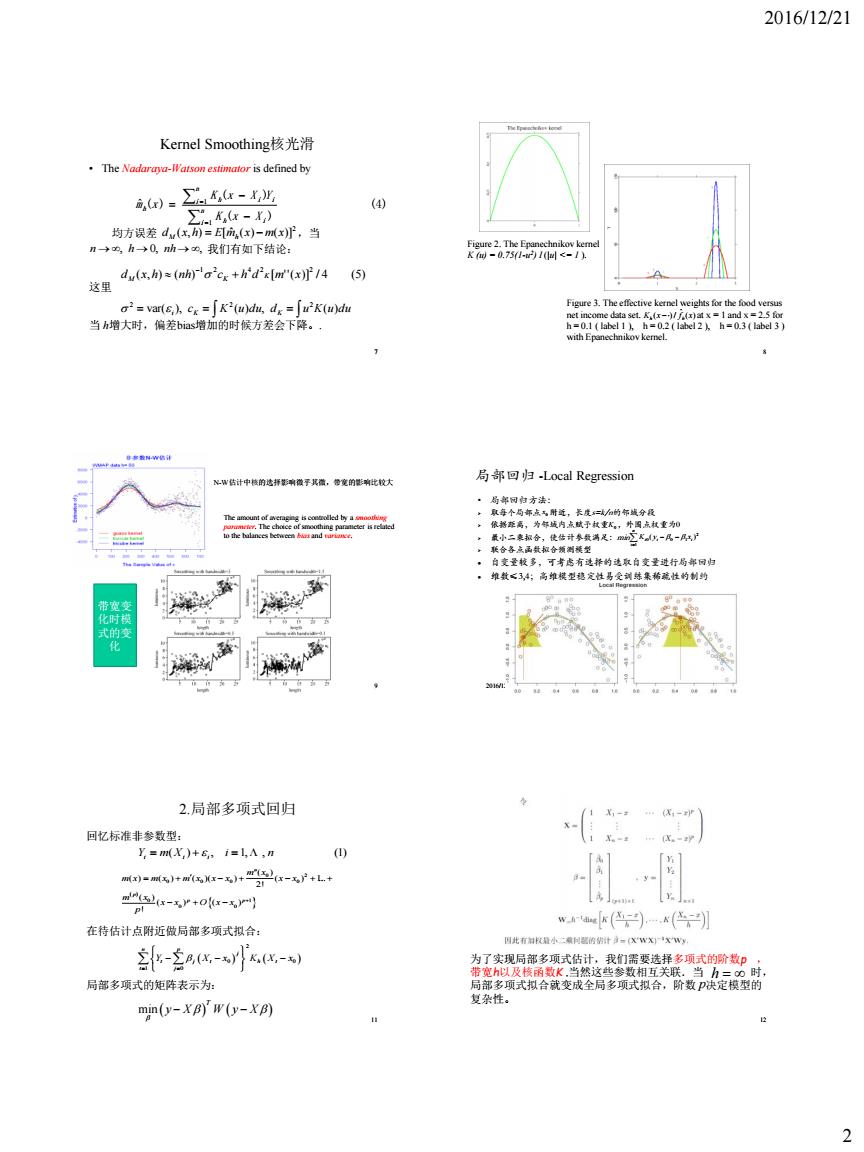
2016/12/21 2 7 Kernel Smoothing核光滑 • The Nadaraya-Watson estimator is defined by 均方误差 ,当 我们有如下结论: 这里 当 h增大时,偏差bias增加的时候方差会下降。. (4) ( ) ( ) ˆ ( ) 1 1 n i h i n i h i i h K x X K x X Y m x 2 d (x,h) E[m ˆ (x) m(x)] M h n , h 0, nh, ( , ) ( ) [ ''( )] / 4 (5) 1 2 4 2 2 d x h nh c h d K m x M K var( i), cK K (u)du, dK u K(u)du 2 2 2 8 Figure 2. The Epanechnikov kernel K (u) = 0.75(1-u 2 ) I (|u| <= 1 ). Figure 3. The effective kernel weights for the food versus net income data set. at x = 1 and x = 2.5 for h = 0.1 ( label 1 ), h = 0.2 ( label 2 ), h = 0.3 ( label 3 ) with Epanechnikov kernel. ( ) ˆ K (x )/ f x h h 9 The amount of averaging is controlled by a smoothing parameter. The choice of smoothing parameter is related to the balances between bias and variance. N-W估计中核的选择影响微乎其微,带宽的影响比较大 带宽变 化时模 式的变 化 2016/12/21 局部回归 -Local Regression • 局部回归方法: 取每个局部点 附近,长度s=k/n的邻域分段 依据距离,为邻域内点赋予权重 ,外围点权重为0 最小二乘拟合,使估计参数满足:min 联合各点函数拟合预测模型 自变量较多,可考虑有选择的选取自变量进行局部回归 维数≤3,4;高维模型稳定性易受训练集稀疏性的制约 0 x K0 n i i i i K y x 1 2 0 0 1 ( ) 11 2.局部多项式回归 0 2 0 0 0 0 0 1 0 0 ( ) ( ) ( ) ( )( ) ( ) ... 2! ( ) ( ) ( ) ! p p p m x m x m x m x x x x x m x x x O x x p L Y m(X ) , i 1, , n (1) i i i 回忆标准非参数型: 在待估计点附近做局部多项式拟合: 局部多项式的矩阵表示为: 2 0 0 1 0 n p j t j t h t t j Y X x K X x min T y X W y X 12 为了实现局部多项式估计,我们需要选择多项式的阶数p , 带宽h以及核函数K .当然这些参数相互关联.当 时, 局部多项式拟合就变成全局多项式拟合,阶数 决定模型的 复杂性。 h p

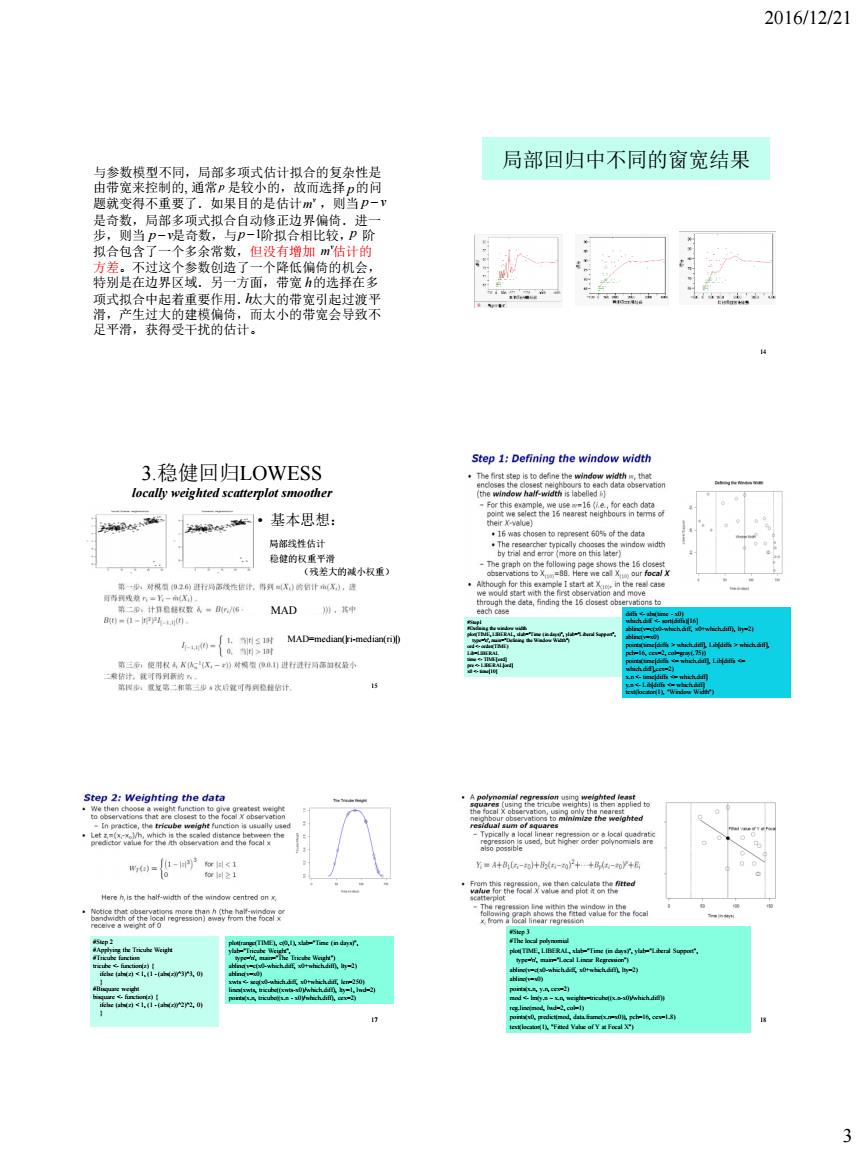
2016/12/21 局部回归中不同的窗宽结果 顿武变不重要了 如果目的是估计m,则当P一 3.稳健回归LOWESS Step1:Defining the window width locally weighted scatterplot smoothe 基本思想: e 16 ne 16,r MAD -{sMD-(i-mdn( the welgt -时
2016/12/21 3 与参数模型不同,局部多项式估计拟合的复杂性是 由带宽来控制的, 通常 是较小的,故而选择 的问 题就变得不重要了.如果目的是估计 ,则当 是奇数,局部多项式拟合自动修正边界偏倚.进一 步,则当 是奇数,与 阶拟合相比较, 阶 拟合包含了一个多余常数,但没有增加 估计的 方差。不过这个参数创造了一个降低偏倚的机会, 特别是在边界区域.另一方面,带宽 的选择在多 项式拟合中起着重要作用.太大的带宽引起过渡平 滑,产生过大的建模偏倚,而太小的带宽会导致不 足平滑,获得受干扰的估计。 p p v m p v p v p 1 p v m h h 局部回归中不同的窗宽结果 14 3.稳健回归LOWESS locally weighted scatterplot smoother • 基本思想: 局部线性估计 稳健的权重平滑 (残差大的减小权重) 15 MAD=median(|ri-median(ri)|) MAD 16 #Step1 #Defining the window width plot(TIME, LIBERAL, xlab="Time (in days)", ylab="Liberal Support", type='n', main="Defining the Window Width") ord which.diff], Lib[diffs > which.diff], pch=16, cex=2, col=gray(.75)) points(time[diffs <= which.diff], Lib[diffs <= which.diff],cex=2) x.n <- time[diffs <= which.diff] y.n <- Lib[diffs <= which.diff] text(locator(1), "Window Width") 17 #Step 2 #Applying the Tricube Weight #Tricube function tricube <- function(z) { ifelse (abs(z) < 1, (1 - (abs(z))^3)^3, 0) } #Bisquare weight bisquare <- function(z) { ifelse (abs(z) < 1, (1 - (abs(z))^2)^2, 0) } plot(range(TIME), c(0,1), xlab="Time (in days)", ylab="Tricube Weight", type='n', main="The Tricube Weight") abline(v=c(x0-which.diff, x0+which.diff), lty=2) abline(v=x0) xwts <- seq(x0-which.diff, x0+which.diff, len=250) lines(xwts, tricube((xwts-x0)/which.diff), lty=1, lwd=2) points(x.n, tricube((x.n - x0)/which.diff), cex=2) #Step 3 #The local polynomial plot(TIME, LIBERAL, xlab="Time (in days)", ylab="Liberal Support", type='n', main="Local Linear Regression") abline(v=c(x0-which.diff, x0+which.diff), lty=2) abline(v=x0) points(x.n, y.n, cex=2) mod <- lm(y.n ~ x.n, weights=tricube((x.n-x0)/which.diff)) reg.line(mod, lwd=2, col=1) points(x0, predict(mod, data.frame(x.n=x0)), pch=16, cex=1.8) text(locator(1), "Fitted Value of Y at Focal X") 18

2016/12/21 Step 4:The Nonparametric Curve Adjusting for outliers(1) Adjusting for outliers(3) ng both -很 Adjusting for outliers(4) )for data scts e,pres 4
2016/12/21 4 19 20 21 22 23 24 library(car) # for data sets data(Prestige) attach(Prestige) plot(income, prestige, xlab="Average Income", ylab="Prestige") lines(lowess(income, prestige, f=0.5, iter=0), lwd=2) lines(lowess(income, prestige, f=0.8, iter=0), lwd=2,col=4) lines(lowess(income, prestige, f=0.1, iter=0), lwd=2,col=6)

2016/12/21 普通的同部多项式国归 健的多项式回白 Interpreting the Local Regression 值的 s.9-185M entinpercretgntheregresson well the estimated 案例:NOx排放量与发动机性能之间的关系 Data:NOx排放物数据ethanol 重度雾霾政策解读一减少机动车行驶 动的压填比 据料空气当比 动机成动机高温作业下。可引发轻 NO 有关系 两个变量对实际会产生怎样的影响: ·模型中的参数是怎样估计的? 关系 alpha 21.by=0.02j 散点图和局部线性模型 . of freedom】 ines(fit)
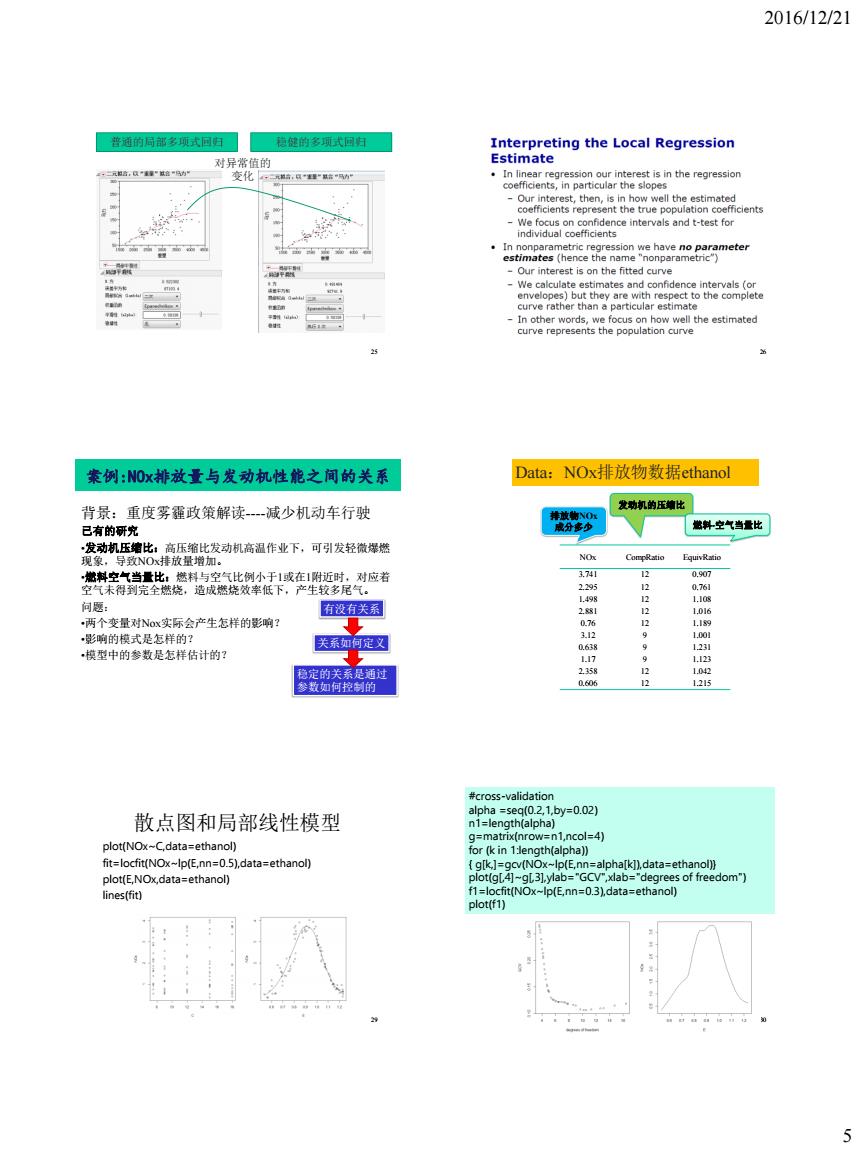
2016/12/21 5 25 普通的局部多项式回归 稳健的多项式回归 对异常值的 变化 26 案例:NOx排放量与发动机性能之间的关系 背景:重度雾霾政策解读----减少机动车行驶 已有的研究 •发动机压缩比:高压缩比发动机高温作业下,可引发轻微爆燃 现象,导致NOx排放量增加。 •燃料空气当量比:燃料与空气比例小于1或在1附近时,对应着 空气未得到完全燃烧,造成燃烧效率低下,产生较多尾气。 问题: •两个变量对Nox实际会产生怎样的影响? •影响的模式是怎样的? •模型中的参数是怎样估计的? 27 有没有关系 关系如何定义 稳定的关系是通过 参数如何控制的 NOx CompRatio EquivRatio 3.741 12 0.907 2.295 12 0.761 1.498 12 1.108 2.881 12 1.016 0.76 12 1.189 3.12 9 1.001 0.638 9 1.231 1.17 9 1.123 2.358 12 1.042 0.606 12 1.215 排放物NOx 成分多少 发动机的压缩比 燃料-空气当量比 Data:NOx排放物数据ethanol 散点图和局部线性模型 plot(NOx~C,data=ethanol) fit=locfit(NOx~lp(E,nn=0.5),data=ethanol) plot(E,NOx,data=ethanol) lines(fit) 29 30 #cross-validation alpha =seq(0.2,1,by=0.02) n1=length(alpha) g=matrix(nrow=n1,ncol=4) for (k in 1:length(alpha)) { g[k,]=gcv(NOx~lp(E,nn=alpha[k]),data=ethanol)} plot(g[,4]~g[,3],ylab="GCV",xlab="degrees of freedom") f1=locfit(NOx~lp(E,nn=0.3),data=ethanol) plot(f1)

2016/12/21 ft1-locfit(NOx-lp(C.E.nn=03,scale-0)data=ethanol) plot(fit1) 6
2016/12/21 6 fit1=locfit(NOx~lp(C,E,nn=0.3,scale=0),data=ethanol) plot(fit1) 31 高排量 汽车 发动机不 充分燃烧