应用统计方法大作业指导 Dayu Wu 2022/6/13 评分细则及注意事项 本次大作业将作为期末评分重要指标,请同学们认真对待。你需要展示在本门课所学到的知识和技能 包括但不限于:寻找和处理数据集,使用R中的函数和包,统计检验,模型解释,异常和结果分析。课 程内容主要由回归和时间序列两部分组成,同学们只需仍选其中一类数据完成作业即可。根据反内卷 原侧,篇幅短且满足以下要求的会酌情加分。 评分细则如下:1.报告是否清楚的解释了数据来源,数据背景和动机(10) 2.描述性统计的分析是否完整,正确(10) 3.模型建立选取的方法是否合适(10) 4.是否有深入的分析和模型调整,例如:异常值,稳健性,归一化等(10) 5.可视化技能和美观性:描述性统计的各种图,数据散点图,模型拟合图,误差图等(10) 6.统计学方法掌握的程度(需包含一定公式):描述性统计,检验,拟合,方差分析,异常处理等 (10) 7.可读性:图文配合,行文严谨流畅,格式规范(10) 8.创新性,例如:使用非现有数据,使用课程大纲外的统计方法,参考部分相关论文等(10) 9.是否按时提交了原创性的报告(10) 10.报告最后是否完整的总结了分析所得结论,结论是否有意义和足够的支撑(10) 因课程总评分时间有限,本次大作业报告最好在6月20日前提交,如需补交请主动找助教确认最后提 交时间,以免影响最后总评。注意:抄袭和使用网上已经有的任何报告将视为放弃大作业成绩。 附录:爬虫的使用 如果要使用爬虫收集数据,推荐使用rvest,具体教程参考:https:/wvw.cnblogs.com/adam012019/p /14862610.html 例如,运行下面这个爬虫可以爬取一本英文小说
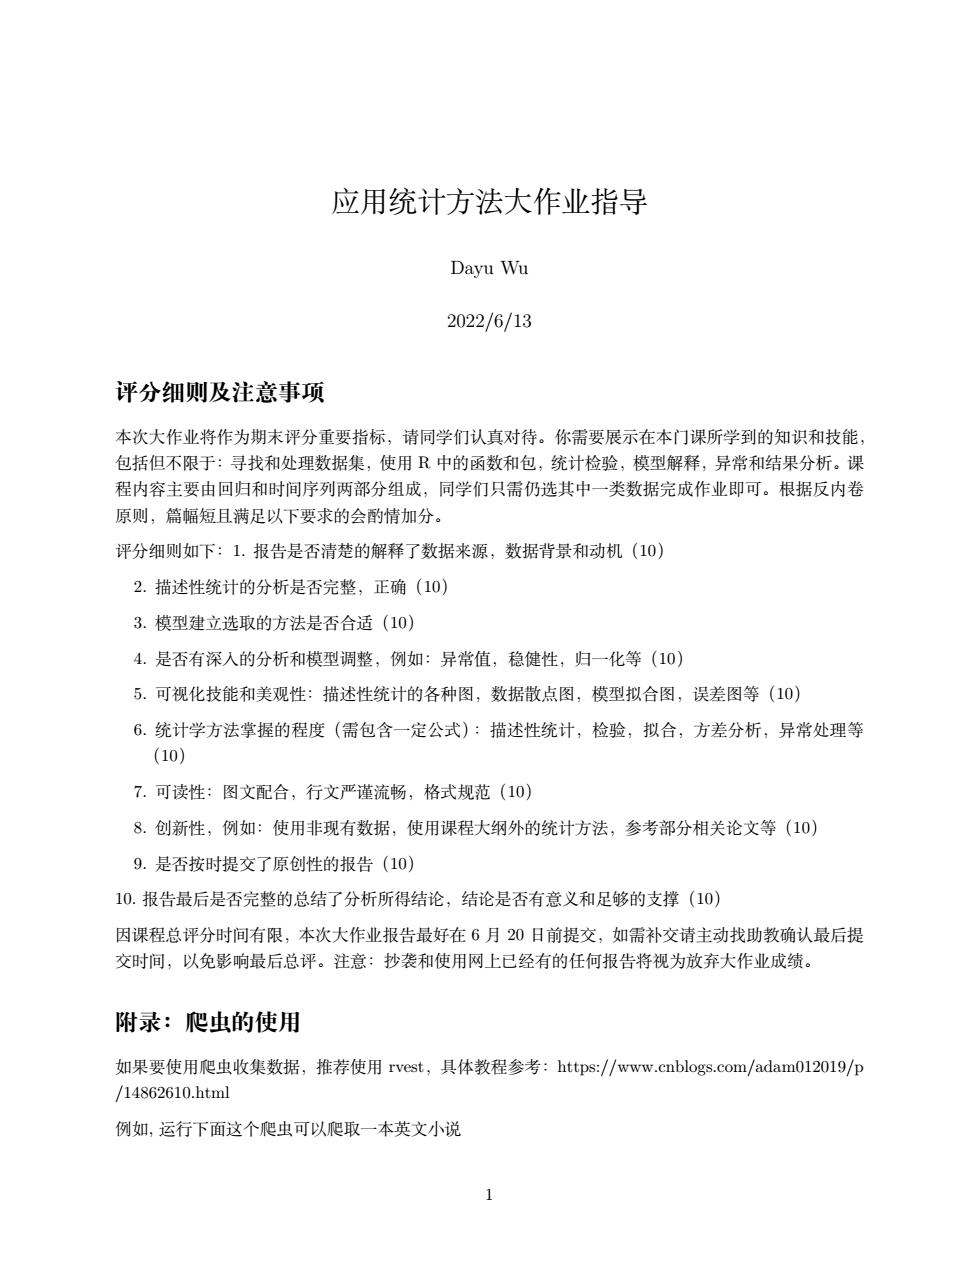
应用统计方法大作业指导 Dayu Wu 2022/6/13 评分细则及注意事项 本次大作业将作为期末评分重要指标,请同学们认真对待。你需要展示在本门课所学到的知识和技能, 包括但不限于:寻找和处理数据集,使用 R 中的函数和包,统计检验,模型解释,异常和结果分析。课 程内容主要由回归和时间序列两部分组成,同学们只需仍选其中一类数据完成作业即可。根据反内卷 原则,篇幅短且满足以下要求的会酌情加分。 评分细则如下:1. 报告是否清楚的解释了数据来源,数据背景和动机(10) 2. 描述性统计的分析是否完整,正确(10) 3. 模型建立选取的方法是否合适(10) 4. 是否有深入的分析和模型调整,例如:异常值,稳健性,归一化等(10) 5. 可视化技能和美观性:描述性统计的各种图,数据散点图,模型拟合图,误差图等(10) 6. 统计学方法掌握的程度(需包含一定公式):描述性统计,检验,拟合,方差分析,异常处理等 (10) 7. 可读性:图文配合,行文严谨流畅,格式规范(10) 8. 创新性,例如:使用非现有数据,使用课程大纲外的统计方法,参考部分相关论文等(10) 9. 是否按时提交了原创性的报告(10) 10. 报告最后是否完整的总结了分析所得结论,结论是否有意义和足够的支撑(10) 因课程总评分时间有限,本次大作业报告最好在 6 月 20 日前提交,如需补交请主动找助教确认最后提 交时间,以免影响最后总评。注意:抄袭和使用网上已经有的任何报告将视为放弃大作业成绩。 附录:爬虫的使用 如果要使用爬虫收集数据,推荐使用 rvest,具体教程参考:https://www.cnblogs.com/adam012019/p /14862610.html 例如, 运行下面这个爬虫可以爬取一本英文小说 1
library(rvest) for(c1n1:238){ url %html_text() cat(chp,file ="inthislife.txt",fill=FALSE,labels NULL,append TRUE) 附录:一个简单例子 这个例子的评分如下 1.报告清楚的解释了数据来源,数据背景和动机(10) 2.描述性统计的分析正确(10) 3.模型建立选取的方法比较合适(10) 4.对线性模型加入了非线性变量从而提高了拟合度(10) 5.可视化技能和美观性(10) 6.完成了描述性统计和显著性检验(10) 7.可读性:图文配合,行文严谨流畅,格式规范(10) 8.创新性:使用了sharpley回归(1o) 9.按时提交了原创性的报告(10) 10.报告最后总结了分析所得结论(10) 背景简介 来源:本指导使用的样例来自Kaggle,“Hypothesis Testing and EDA”,作者为Francis Paul C.Flores。 背景:以赚取利润,保险公司应收取比支付给被保险人的金额更高的保费。因此,保险公司投入了大量 时间、精力和金钱来创建准确预测医疗保健成本的模型。在本样例中,我们将尝试构建尽可能精准且简 单的模型来完成预测。 导入数据集 Load libraries library(ggplot2) library(ggthemes) library(psych) library(relaimpo)
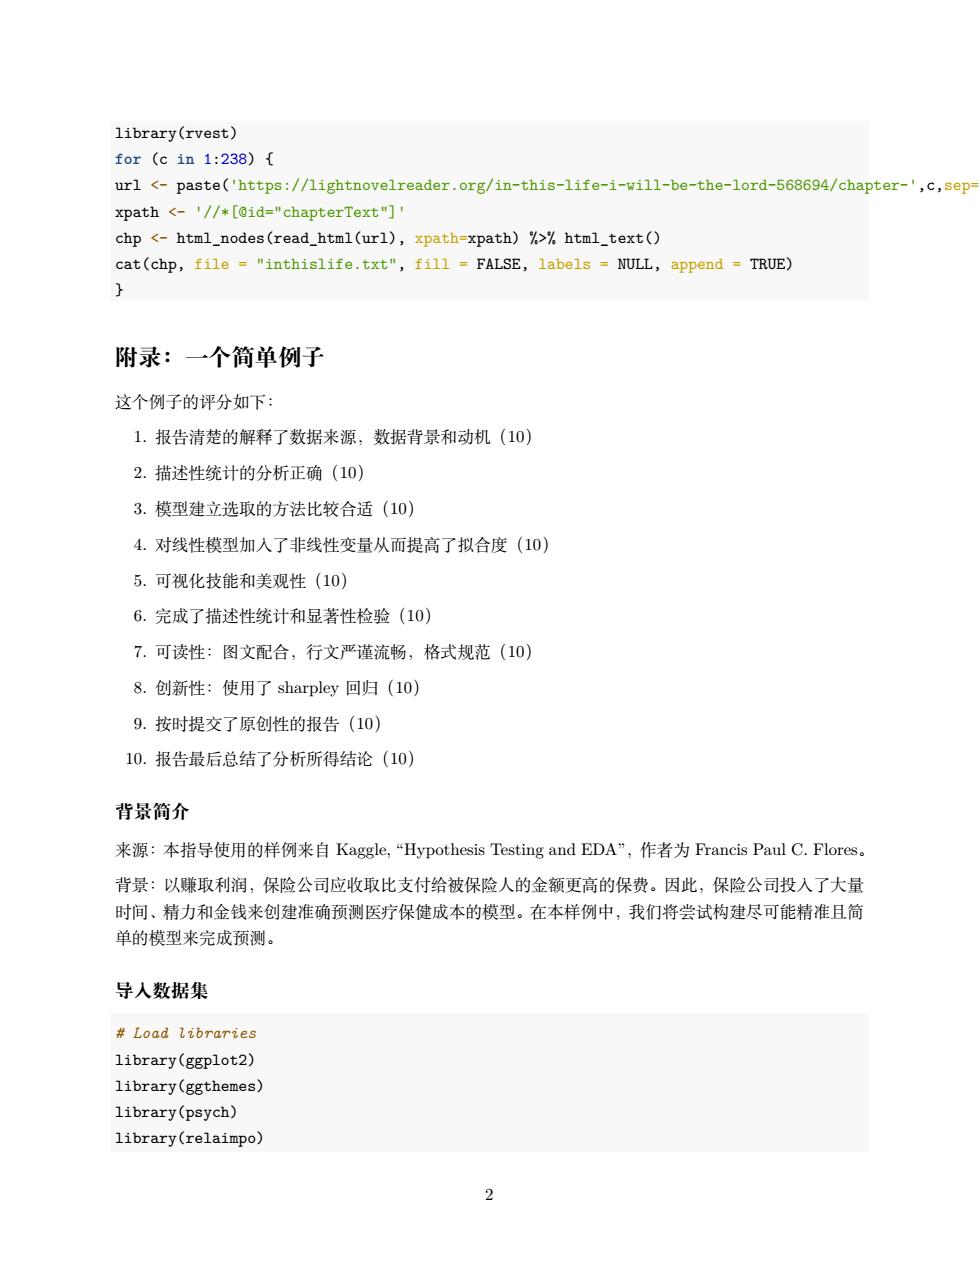
library(rvest) for (c in 1:238) { url % html_text() cat(chp, file = "inthislife.txt", fill = FALSE, labels = NULL, append = TRUE) } 附录:一个简单例子 这个例子的评分如下: 1. 报告清楚的解释了数据来源,数据背景和动机(10) 2. 描述性统计的分析正确(10) 3. 模型建立选取的方法比较合适(10) 4. 对线性模型加入了非线性变量从而提高了拟合度(10) 5. 可视化技能和美观性(10) 6. 完成了描述性统计和显著性检验(10) 7. 可读性:图文配合,行文严谨流畅,格式规范(10) 8. 创新性:使用了 sharpley 回归(10) 9. 按时提交了原创性的报告(10) 10. 报告最后总结了分析所得结论(10) 背景简介 来源:本指导使用的样例来自 Kaggle, “Hypothesis Testing and EDA”,作者为 Francis Paul C. Flores。 背景:以赚取利润,保险公司应收取比支付给被保险人的金额更高的保费。因此,保险公司投入了大量 时间、精力和金钱来创建准确预测医疗保健成本的模型。在本样例中,我们将尝试构建尽可能精准且简 单的模型来完成预测。 导入数据集 # Load libraries library(ggplot2) library(ggthemes) library(psych) library(relaimpo) 2
杂读取数据集 insurance<-read.csv("-/Downloads/insurance.csv") #快速检查数据集的基本内容 head(insurance,n 5) str(insurance) 你需要解释正如我们所看到的,我们正在处理一个比较小的数据集,只有1338个观测值和7个变量 我们在这里最感兴趣的是变量charges,这是我们的顶测变量。 数据探索 #描述性统计量 summary(insurance) 受访者的性别和地区分布均匀,年龄从18岁到64岁不等。非吸烟者与吸烟者的比例为4比1。平均 医疗费用为13,270美元,中位数为9382美元。 #分地区 describeBy(insurance$charges,insurance$region) ggplot(data insurance,aes(region,charges))+geom_boxplot(fill =c(2:5))+ theme_classic()+ggtitle("Boxplot of Medical Charges per Region") 从上图可以看出,地区对医疗费用的影响不大 幸吸烟状况 describeBy(insurance$charges,insurance$smoker) ggplot(data=insurance,aes(smoker,charges))+geom_boxplot(fill =c(2:3))+ theme_classic()+ggtitle("Boxplot of Medical Charges by Smoking Status") 另一方面,吸烟状况却不是这样。可以明显看出的是,吸烟者在医疗费用方面的花费比不吸烟者高出近 4倍。 #性别 describeBy(insuranceScharges.insurance$sex) ggplot(data=insurance,aes(sex,charges))+geom_boxplot(fill=c(2:3))+ theme_classic()+ggtitle("Boxplot of Medical Charges by Gender") 医疗费用似乎也不受性别影响。 来孩子数量 describeBy(insurance$charges,insuranceSchildren) ggplot(data -insurance,aes(as.factor(children),charges))+geom_boxplot(fill-c(2:7))+ theme_classic()+xlab("children")+ 3
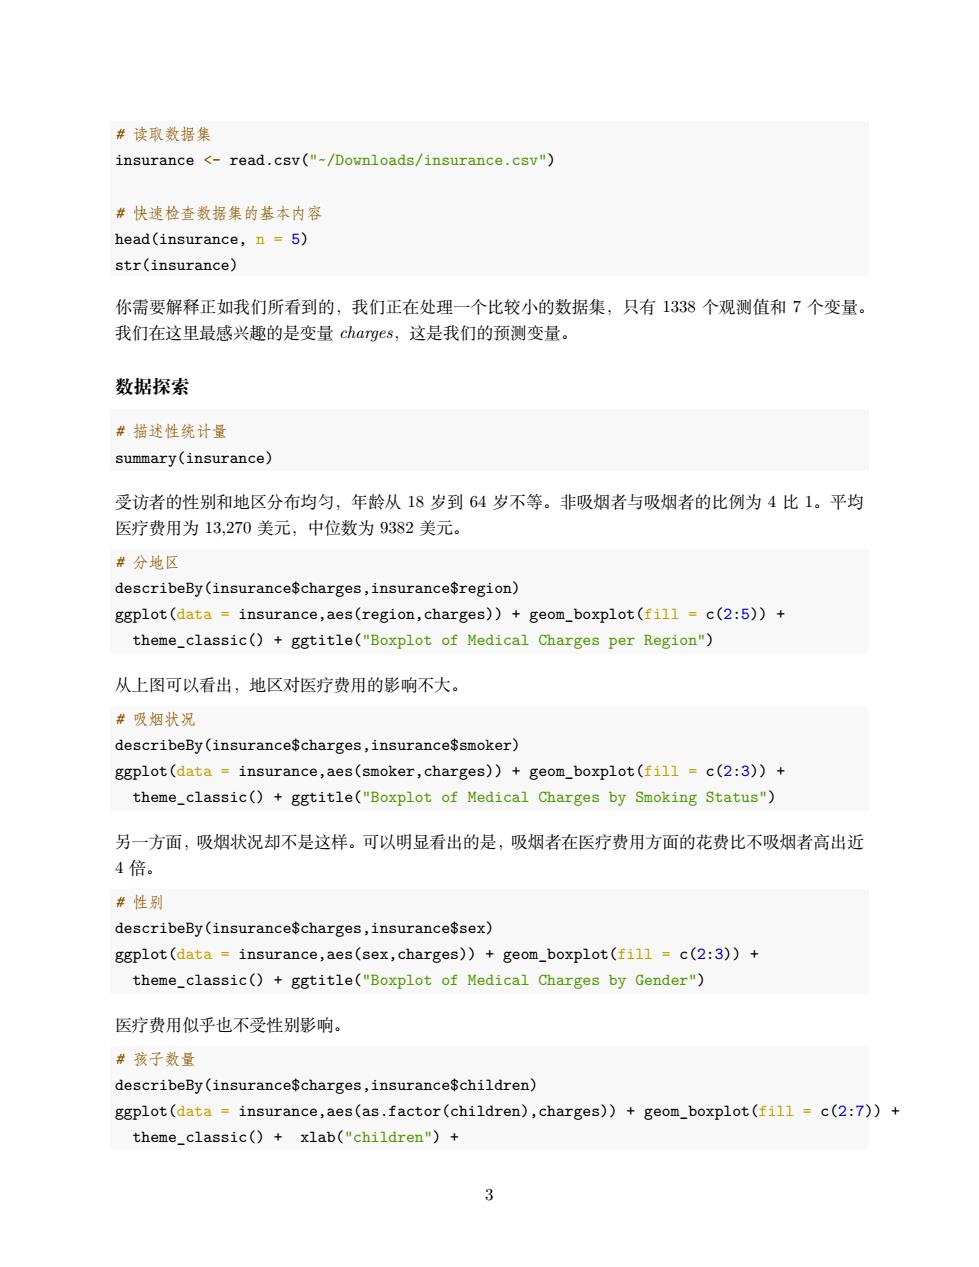
# 读取数据集 insurance <- read.csv("~/Downloads/insurance.csv") # 快速检查数据集的基本内容 head(insurance, n = 5) str(insurance) 你需要解释正如我们所看到的,我们正在处理一个比较小的数据集,只有 1338 个观测值和 7 个变量。 我们在这里最感兴趣的是变量 charges,这是我们的预测变量。 数据探索 # 描述性统计量 summary(insurance) 受访者的性别和地区分布均匀,年龄从 18 岁到 64 岁不等。非吸烟者与吸烟者的比例为 4 比 1。平均 医疗费用为 13,270 美元,中位数为 9382 美元。 # 分地区 describeBy(insurance$charges,insurance$region) ggplot(data = insurance,aes(region,charges)) + geom_boxplot(fill = c(2:5)) + theme_classic() + ggtitle("Boxplot of Medical Charges per Region") 从上图可以看出,地区对医疗费用的影响不大。 # 吸烟状况 describeBy(insurance$charges,insurance$smoker) ggplot(data = insurance,aes(smoker,charges)) + geom_boxplot(fill = c(2:3)) + theme_classic() + ggtitle("Boxplot of Medical Charges by Smoking Status") 另一方面,吸烟状况却不是这样。可以明显看出的是,吸烟者在医疗费用方面的花费比不吸烟者高出近 4 倍。 # 性别 describeBy(insurance$charges,insurance$sex) ggplot(data = insurance,aes(sex,charges)) + geom_boxplot(fill = c(2:3)) + theme_classic() + ggtitle("Boxplot of Medical Charges by Gender") 医疗费用似乎也不受性别影响。 # 孩子数量 describeBy(insurance$charges,insurance$children) ggplot(data = insurance,aes(as.factor(children),charges)) + geom_boxplot(fill = c(2:7)) + theme_classic() + xlab("children") + 3
ggtitle("Boxplot of Medical Charges by Number of Children") 与其他群体相比,有5个孩子的人的医疗支出平均更少。 来从bmi创建新变量 insurance$bmi30 =30,"yes","no") 幸肥胖状况 describeBy(insurance$charges,insurance$bmi30) ggplot(data -insurance,aes(bmi30,charges))+geom_boxplot(fill -c(2:3))+ theme_classic()+ggtitle("Boxplot of Medical Charges by Obesity") 创建新变量bm30背后的想法是,0是肥胖的bmi阈值,我们都知道肥胖在一个人的健康中起着巨 大的作用。正如我们所见,虽然肥胖者和非肥胖者的医疗费用中位数相同,但他们的平均支出相差近 5000美元。 pairs.panels(insurance[c("age","mi","children","charges")]) 我们可以看到,在我们的数值变量中,age与charges的相关性最高。我们可以从该图中得出的另一个 观察结果是,我们的数值之间没有一个高度相关,因此多重共线性不会成为问题。另一件需要注意的事 情是,年龄和收费之间的关系可能根本不是真正的线性关系。 构建模型 #从原始数据集创建模型 ins_model <-1m(charges-age sex bmi children smoker region,data insurance) summary(ins_model) 在第一个模型中,我们使用了数据集中包含的那些原始变量,得到了0.7509的r平方,这意味charges 的75.09%的变化可以通过我们包含的自变量集来解释。我们还可以观察到,除性别外,我们包含的所 有自变量都是医疗费用的统计显者预测因子(p值小于0.05<显若性水平). #创建新变量年龄的平方 insuranceSage2 <-insuranceSage2 #第二个模型 ins_model2 <-1m(charges-age age2 children bmi sex bmi30*smoker region,data insu summary(ins_model2) 在这一部分中做的第一件事是创建一个新的变量ag2,它是年龄的平方。正如之前所说的,年龄和费 用之间的关系可能不是完全线性的,所以我们在模型中引入变量ag©2来处理这种非线性。正如我们所 看到的,通过添加我们导出的这些变量,我们的模型得到了显着改进。我们现在有0.8664的r平方,这 意味着86.64%的方差变化可以用模型中的自变量来解释。与前一个模型相比,第二个模型的调整后的
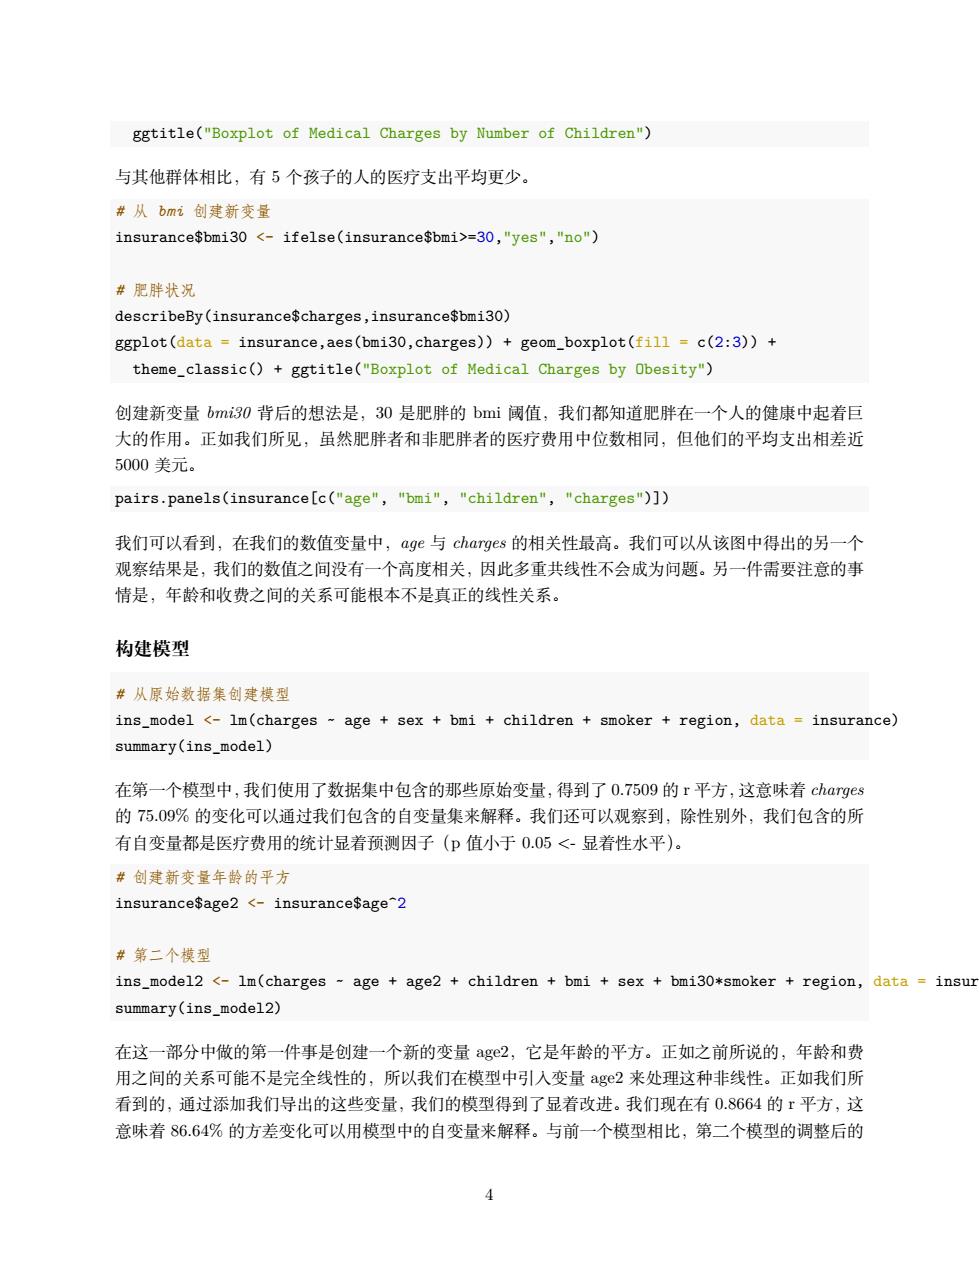
ggtitle("Boxplot of Medical Charges by Number of Children") 与其他群体相比,有 5 个孩子的人的医疗支出平均更少。 # 从 bmi 创建新变量 insurance$bmi30 =30,"yes","no") # 肥胖状况 describeBy(insurance$charges,insurance$bmi30) ggplot(data = insurance,aes(bmi30,charges)) + geom_boxplot(fill = c(2:3)) + theme_classic() + ggtitle("Boxplot of Medical Charges by Obesity") 创建新变量 bmi30 背后的想法是,30 是肥胖的 bmi 阈值,我们都知道肥胖在一个人的健康中起着巨 大的作用。正如我们所见,虽然肥胖者和非肥胖者的医疗费用中位数相同,但他们的平均支出相差近 5000 美元。 pairs.panels(insurance[c("age", "bmi", "children", "charges")]) 我们可以看到,在我们的数值变量中,age 与 charges 的相关性最高。我们可以从该图中得出的另一个 观察结果是,我们的数值之间没有一个高度相关,因此多重共线性不会成为问题。另一件需要注意的事 情是,年龄和收费之间的关系可能根本不是真正的线性关系。 构建模型 # 从原始数据集创建模型 ins_model <- lm(charges ~ age + sex + bmi + children + smoker + region, data = insurance) summary(ins_model) 在第一个模型中,我们使用了数据集中包含的那些原始变量,得到了 0.7509 的 r 平方,这意味着 charges 的 75.09% 的变化可以通过我们包含的自变量集来解释。我们还可以观察到,除性别外,我们包含的所 有自变量都是医疗费用的统计显着预测因子(p 值小于 0.05 <- 显着性水平)。 # 创建新变量年龄的平方 insurance$age2 <- insurance$age^2 # 第二个模型 ins_model2 <- lm(charges ~ age + age2 + children + bmi + sex + bmi30*smoker + region, data = insurance) summary(ins_model2) 在这一部分中做的第一件事是创建一个新的变量 age2,它是年龄的平方。正如之前所说的,年龄和费 用之间的关系可能不是完全线性的,所以我们在模型中引入变量 age2 来处理这种非线性。正如我们所 看到的,通过添加我们导出的这些变量,我们的模型得到了显着改进。我们现在有 0.8664 的 r 平方,这 意味着 86.64% 的方差变化可以用模型中的自变量来解释。与前一个模型相比,第二个模型的调整后的 4
R平方也好很多,这进一步验证了我们的观点。 将线性回归模型可视化 我们先来看看医疗费用与一个人的年龄和吸烟状况的关系。 attach(insurance) plot(age,charges,col-smoker) summary(charges [smoker=="no"]) summary(charges[smoker--"yes"]) 我们可以在这里看到一个有趣的趋势,随着人们年龄的增长,他们的医疗费用会更高,这是意料之中 的。但是,无论年龄大小,吸烟者的医疗费用都比不吸烟者高,正如之前推断的那样。我们将尝试创建 一个仅使用年龄和吸烟状况的模型,以进行比较。看起来吸烟者是预测医疗费用中最重要的一个变量, ins_model3<-1m(charges-age+smoker,insurance) summary(ins_model3) 仅使用年龄和吸烟者作为自变量,我们建立了一个r平方为7214%的模型,这与我们使用所有原始变 量的第一个模型相当。在回归分析中,我们希望创建一个准确但同时尽可能简单的模型。因此,如果我 必须选择,我会洗择第三个模型而不是第一个模型。但是,第二个模型比这些模型中的任何一个都好 因此我们建议采用它。 intercepts<-c(coef(ins_model3)["(Intercept)"],coef(ins_model3)["(Intercept)"]+coef(ins_model3)["sm lines.df<-data.frame(intercepts=intercepts, slopes -rep(coef(ins_model3)["age"],2), smoker levels(insuranceSsmoker)) qplot(x-age,y=charges,color-smoker,data-insurance)+geom_abline(aes(intercept-intercepts,slope=slop 我们将构建的回归模型可视化。图中有2条线,这表明我们有2个不同的回归方程,它们具有相同的 斜率但不同的截距。回归线的斜率等于变量ag(274.87)的系数。而就截距而言,吸烟者截距比非吸烟 者高23,855.30。这表明,平均而言,吸烟者的医疗费用根据年龄增加约24,000美元。(吸烟有害健康!) 下面这一部分使用的Sharpley回归,不做要求,仅供参考 Variable Importance ins_model2_shapley<-calc.relimp(ins_model2,type-"lmg") ins_model2_shapley ins_model2_shapley$1mg As we have concluded,the second model has the best performance with the highest r-squared out of the 3 models we have built.We would use it to derive the variable importance of our predictors.We will use a statistical method called shapley value regression which is a solution that originated
R 平方也好很多,这进一步验证了我们的观点。 将线性回归模型可视化 我们先来看看医疗费用与一个人的年龄和吸烟状况的关系。 attach(insurance) plot(age,charges,col=smoker) summary(charges[smoker=="no"]) summary(charges[smoker=="yes"]) 我们可以在这里看到一个有趣的趋势,随着人们年龄的增长,他们的医疗费用会更高,这是意料之中 的。但是,无论年龄大小,吸烟者的医疗费用都比不吸烟者高,正如之前推断的那样。我们将尝试创建 一个仅使用年龄和吸烟状况的模型,以进行比较。看起来吸烟者是预测医疗费用中最重要的一个变量。 ins_model3<-lm(charges~age+smoker,insurance) summary(ins_model3) 仅使用年龄和吸烟者作为自变量,我们建立了一个 r 平方为 72.14% 的模型,这与我们使用所有原始变 量的第一个模型相当。在回归分析中,我们希望创建一个准确但同时尽可能简单的模型。因此,如果我 必须选择,我会选择第三个模型而不是第一个模型。但是,第二个模型比这些模型中的任何一个都好, 因此我们建议采用它。 intercepts<-c(coef(ins_model3)["(Intercept)"],coef(ins_model3)["(Intercept)"]+coef(ins_model3)["smokeryes"]) lines.df<- data.frame(intercepts = intercepts, slopes = rep(coef(ins_model3)["age"], 2), smoker = levels(insurance$smoker)) qplot(x=age,y=charges,color=smoker,data=insurance)+geom_abline(aes(intercept=intercepts,slope=slopes,color=smoker),data=lines.df) + theme_few() + scale_y_continuous(breaks = seq(0,65000,5000)) 我们将构建的回归模型可视化。图中有 2 条线,这表明我们有 2 个不同的回归方程,它们具有相同的 斜率但不同的截距。回归线的斜率等于变量 age (274.87) 的系数。而就截距而言,吸烟者截距比非吸烟 者高 23,855.30。这表明,平均而言,吸烟者的医疗费用根据年龄增加约 24,000 美元。(吸烟有害健康!) 下面这一部分使用的 Sharpley 回归,不做要求,仅供参考。 Variable Importance ins_model2_shapley<-calc.relimp(ins_model2,type="lmg") ins_model2_shapley ins_model2_shapley$lmg As we have concluded, the second model has the best performance with the highest r-squared out of the 3 models we have built. We would use it to derive the variable importance of our predictors. We will use a statistical method called shapley value regression which is a solution that originated 5

from the Game Theory concept developed by Lloyd Shapley in the 1950s.It's aim is to fairly allocate predictor importance in regression analysis.Given n number of independent variables (IV),we will run all combination of linear regression models using this list of IVs against the dependent variable (DV)and get each model's R-Squared.To get the importance measure of each independent variable (IV),the average contribution to the total R-squared of each IV is computed by decomposing the total R-squared and computing for the proportion marginal contribution of each IV. Let's say we have 2 IVs A and B and a dependent variable Y.We can build 3 models as follows:1) Y-A 2)Y-B3)Y-A+B and each model would have their respective R-squared. To get the Shapley Value of A we have to decompose the r-squared of the third model and derive Attribute A's marginal contribution. ShapleyValue(A)=[R-squared(AB)-R-squared(B)]+R-squared(A)/2 We have used the cale.relimp()function from the relaimpo package to determine the Shapley Value of our predictors. sum(ins_model2_shapley$lmg) As we can see,the Shapley Value of our attributes sums up to the R-squared of our second regression model.Like what I have said,Shapley Value Regression is a variance decomposition method by means of computing the marginal contribution of each attribute. barplot(sort(ins_model2_shapley$lmg,decreasing=TRUE),col-c(2:10),main-"Relative Importance of Pr The Shapley Value scores of each attribute shows their marginal contribution to the overall r-squared (0.8664)of the second model.So we can conclude that,on the 86.64%total variance explained by our model a little over60%of it is due to the attribute smoker.Results also cemented our previous hypothesis that variable smoker is the singlemost important variable in predicting medical charges.If you would also notice,smoker is followed by bmi30:smoker,age2,age, and bmi30 where majority of which are variables we have derived and not included in the original dataset.Glad we have engineered those variables up!:) 总结 在本分析中,我们使用Shapley值回归来推导医疗费用的关键因素。它在处理多重共线性问题时非常 有用,另一方面,Shaple©y值回归按比例分解r平方以解决多重共线性问题(尽管在此数据集中多重共 线性不是问题)。我们还了解了特征工程在提高模型准确性方面的重要性。注意,吸烟对您的健康有害!
from the Game Theory concept developed by Lloyd Shapley in the 1950s. It’s aim is to fairly allocate predictor importance in regression analysis. Given n number of independent variables (IV), we will run all combination of linear regression models using this list of IVs against the dependent variable (DV) and get each model’s R-Squared. To get the importance measure of each independent variable (IV), the average contribution to the total R-squared of each IV is computed by decomposing the total R-squared and computing for the proportion marginal contribution of each IV. Let’s say we have 2 IVs A and B and a dependent variable Y. We can build 3 models as follows: 1) Y~A 2) Y~B 3) Y~A+B and each model would have their respective R-squared. To get the Shapley Value of A we have to decompose the r-squared of the third model and derive Attribute A’s marginal contribution. 𝑆ℎ𝑎𝑝𝑙𝑒𝑦𝑉 𝑎𝑙𝑢𝑒(𝐴) = [𝑅 − 𝑠𝑞𝑢𝑎𝑟𝑒𝑑(𝐴𝐵) − 𝑅 − 𝑠𝑞𝑢𝑎𝑟𝑒𝑑(𝐵)] + 𝑅 − 𝑠𝑞𝑢𝑎𝑟𝑒𝑑(𝐴)/2 We have used the calc.relimp() function from the relaimpo package to determine the Shapley Value of our predictors. sum(ins_model2_shapley$lmg) As we can see, the Shapley Value of our attributes sums up to the R-squared of our second regression model. Like what I have said, Shapley Value Regression is a variance decomposition method by means of computing the marginal contribution of each attribute. barplot(sort(ins_model2_shapley$lmg,decreasing = TRUE),col=c(2:10),main="Relative Importance of Predictors",xlab="Predictor Labels",ylab="Shapley Value Regression",font.lab=2) The Shapley Value scores of each attribute shows their marginal contribution to the overall r-squared (0.8664) of the second model. So we can conclude that, on the 86.64% total variance explained by our model a little over 60% of it is due to the attribute smoker. Results also cemented our previous hypothesis that variable smoker is the singlemost important variable in predicting medical charges. If you would also notice, smoker is followed by bmi30:smoker, age2, age, and bmi30 where majority of which are variables we have derived and not included in the original dataset. Glad we have engineered those variables up! :) 总结 在本分析中,我们使用 Shapley 值回归来推导医疗费用的关键因素。它在处理多重共线性问题时非常 有用,另一方面,Shapley 值回归按比例分解 r 平方以解决多重共线性问题(尽管在此数据集中多重共 线性不是问题)。我们还了解了特征工程在提高模型准确性方面的重要性。注意,吸烟对您的健康有害! 6